Activity
5 minute read
Overview
Activity provides a central view of all AI Team threads across your organization. Rather than checking each channel individually, you can see every active thread in one place, filter by priority or status, and track performance metrics that show how effectively the AI Team handles your workload.
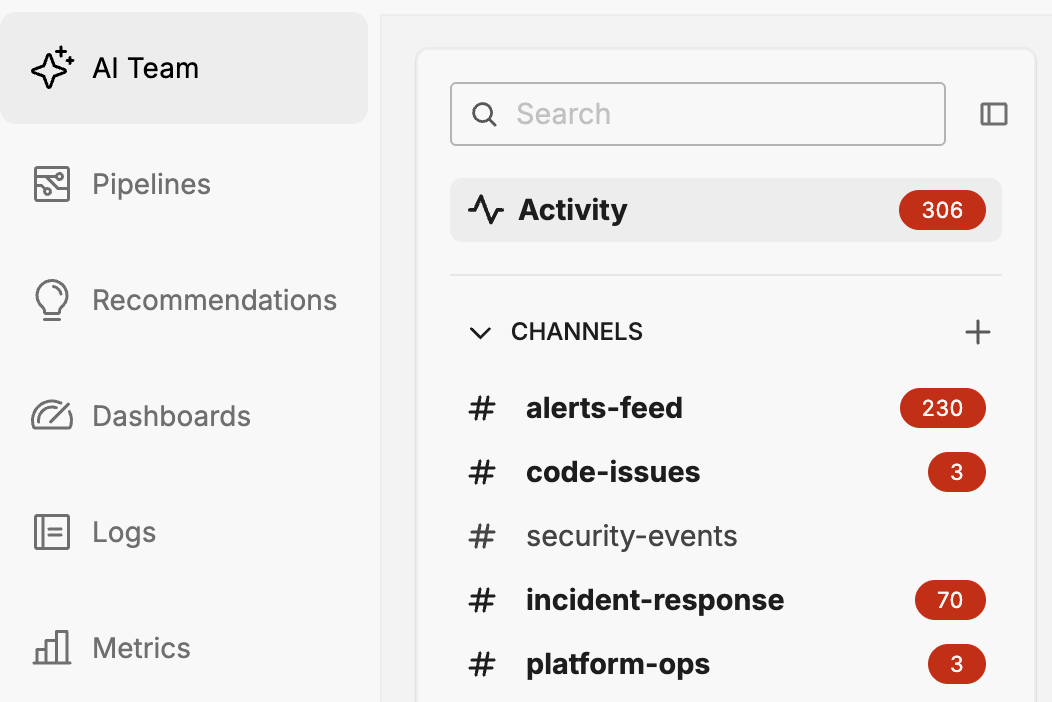
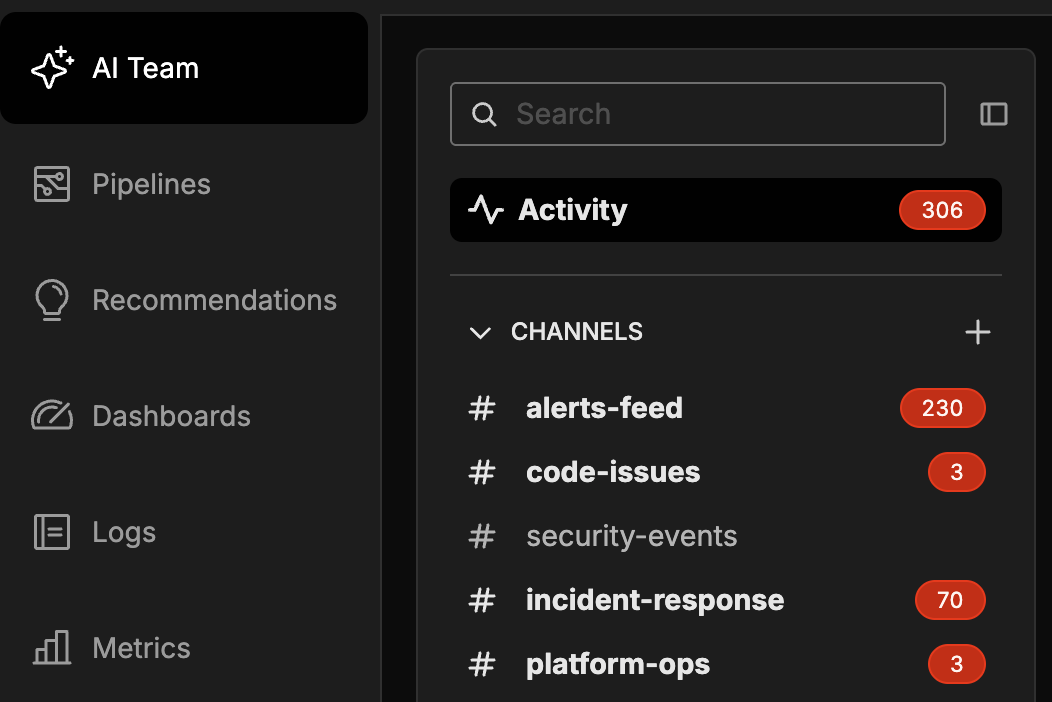
Channels in the navigation pane display visual indicators when threads need attention—bold names signal unread threads, while numbered badges indicate critical issues or threads waiting for approval. Activity consolidates this information into an actionable queue so you can start each day knowing exactly what needs your focus.
Accessing Activity
- Navigate to AI Team in the main navigation
- In the left filter panel, locate the section showing DMs, Channels, and Activity
- Click Activity
Activity displays a thread list and a metrics pane.
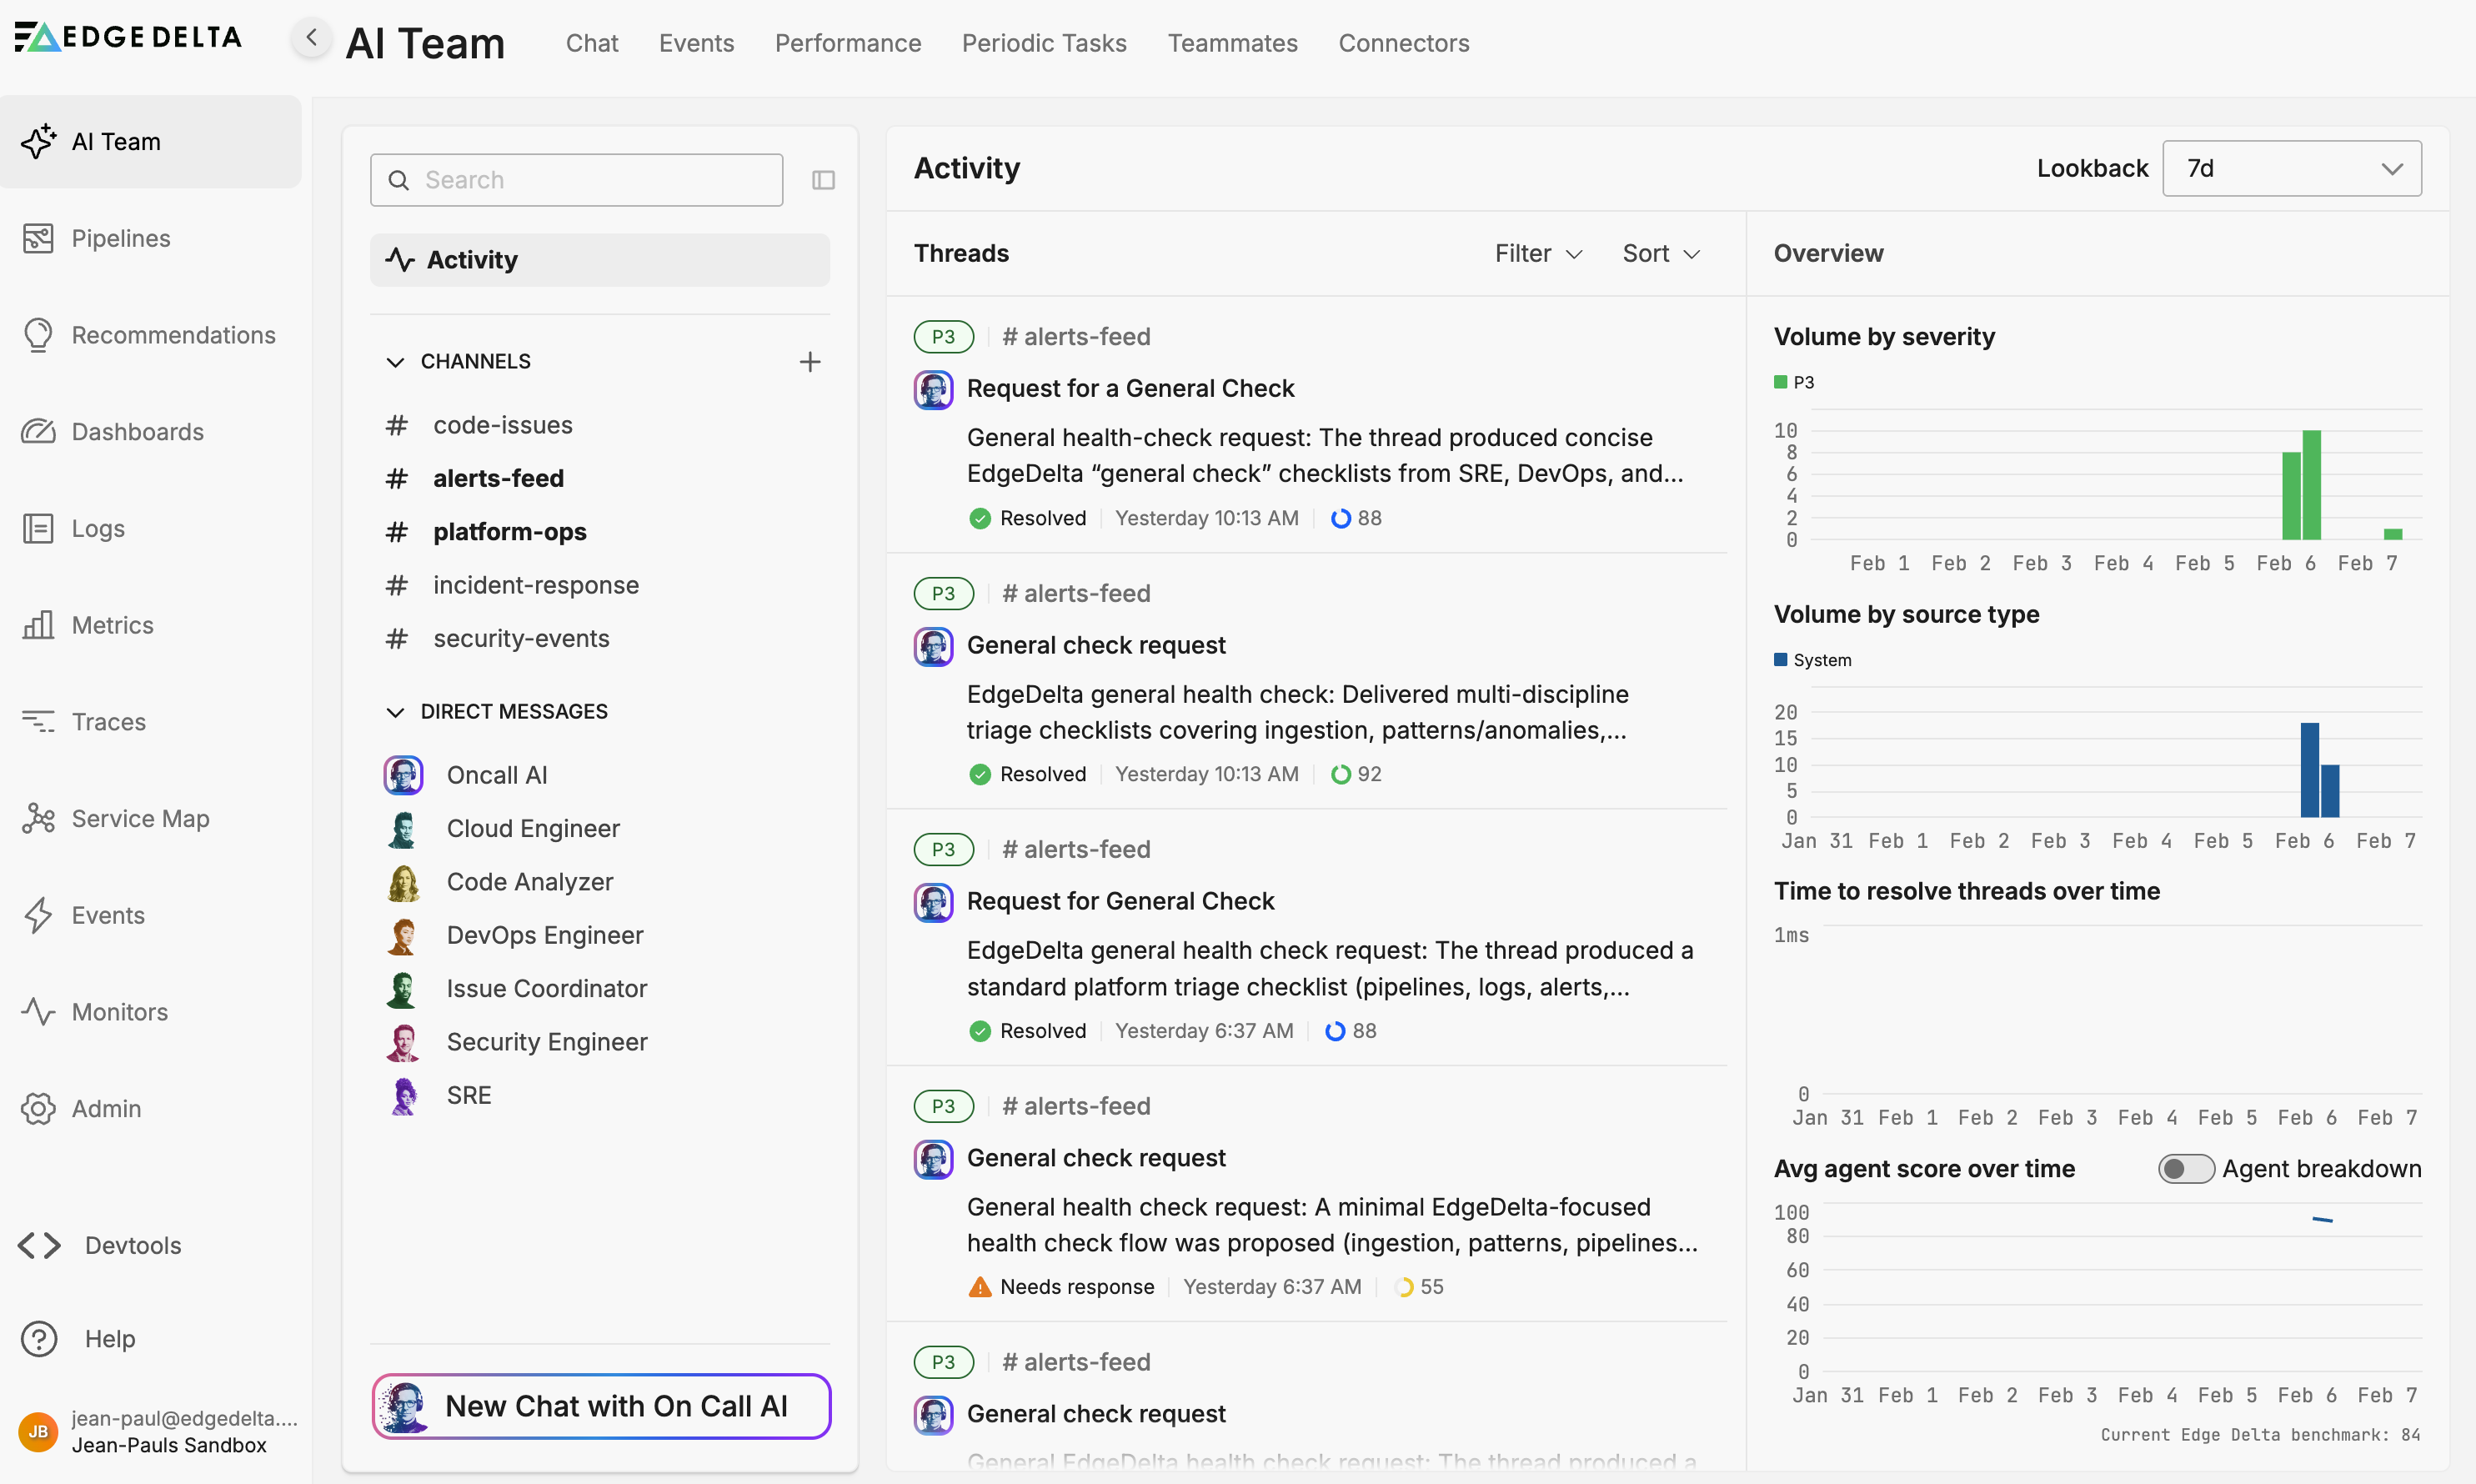
Understanding the Thread List
Each thread card shows key information at a glance:
| Element | Description |
|---|---|
| Priority badge | LLM-determined criticality level (P0, P1, P2, etc.) |
| Channel name | The channel where the thread originated (e.g., #alerts-feed) |
| Status | Current thread state such as “Waiting for approval” or “Resolved” |
| Thread title | Brief description of the thread topic |
| Timestamp | When the last activity occurred |
Channel badge indicators
Channels in the navigation pane display visual cues:
- Bold channel name – Contains unread threads
- Number badge – Count of threads requiring attention (either critical or waiting for approval)
These indicators help you quickly identify which channels have pending work without opening each one.
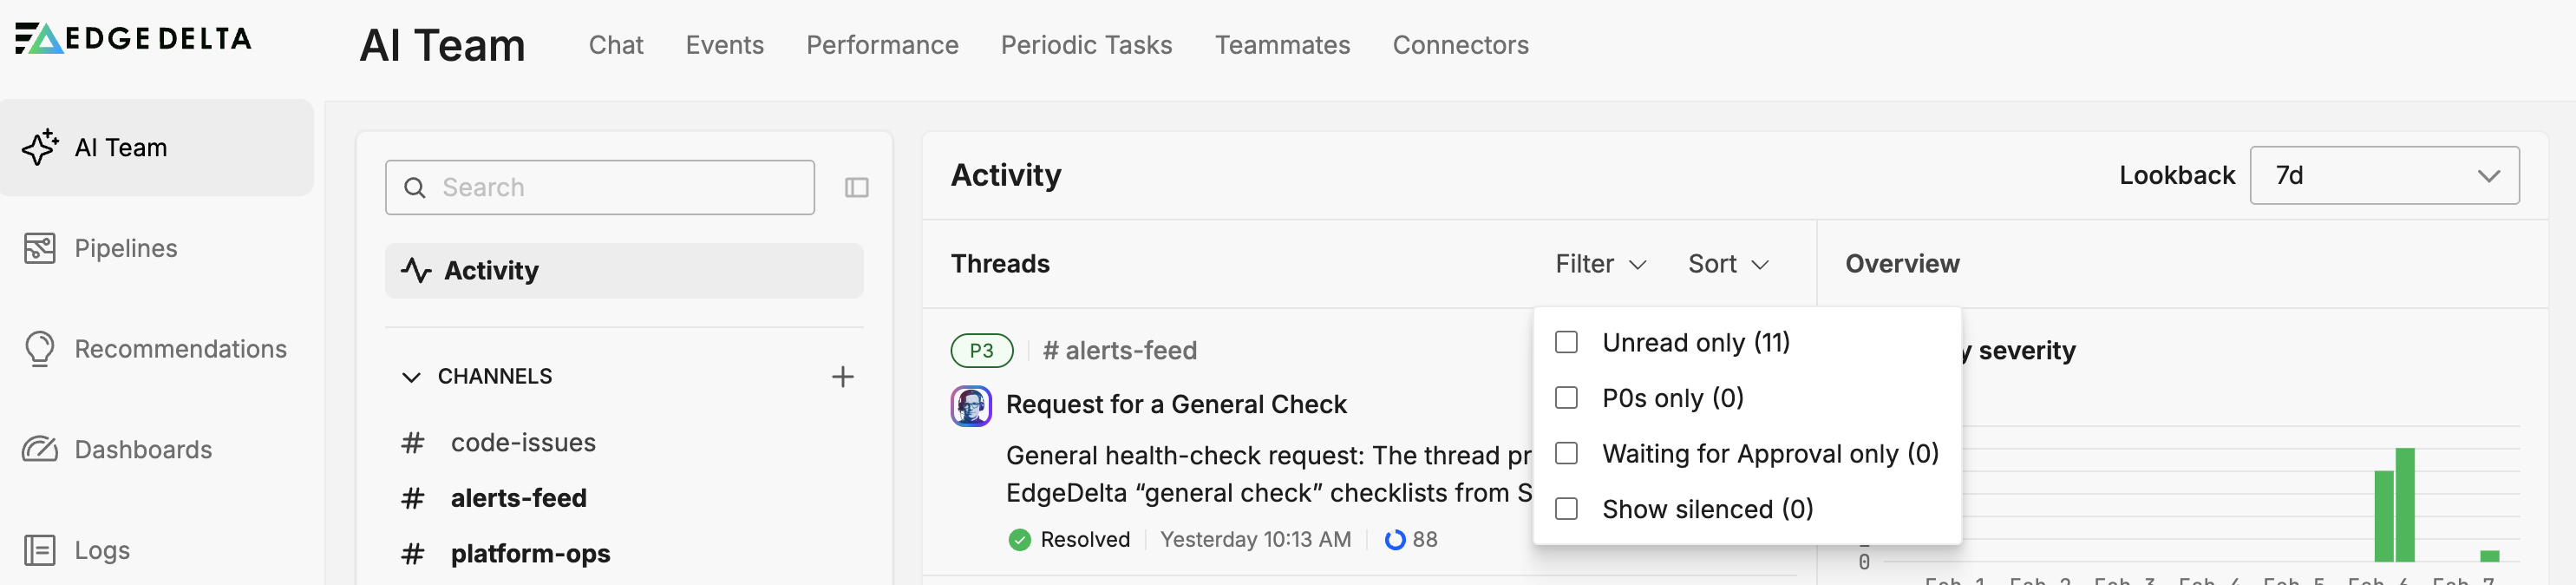
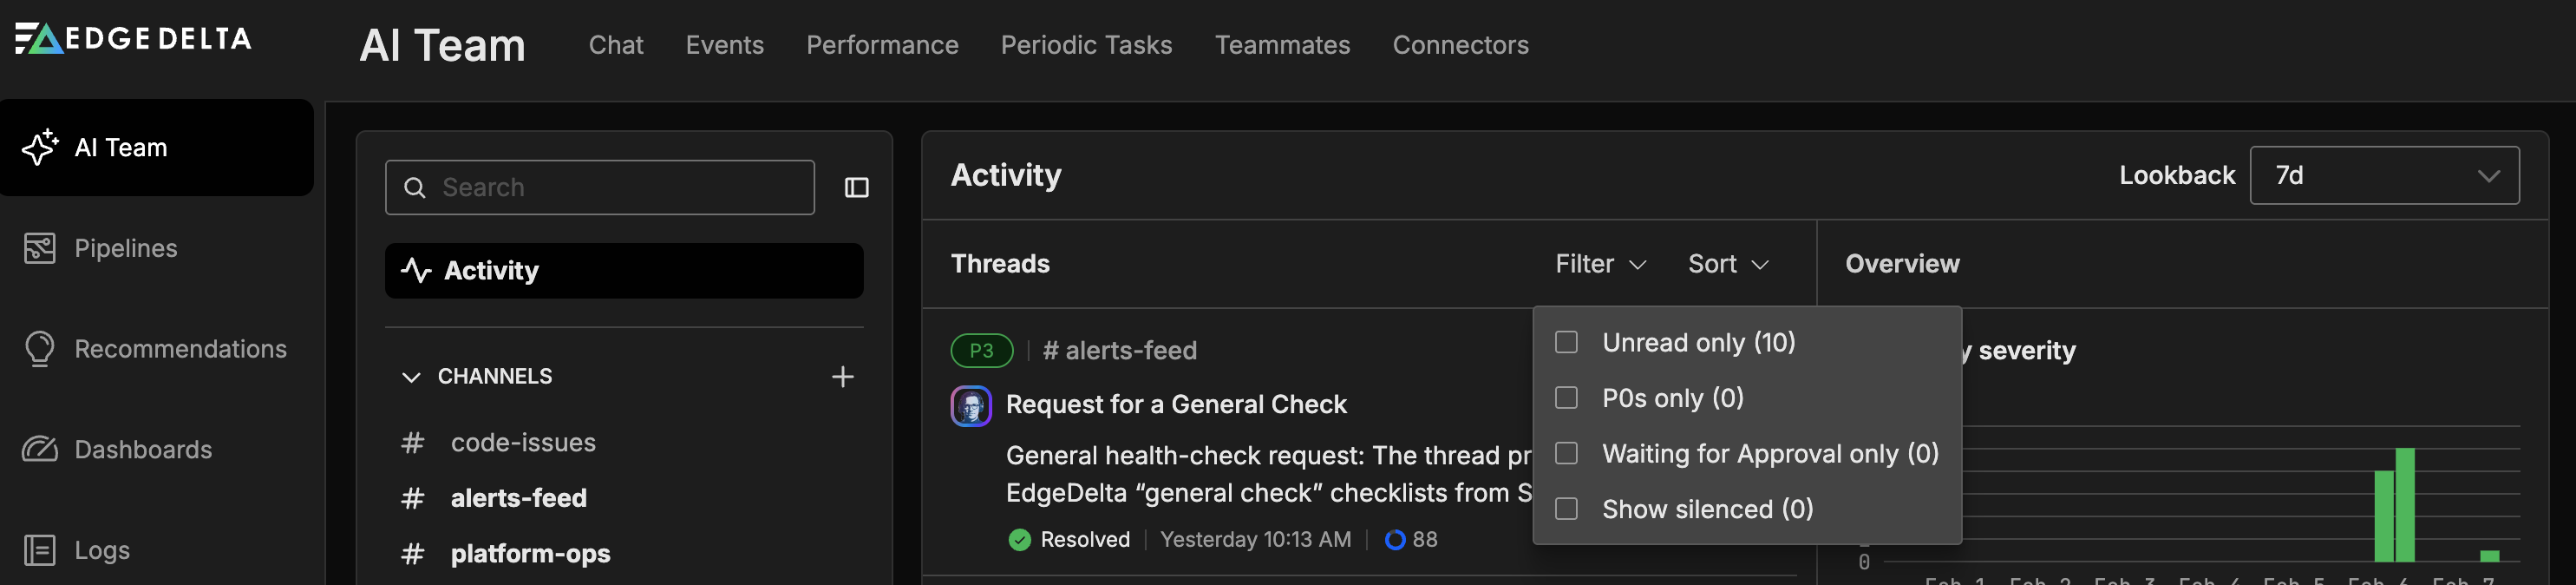
Filtering Threads
Use the filter controls to focus on specific thread categories:
- Unread – Show only threads you have not yet viewed
- P0 – Show only the highest priority threads
- Waiting for approval – Show threads where AI teammates need human authorization before proceeding
- Show silenced – Include low-criticality threads that were automatically silenced (hidden by default)
Filters can be combined. For example, selecting both Unread and P0 shows only unread critical threads.
Sorting Threads
Order the thread list by different criteria to surface the most relevant items:
| Sort Option | Description |
|---|---|
| Last Activity | Most recently updated threads appear first |
| Highest Criticality | Orders by priority level, with P0 first |
| Token Consumption | Threads consuming the most tokens appear first |
| Resolution Time | Threads open longest appear first |
| Agents Involved | Threads with the most agent participation appear first |
Choose the sort order that matches your workflow. For daily triage, Highest Criticality or Last Activity often work best. When optimizing token usage, sort by Token Consumption to identify expensive investigations.
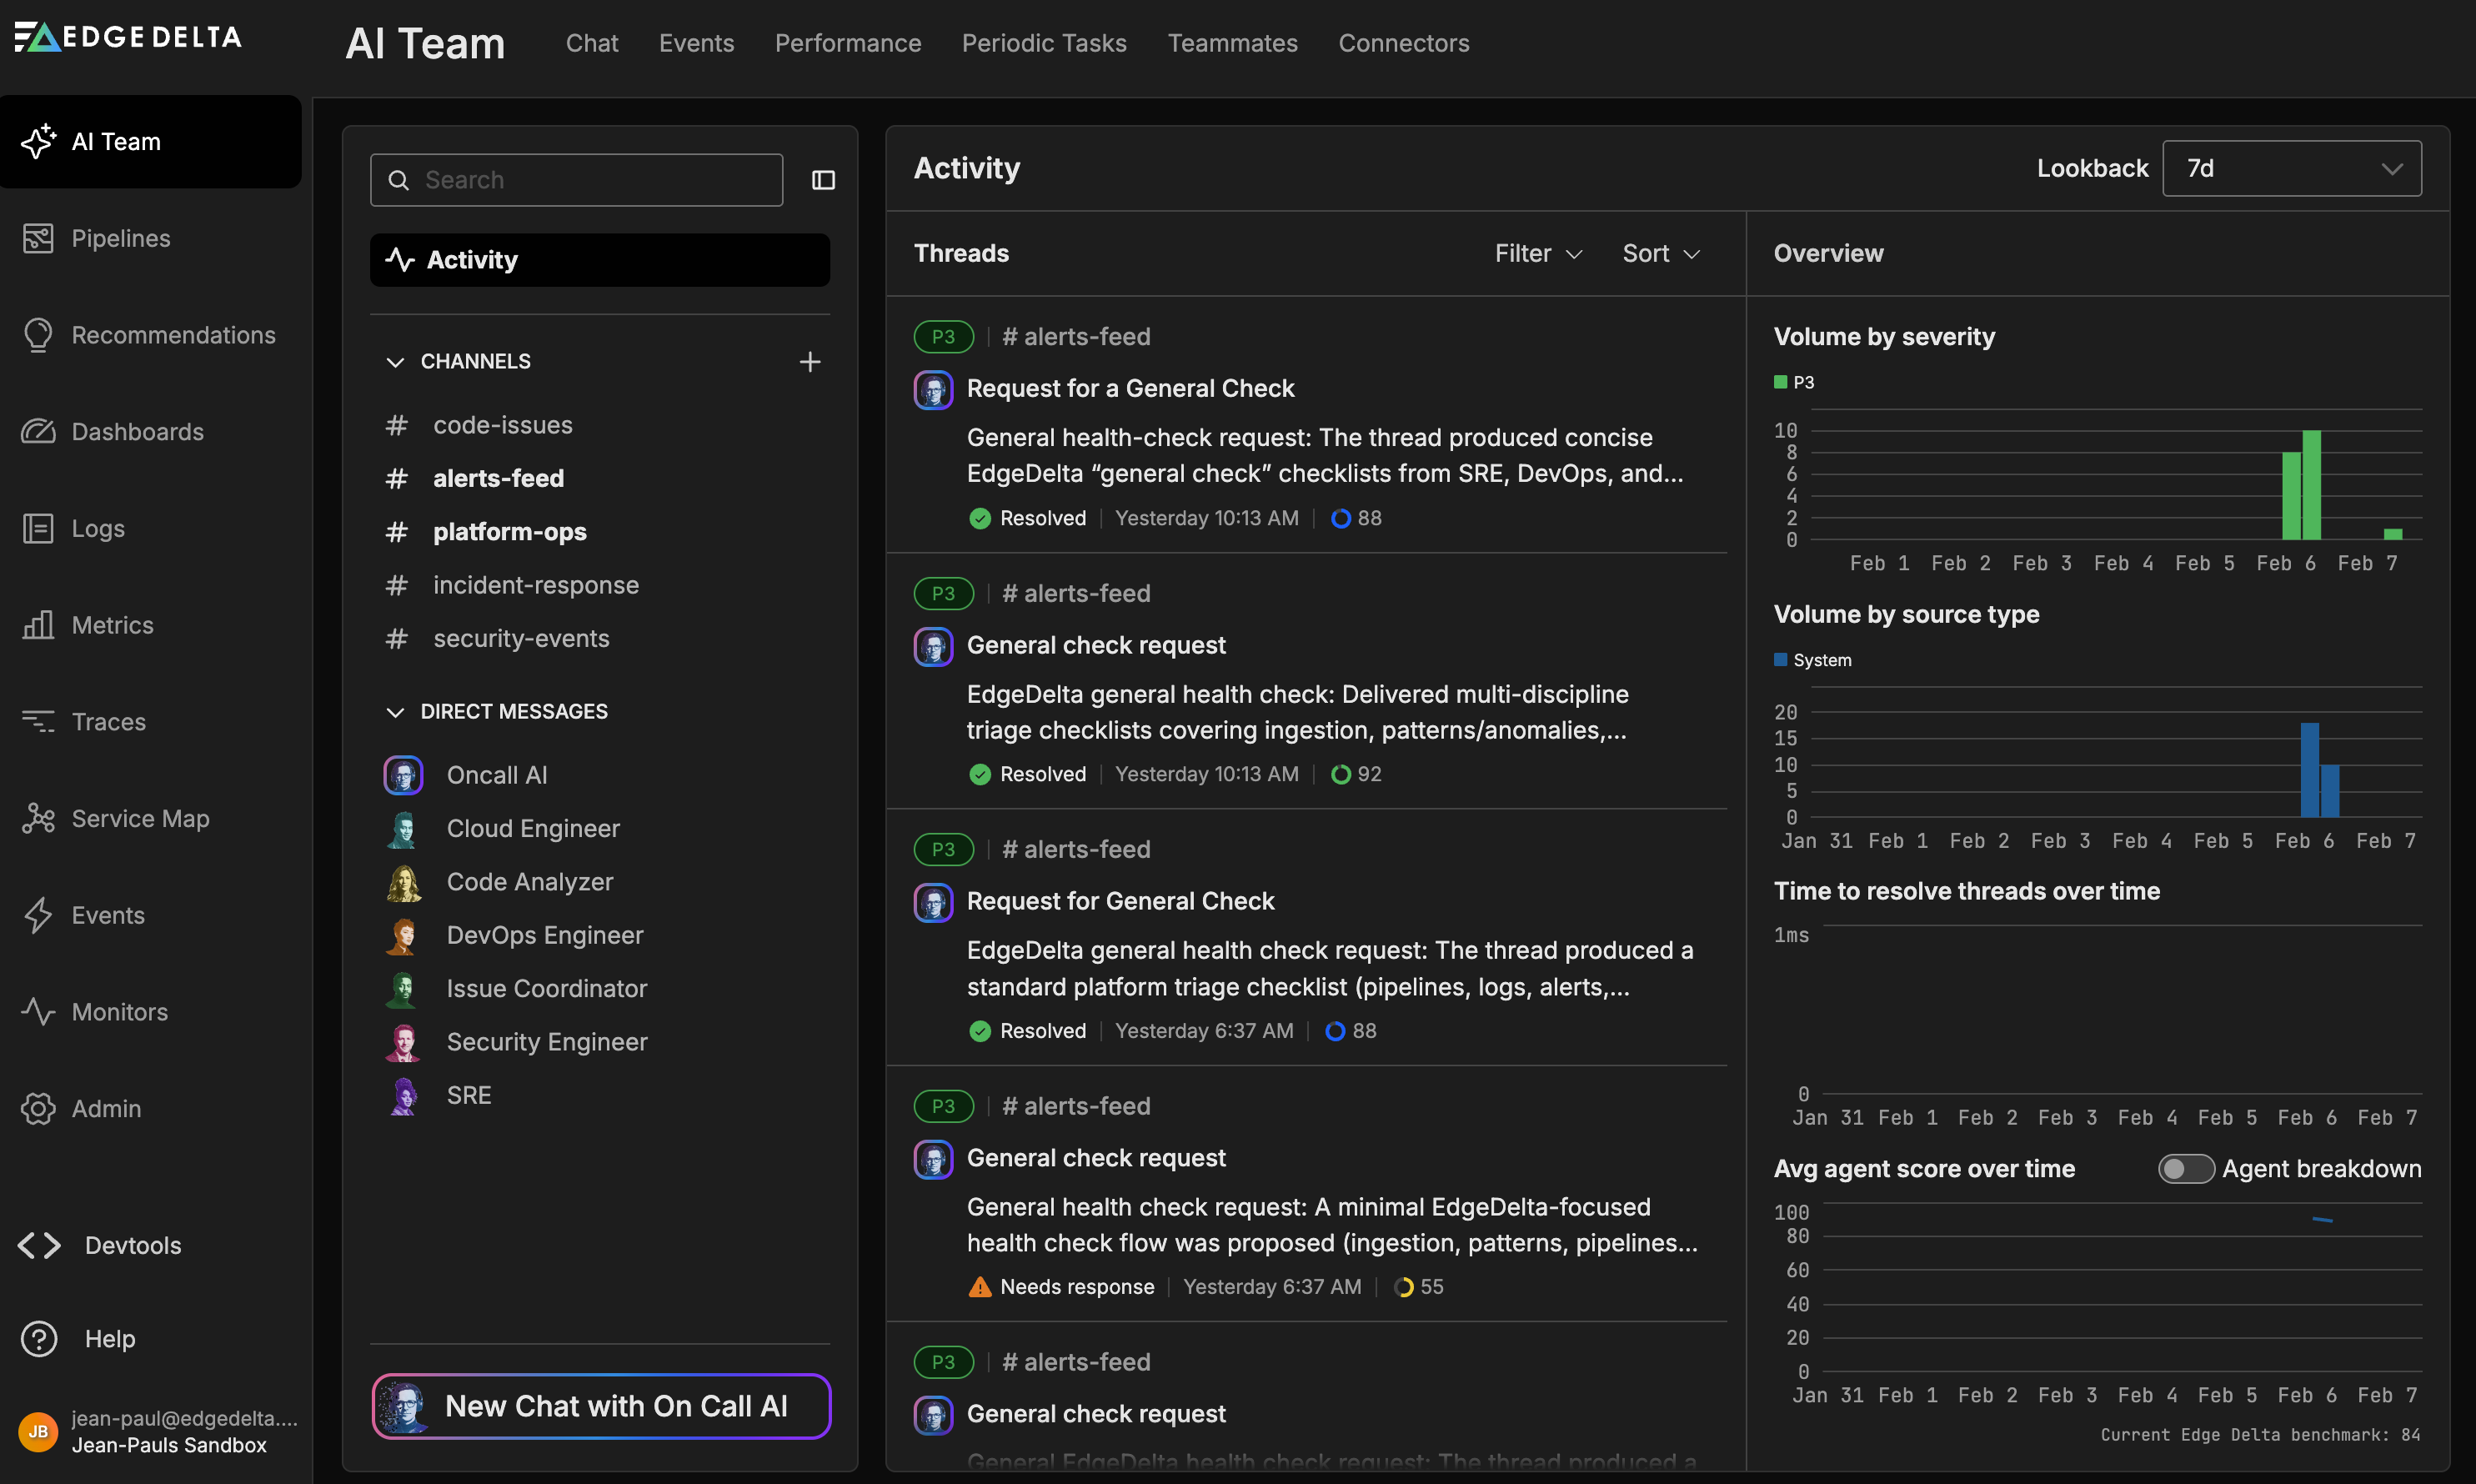
Metrics Pane
The metrics pane provides analytics to understand AI Team performance over time. A lookback filter at the top lets you adjust the time range for all metrics.
Volume by severity
A chart showing the distribution of threads by priority level. Use this to understand whether the AI Team is handling mostly routine issues or facing a spike in critical incidents.
Volume by source type
Breaks down threads by how they were initiated:
- Integration – Threads created from connector events (PagerDuty alerts, GitHub webhooks, etc.)
- User – Threads started by team members asking questions or providing instructions
This helps you understand the balance between automated and human-initiated work.
Time to resolve
Displays resolution time percentiles over time:
- P50 – Median resolution time (half of threads resolve faster)
- P90 – 90th percentile (90% of threads resolve faster)
- P99 – 99th percentile (captures outlier long-running threads)
- Average – Mean resolution time
Tracking these trends helps identify when response times are degrading or improving.
Average agent score over time
Shows how well AI teammates perform based on user ratings and completion metrics. An Agent breakdown toggle reveals individual agent performance, letting you compare how SRE, Cloud Engineer, and other specialists contribute.
The Edge Delta benchmark indicator (for example, “94”) provides a reference point comparing your organization’s AI Team performance against Edge Delta’s internal benchmarks.
Viewing Thread Details
Click any thread card to view the full conversation:
- Thread metadata – Priority level, status, total token count, and response time
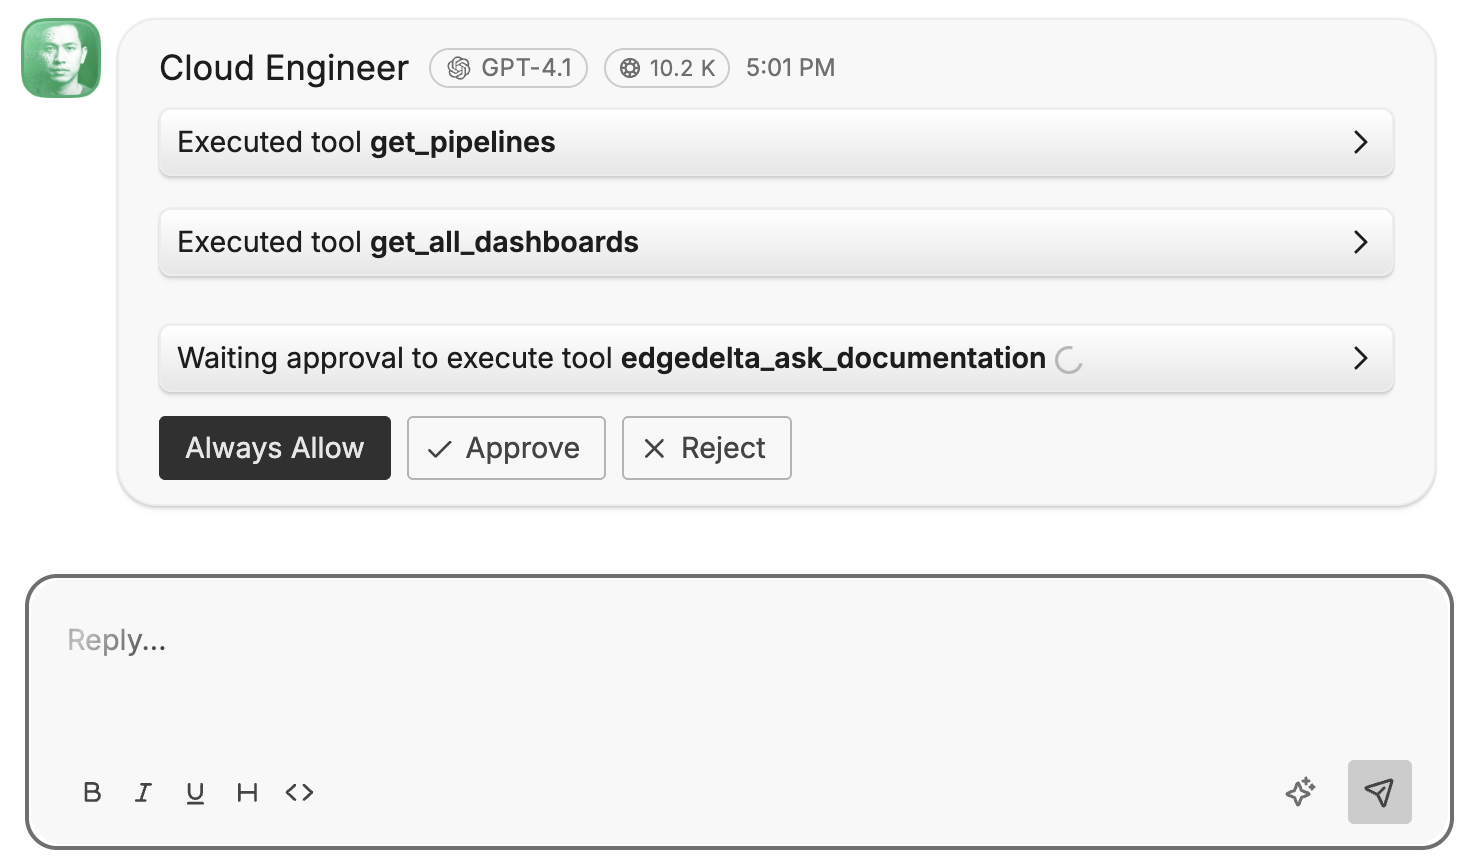
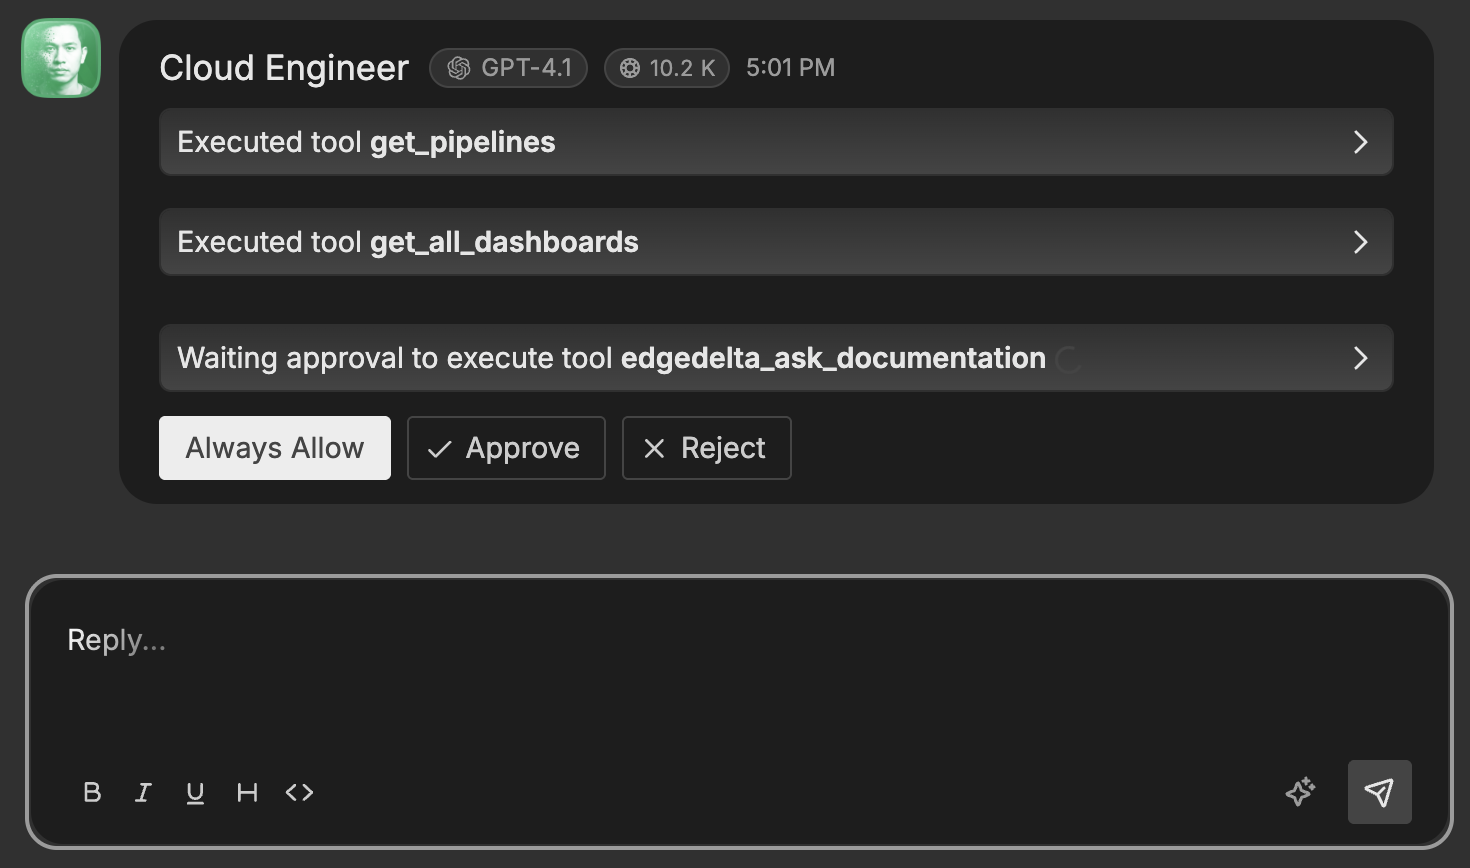
- Message history – Complete conversation including user prompts, AI responses, and tool executions
- Agent information – Which teammates participated and what models they used (e.g., SRE using GPT-4.1)
- Per-message metrics – Token count and response time for each message
From the detail view you can approve pending actions, add follow-up messages, or navigate to the thread in its home channel.
Silenced Threads
When an external event arrives from a connector like PagerDuty or GitHub, the AI Team evaluates its criticality. Events below a certain threshold are silenced—stored for reference but not triggering a full AI investigation.
Silencing conserves tokens by avoiding responses to routine events that require no action, such as:
- Informational GitHub commits with no issues
- Low-severity alerts that resolve automatically
- Routine webhook payloads with no actionable content
What gets silenced
Silencing only applies to external connector events. The following are never silenced:
- Questions or messages from users
- Scheduled workflow outputs
- Monitor-triggered alerts
Viewing silenced threads
Toggle Show silenced in the filter controls to include silenced threads in the list. Silenced threads appear with reduced emphasis and show no AI response since processing was skipped.
If you find important events are being silenced, review the connector configuration or work with your AI Team to adjust criticality thresholds.
Best Practices
- Start your day with Activity – Review P0 threads and items waiting for approval before checking individual channels.
- Focus on actionable items first – Filter to Waiting for approval to unblock AI teammates that need authorization.
- Monitor resolution time trends – Increasing P90 or P99 times may indicate complex incidents or bottlenecks requiring attention.
- Use agent scores to identify training opportunities – If a specific teammate consistently scores lower, refine its prompts or connector configuration.
- Review silenced threads periodically – Ensure the silencing threshold is not hiding important events.
Next Steps
- Channels and Direct Messages – Learn how threads flow through channels and when to use DMs
- AI Team Events – Query and analyze the raw events that trigger AI Team activity
- Specialized Teammates – Understand the pre-built specialists that handle different domains