AI Overview Dashboard
4 minute read
Overview
The AI Overview dashboard is the landing page for the Edge Delta AI Team. It answers three questions at a glance: how healthy is your environment, which problems need attention, and what is the AI Team doing about them. The dashboard combines an environment health score, the list of active issues, recent investigation threads, and a live feed of teammate activity.
To open the dashboard, click AI in the main navigation and select Overview.
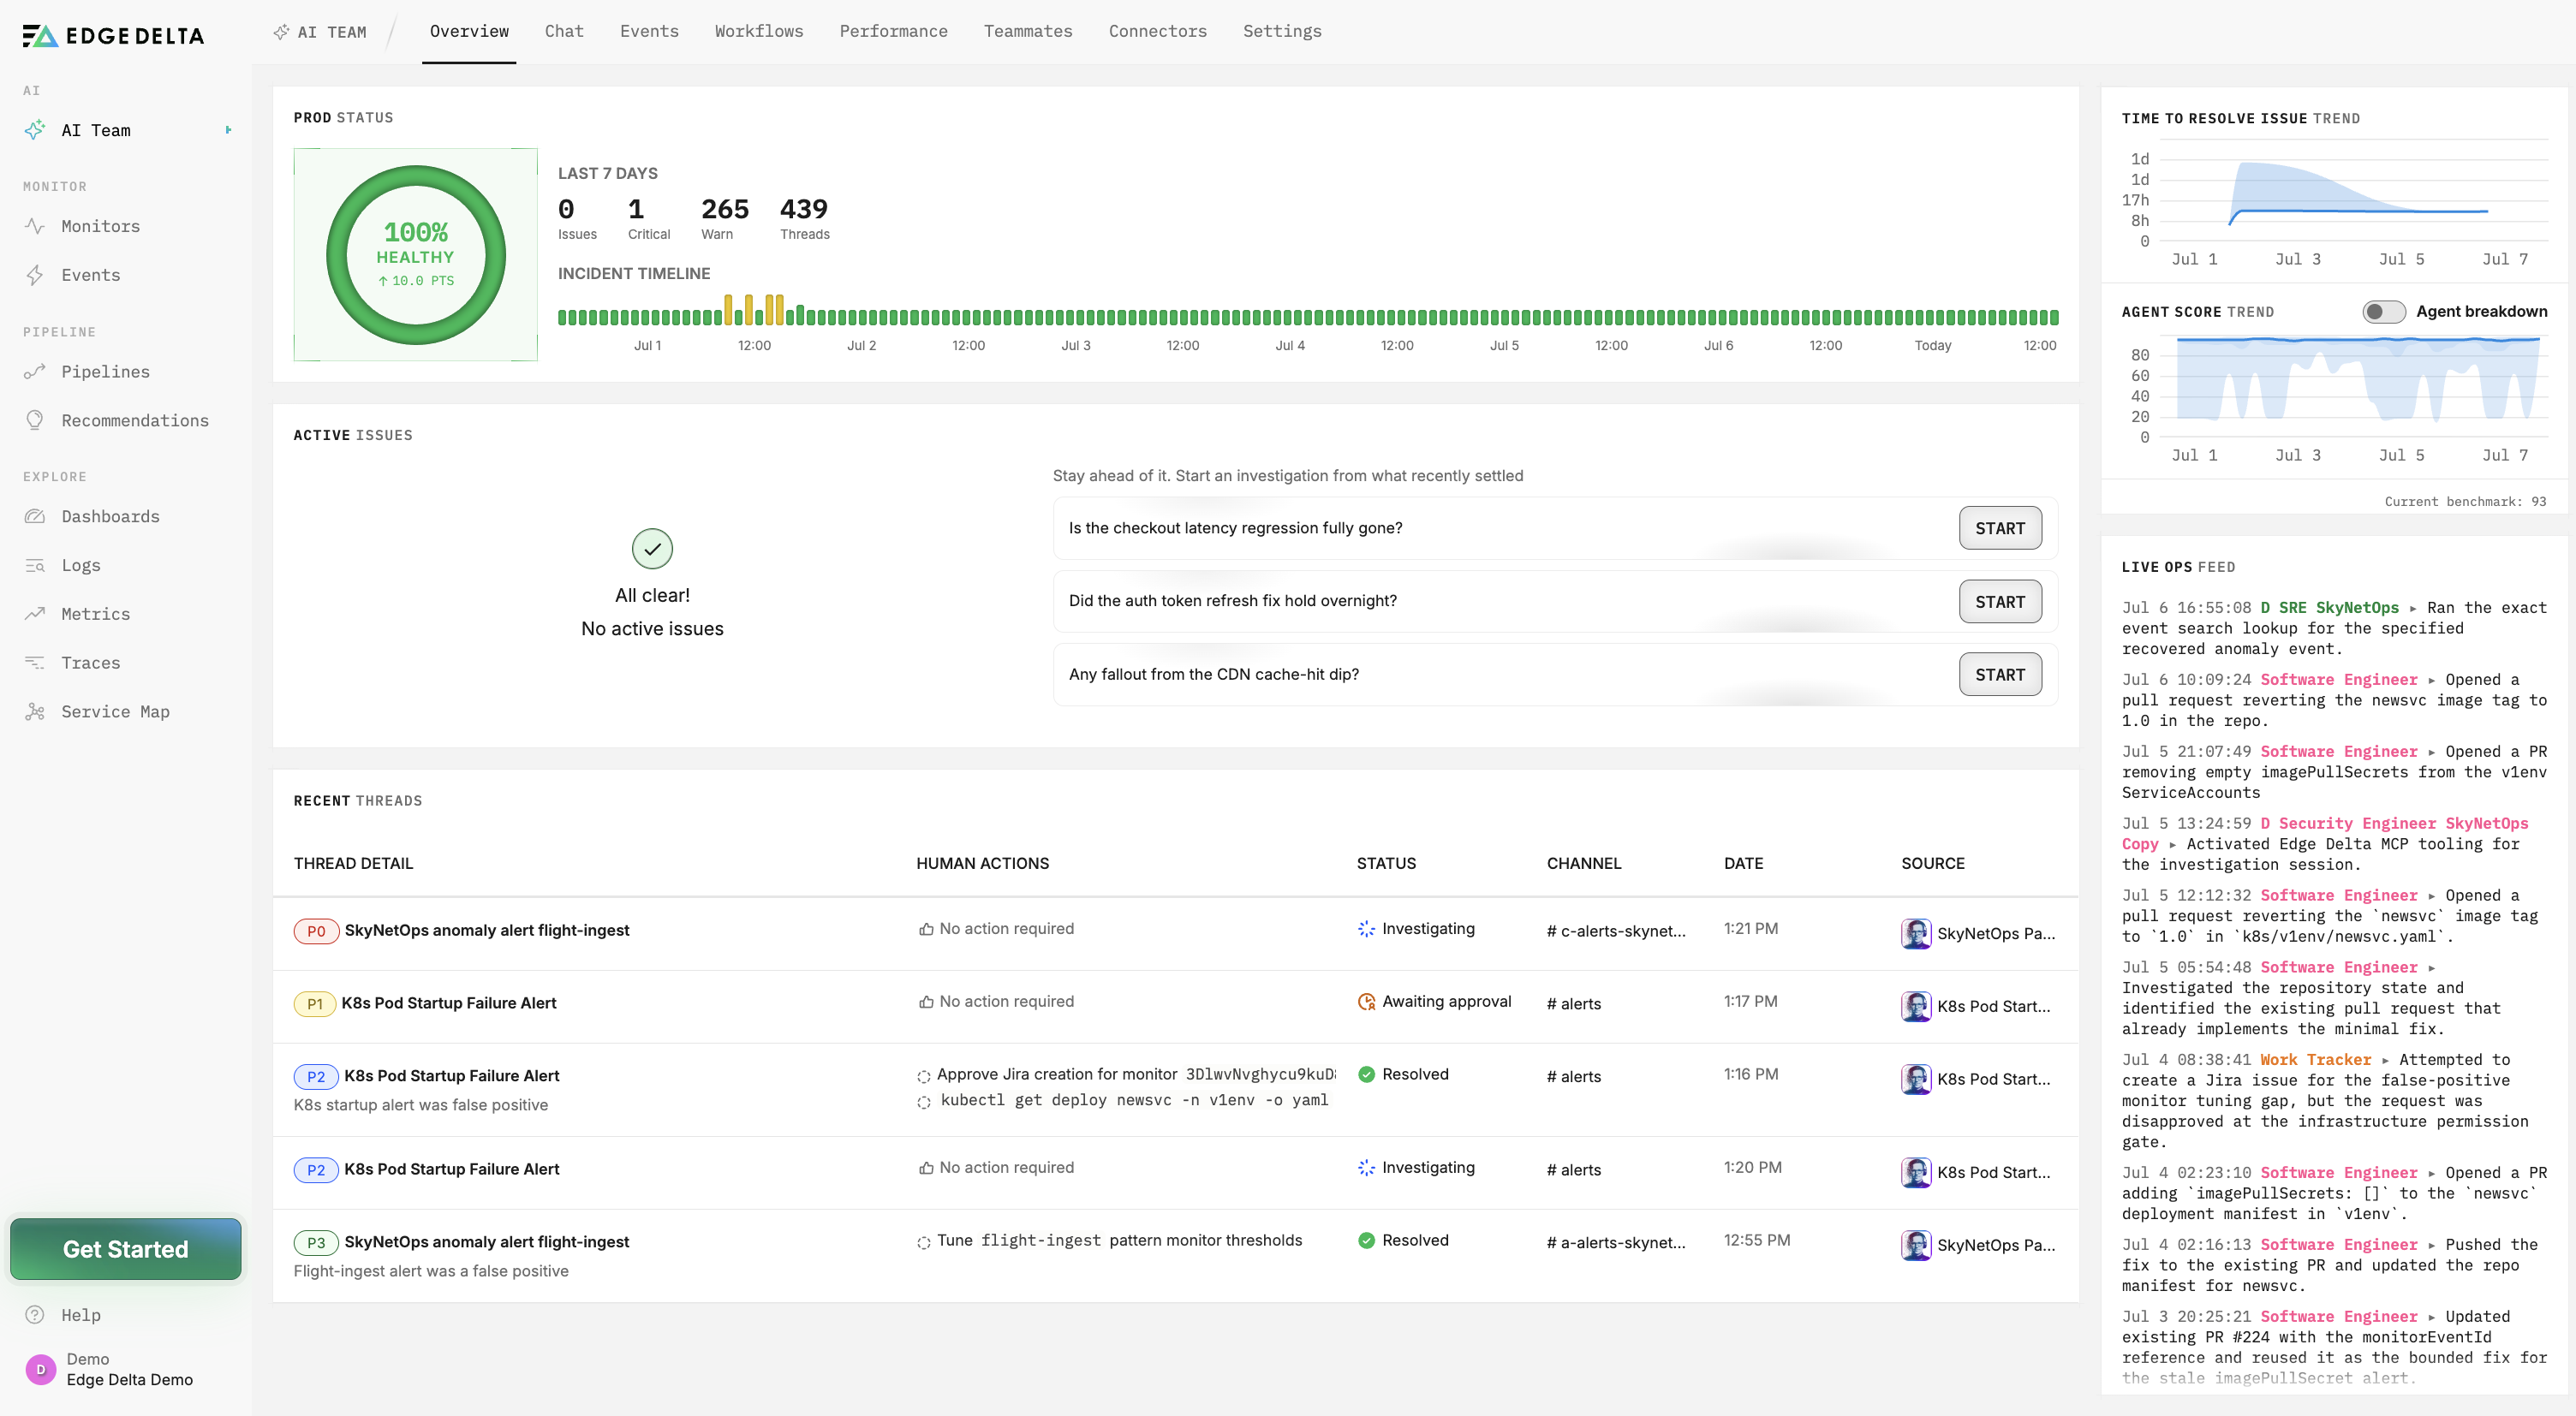
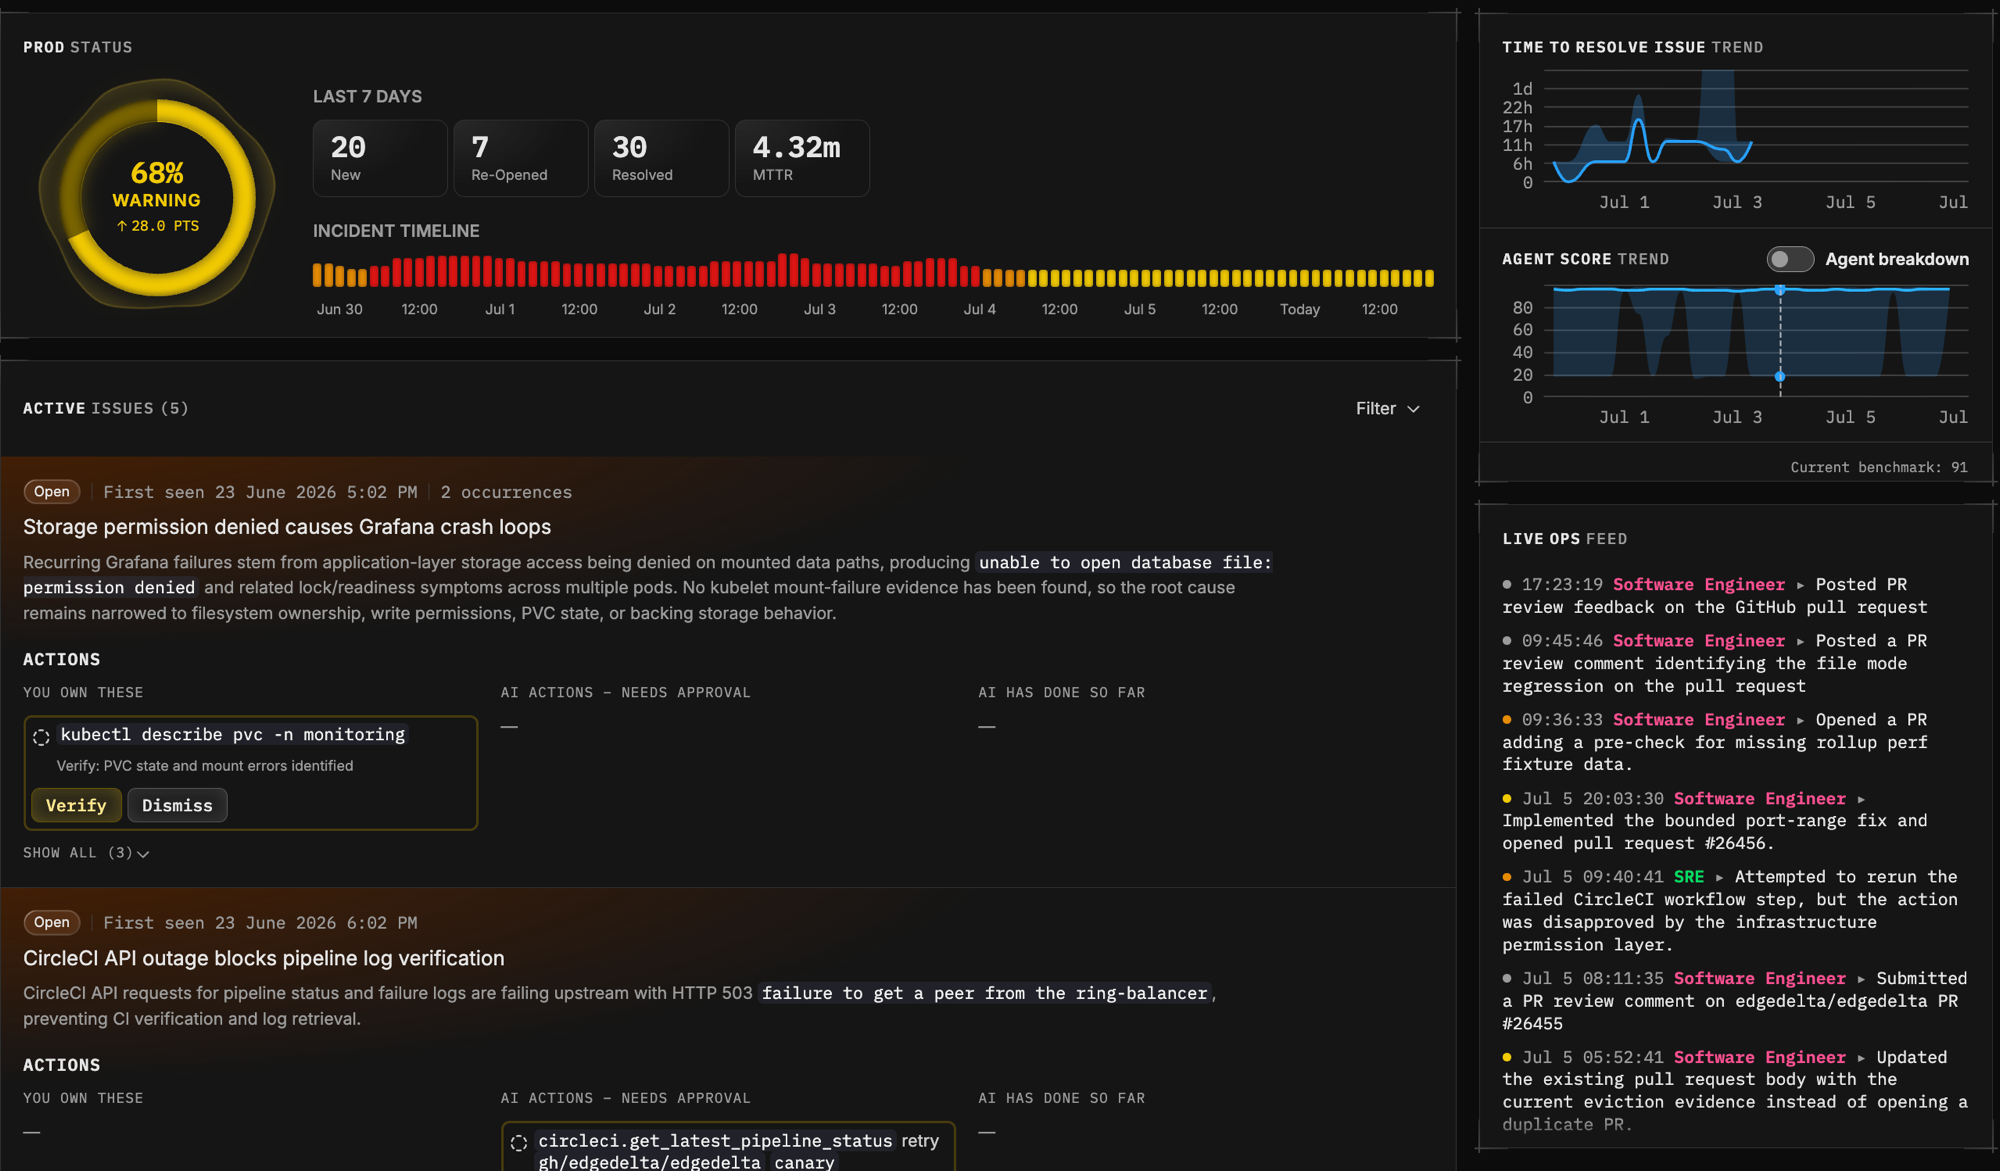
By default, the dashboard shows the last 7 days of activity. To focus on a specific period, click or drag on the incident timeline to zoom into that range. Click the reset arrow to return to the default view.
Health score
The health score is a 0 to 100 measure of your environment based on the issues that are currently open. Each open issue reduces the score according to its severity: a critical issue deducts 25 points, a high issue deducts 10 points, and a medium issue deducts 4 points. The gauge also shows how the score has changed since the start of the selected time range.
The score maps to a status:
| Score | Status |
|---|---|
| 80 to 100 | Healthy |
| 60 to 79.9 | Warning |
| 40 to 59.9 | High |
| Below 40 | Critical |

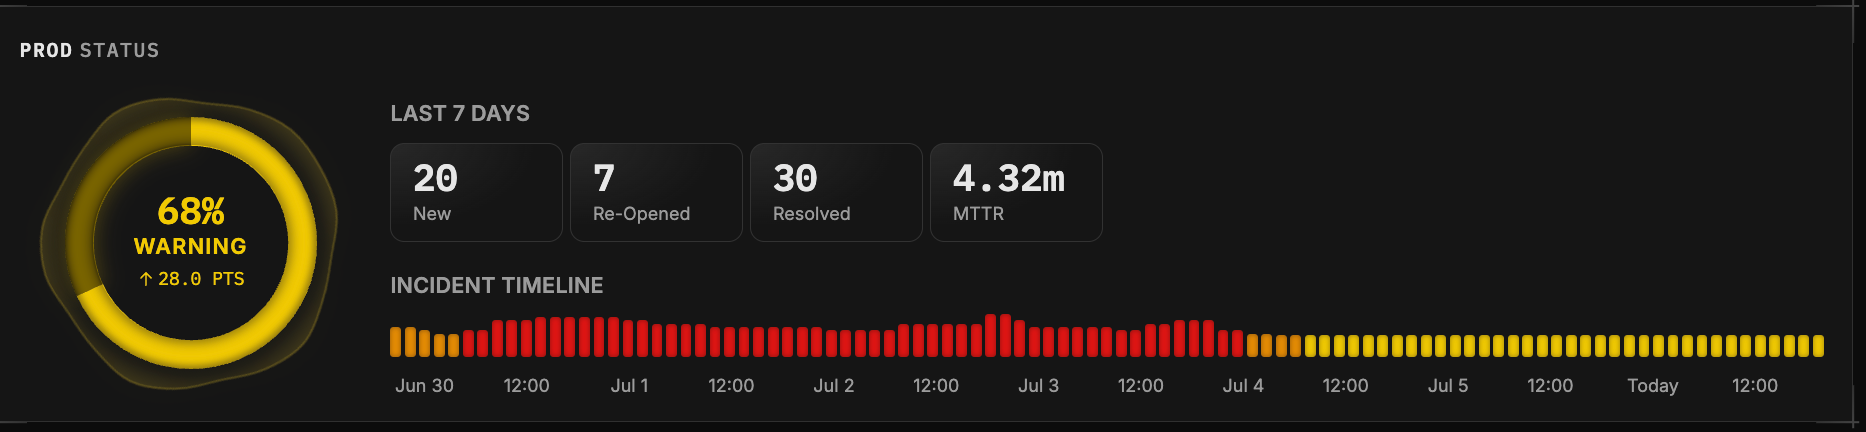
Next to the gauge, four flow statistics summarize issue activity in the selected time range:
- New: Issues opened during the period.
- Re-Opened: Issues that recurred after a previous issue was closed.
- Resolved: Issues closed during the period.
- MTTR: The median time to resolve issues in the period.
Incident timeline
The incident timeline divides the selected time range into buckets and colors each bucket by the health status during that window. Buckets also show how many issues were open at the time. Use the timeline to spot when problems started, how long they lasted, and whether health has recovered. Click a bucket or drag across a range to zoom the entire dashboard into that period.
Active issues
The Active Issues panel lists the open issues in the selected time range, ranked with the most critical first. Use the severity filter to narrow the list to Critical, High, or Medium issues; the filter shows a live count for each severity.
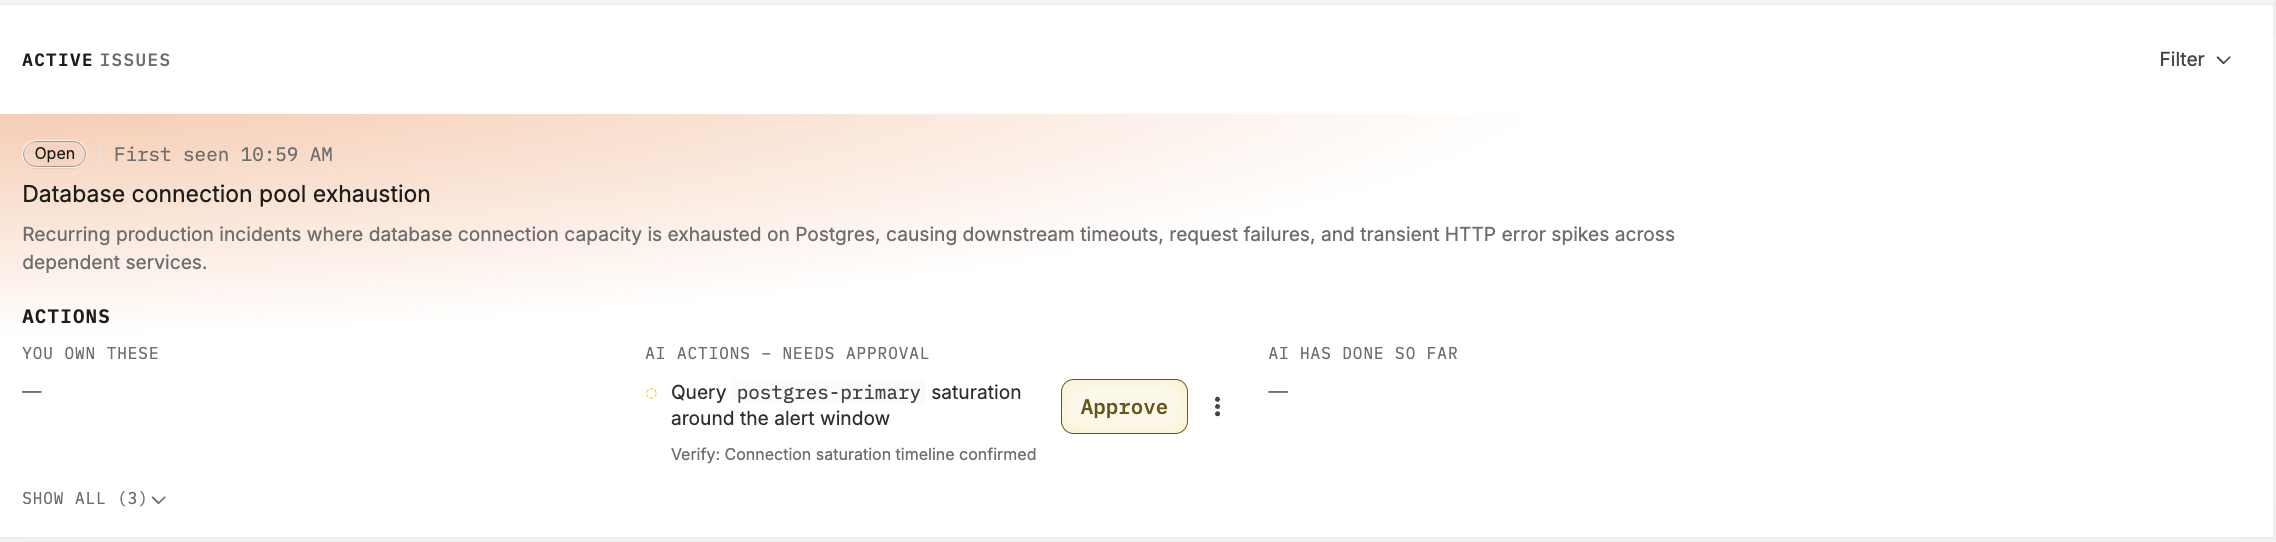
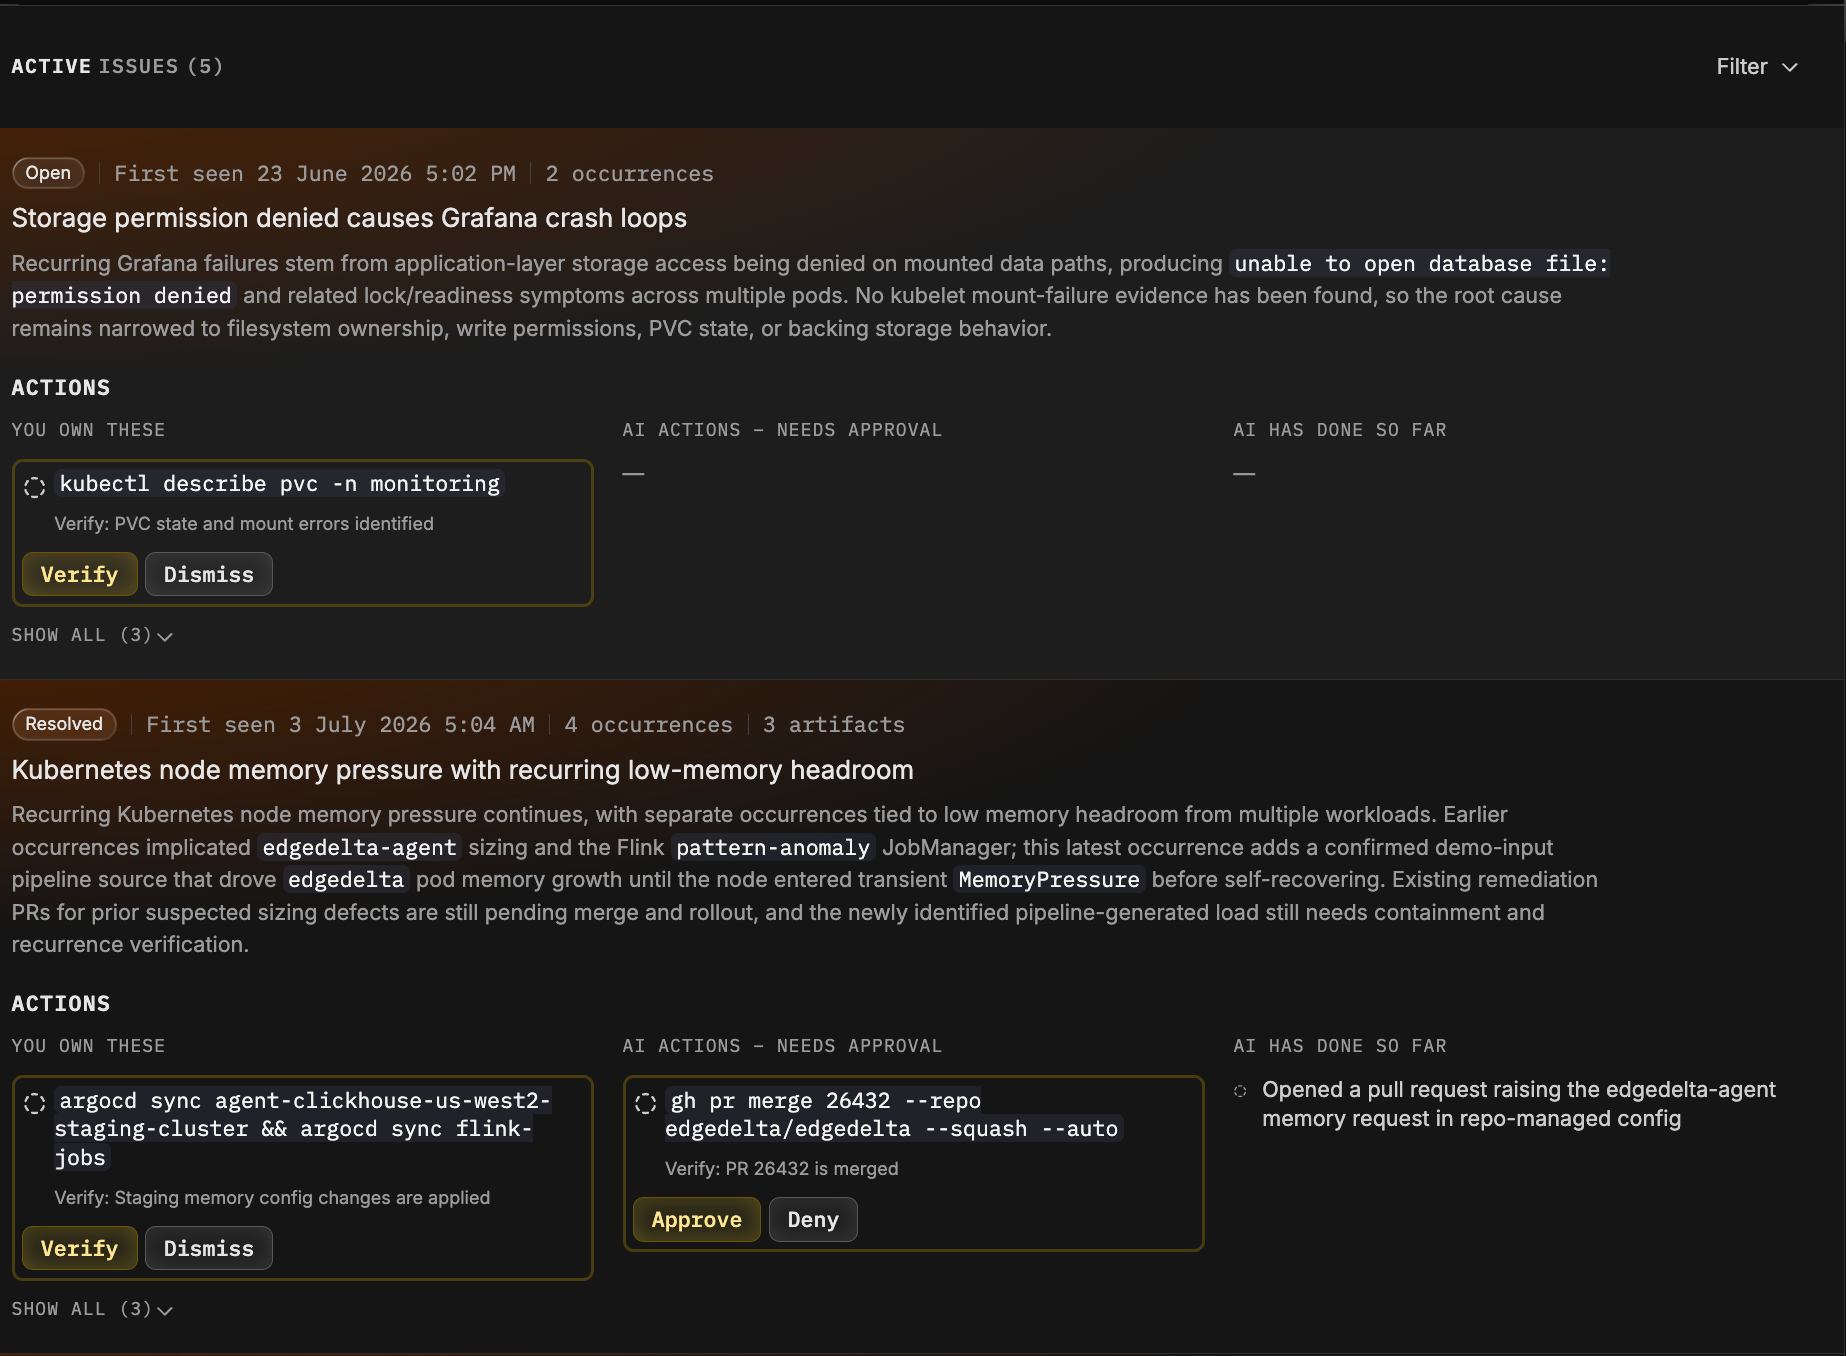
Each issue card shows the severity, when the issue was first seen, how many times it has occurred, any linked artifacts, and an AI-written title and summary of the underlying problem. Below the summary, actions are grouped into three columns:
- You own these: Recommended steps that require a human to carry out. Click Verify after completing a step so the AI Team can confirm the outcome, or Dismiss the recommendation.
- AI actions - needs approval: Actions the AI Team can execute once you approve them. Click Approve or Deny directly on the card.
- AI has done so far: Actions the AI Team has already completed.
Click Show all to expand the full list of actions, or click the card itself to open the issue details page for the full investigation context.
When there are no active issues, the panel shows an all clear state along with suggested investigation prompts based on recently settled incidents. Click a suggestion to start a conversation thread with the AI Team, for example to verify that a past regression is fully resolved.
Recent threads
The Recent Threads panel lists the most recent active investigation threads. Each row shows the thread severity, title, and summary, any human actions waiting on you, the thread status, the channel it lives in, the source that triggered it (a monitor, connector, workflow, or user), and the last activity time.
Click a thread to open it in a side panel and review the full conversation, or use View in Channel to jump to the channel itself. See Channels for more on how threads and channels work.
Trend charts
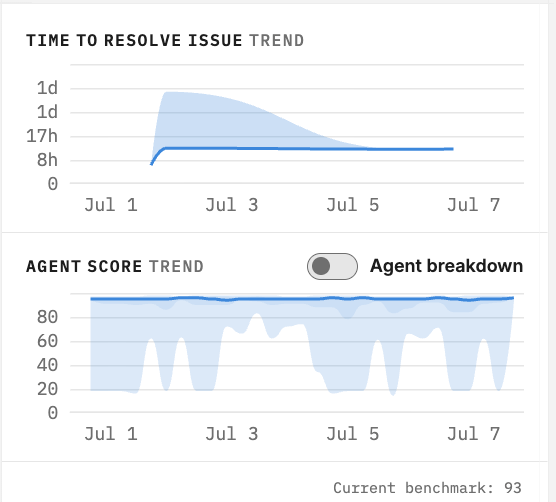
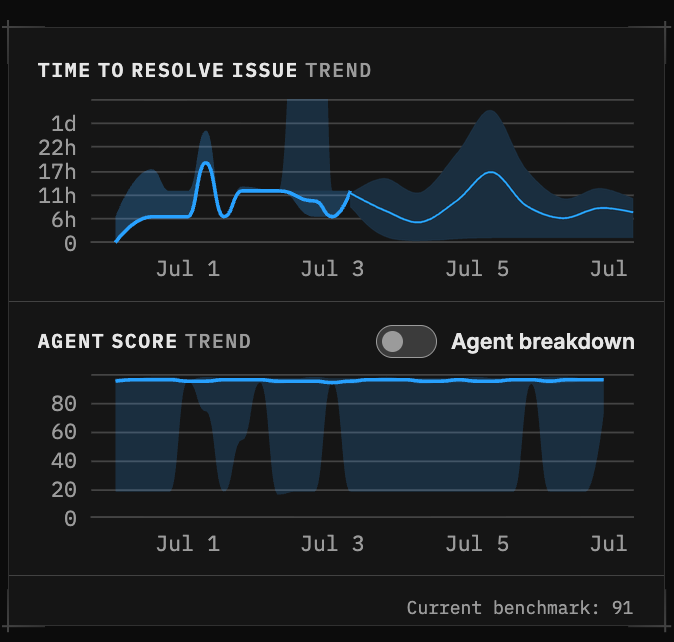
Two charts track how your operations are trending over the selected range:
- Time to Resolve: The median time it takes for issues to be resolved. For longer time ranges, the chart shows the distribution of resolution times rather than a single line.
- Agent Score: A 0 to 100 measure of AI teammate performance against a benchmark. Enable Agent breakdown to see a separate line per teammate instead of the average. See AI Team Performance for details on how teammates are scored.
Live Ops feed
The Live Ops feed streams AI Team activity in real time. Each entry shows the time, the teammate, and what it did, such as starting an investigation into a latency spike. Click an entry to open the related thread and follow the work as it happens.
Next steps
- Issues for how issues are created and how their lifecycle works.
- Issue Details and Actions for investigating an issue and approving recommended actions.