AI Team Events
5 minute read
Overview
The AI Team Events interface provides visibility into all activity that triggers AI teammate responses, whether initiated by users, monitors, scheduled tasks, or event connectors. This centralized view lets you understand how your AI Team is engaged, track thread lifecycle, and analyze patterns across channels and teammates.
Events capture the complete interaction history—when threads start, which monitors fire, what connectors deliver, and how scheduled tasks execute. By filtering, querying, and grouping these events, you can identify high-traffic channels, troubleshoot delivery issues, validate monitor behavior, and optimize how work reaches the AI Team.
Accessing AI Team Events
- Navigate to AI Team in the main navigation
- Select the Events tab
- The events table displays recent activity with timestamp and body columns
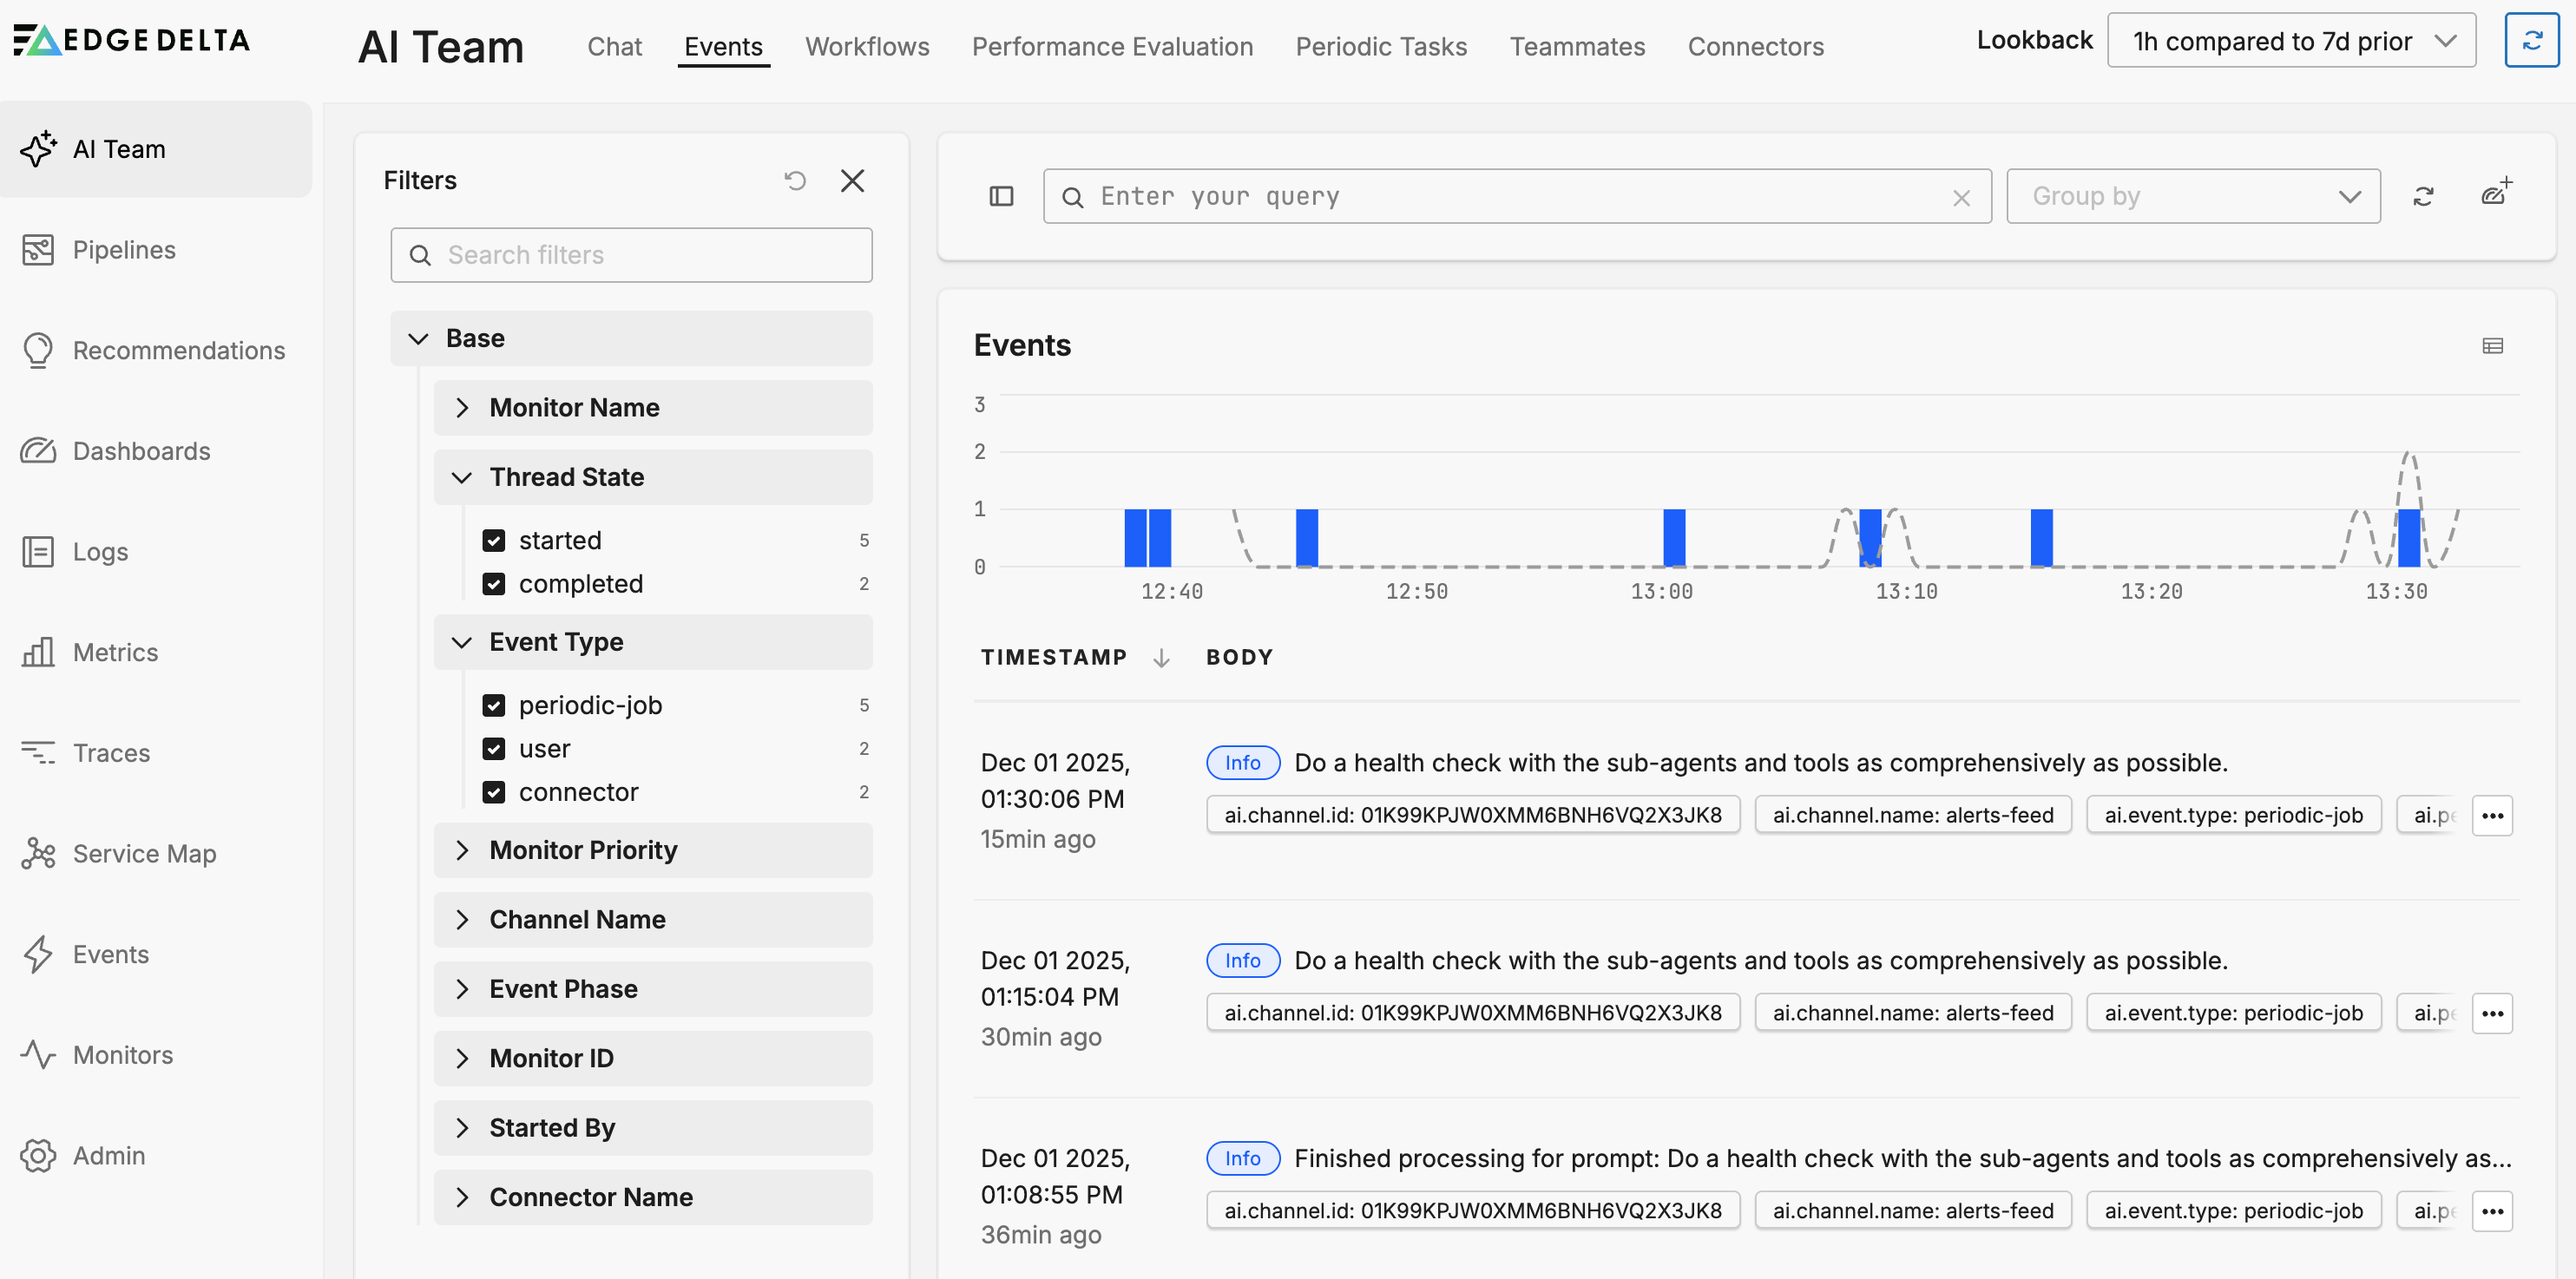
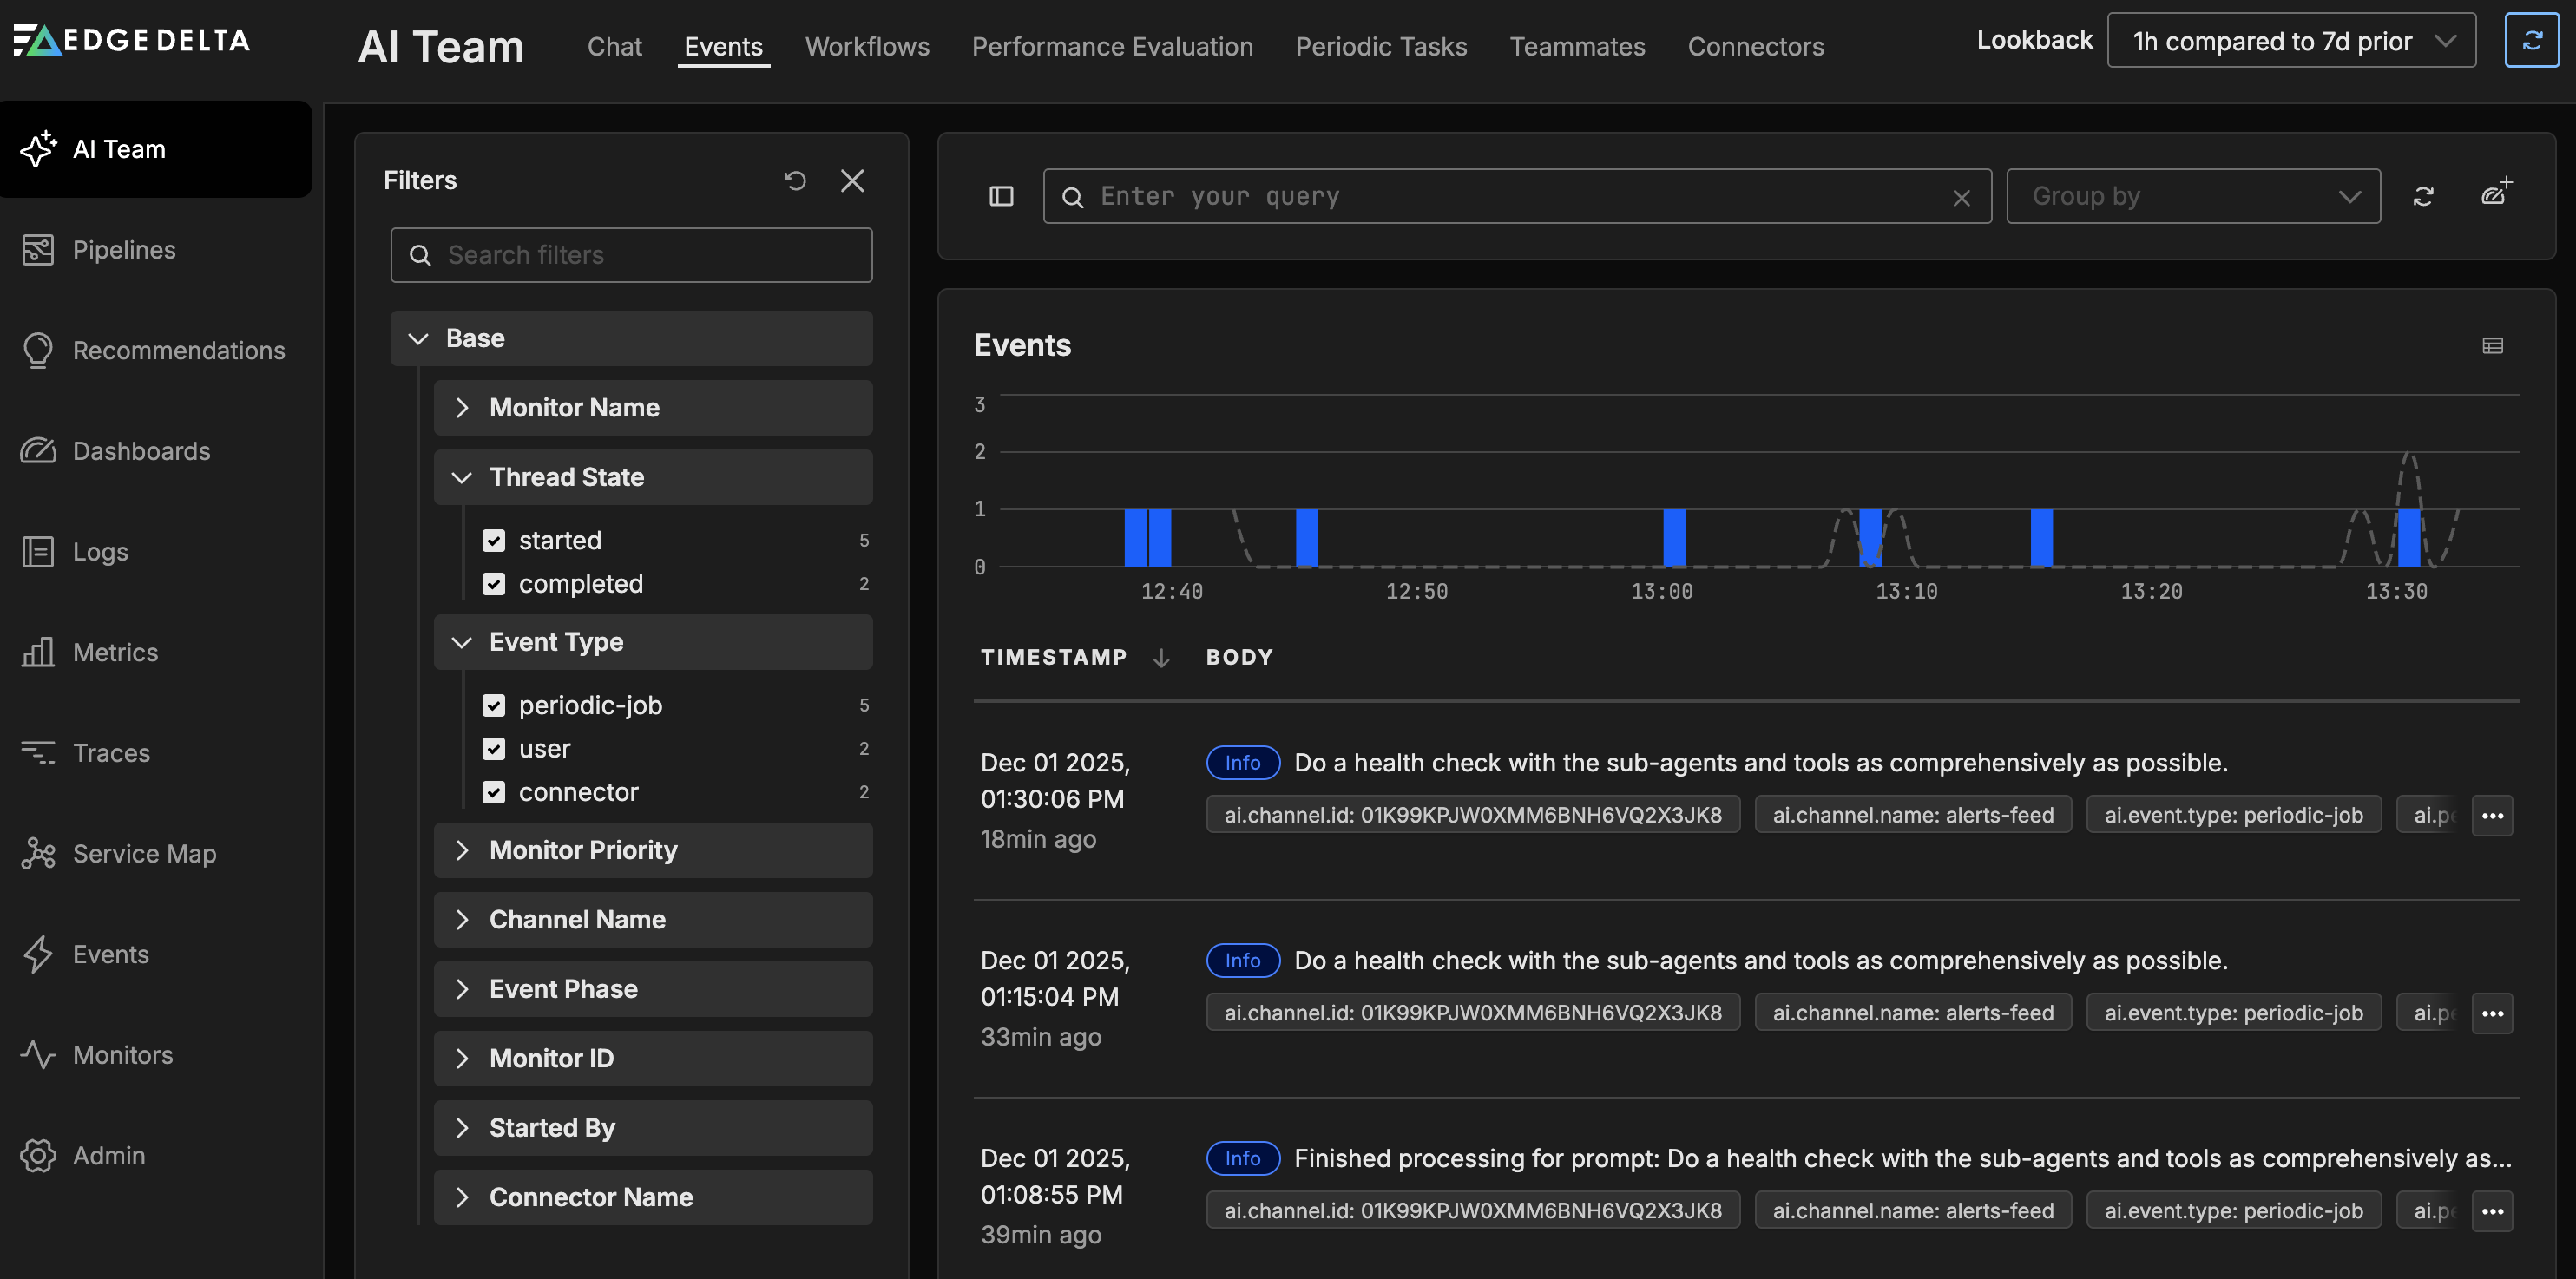
Filtering Events
The filters pane provides structured filtering across multiple dimensions. As you select filters, Edge Delta builds a query automatically in the query text box. You can also enter queries manually for advanced filtering.
Available Filters
- Monitor Name – Filter by the specific monitor that triggered the event
- Thread State – Filter by thread lifecycle state
- Event Type – Filter by the type of event (user message, monitor alert, connector event, scheduled task)
- Monitor Priority – Filter by monitor severity or priority level
- Channel Name – Filter by the channel where the event occurred
- Event Phase – Filter by event processing phase
- Monitor ID – Filter by unique monitor identifier
- Started By – Filter by the user or system that initiated the thread
- Connector Name – Filter by the event connector that delivered the event
Query Syntax
As you select filters, queries are built using the @ syntax:
@ai.thread.state:"started"
You can combine multiple filters:
@ai.thread.state:"started" @channel.name:"alerts"
Enter queries manually in the query text box for advanced filtering and boolean logic.
Time Range and Comparison
Lookback Window
Use the lookback dropdown to set the time range for events:
- Last 15 minutes
- Last hour
- Last 4 hours
- Last day
- Last 7 days
- Last 30 days
- Custom range
Comparison Series
Enable comparison mode to analyze current activity against historical patterns. For example, compare the last hour to the last 7 days to identify unusual activity spikes or drops in thread creation.
The comparison series overlays metrics from two time periods, making it easier to spot anomalies, validate monitor tuning, or understand how connector volume changes over time.
Grouping Results
Group events by facets to aggregate and analyze patterns:
Built-in Facets
- Monitor Name – See which monitors generate the most activity
- Thread State – Understand thread lifecycle distribution
- Event Type – Identify the mix of user, monitor, connector, and scheduled task events
- Monitor Priority – Analyze alert severity distribution
- Channel Name – Identify high-traffic channels
- Event Phase – Track event processing stages
- Connector Name – See which connectors deliver the most events
Common Facets
- ed.tag – Group by pipeline ID to correlate events with specific telemetry sources
- Event Name – Group by specific event types
- Host Name – Identify events by originating host
Grouping transforms the flat event list into aggregated counts, helping you quickly identify trends and outliers.
Events Table
The events table displays individual events with two primary columns:
- Timestamp – When the event occurred
- Body – Event content and context
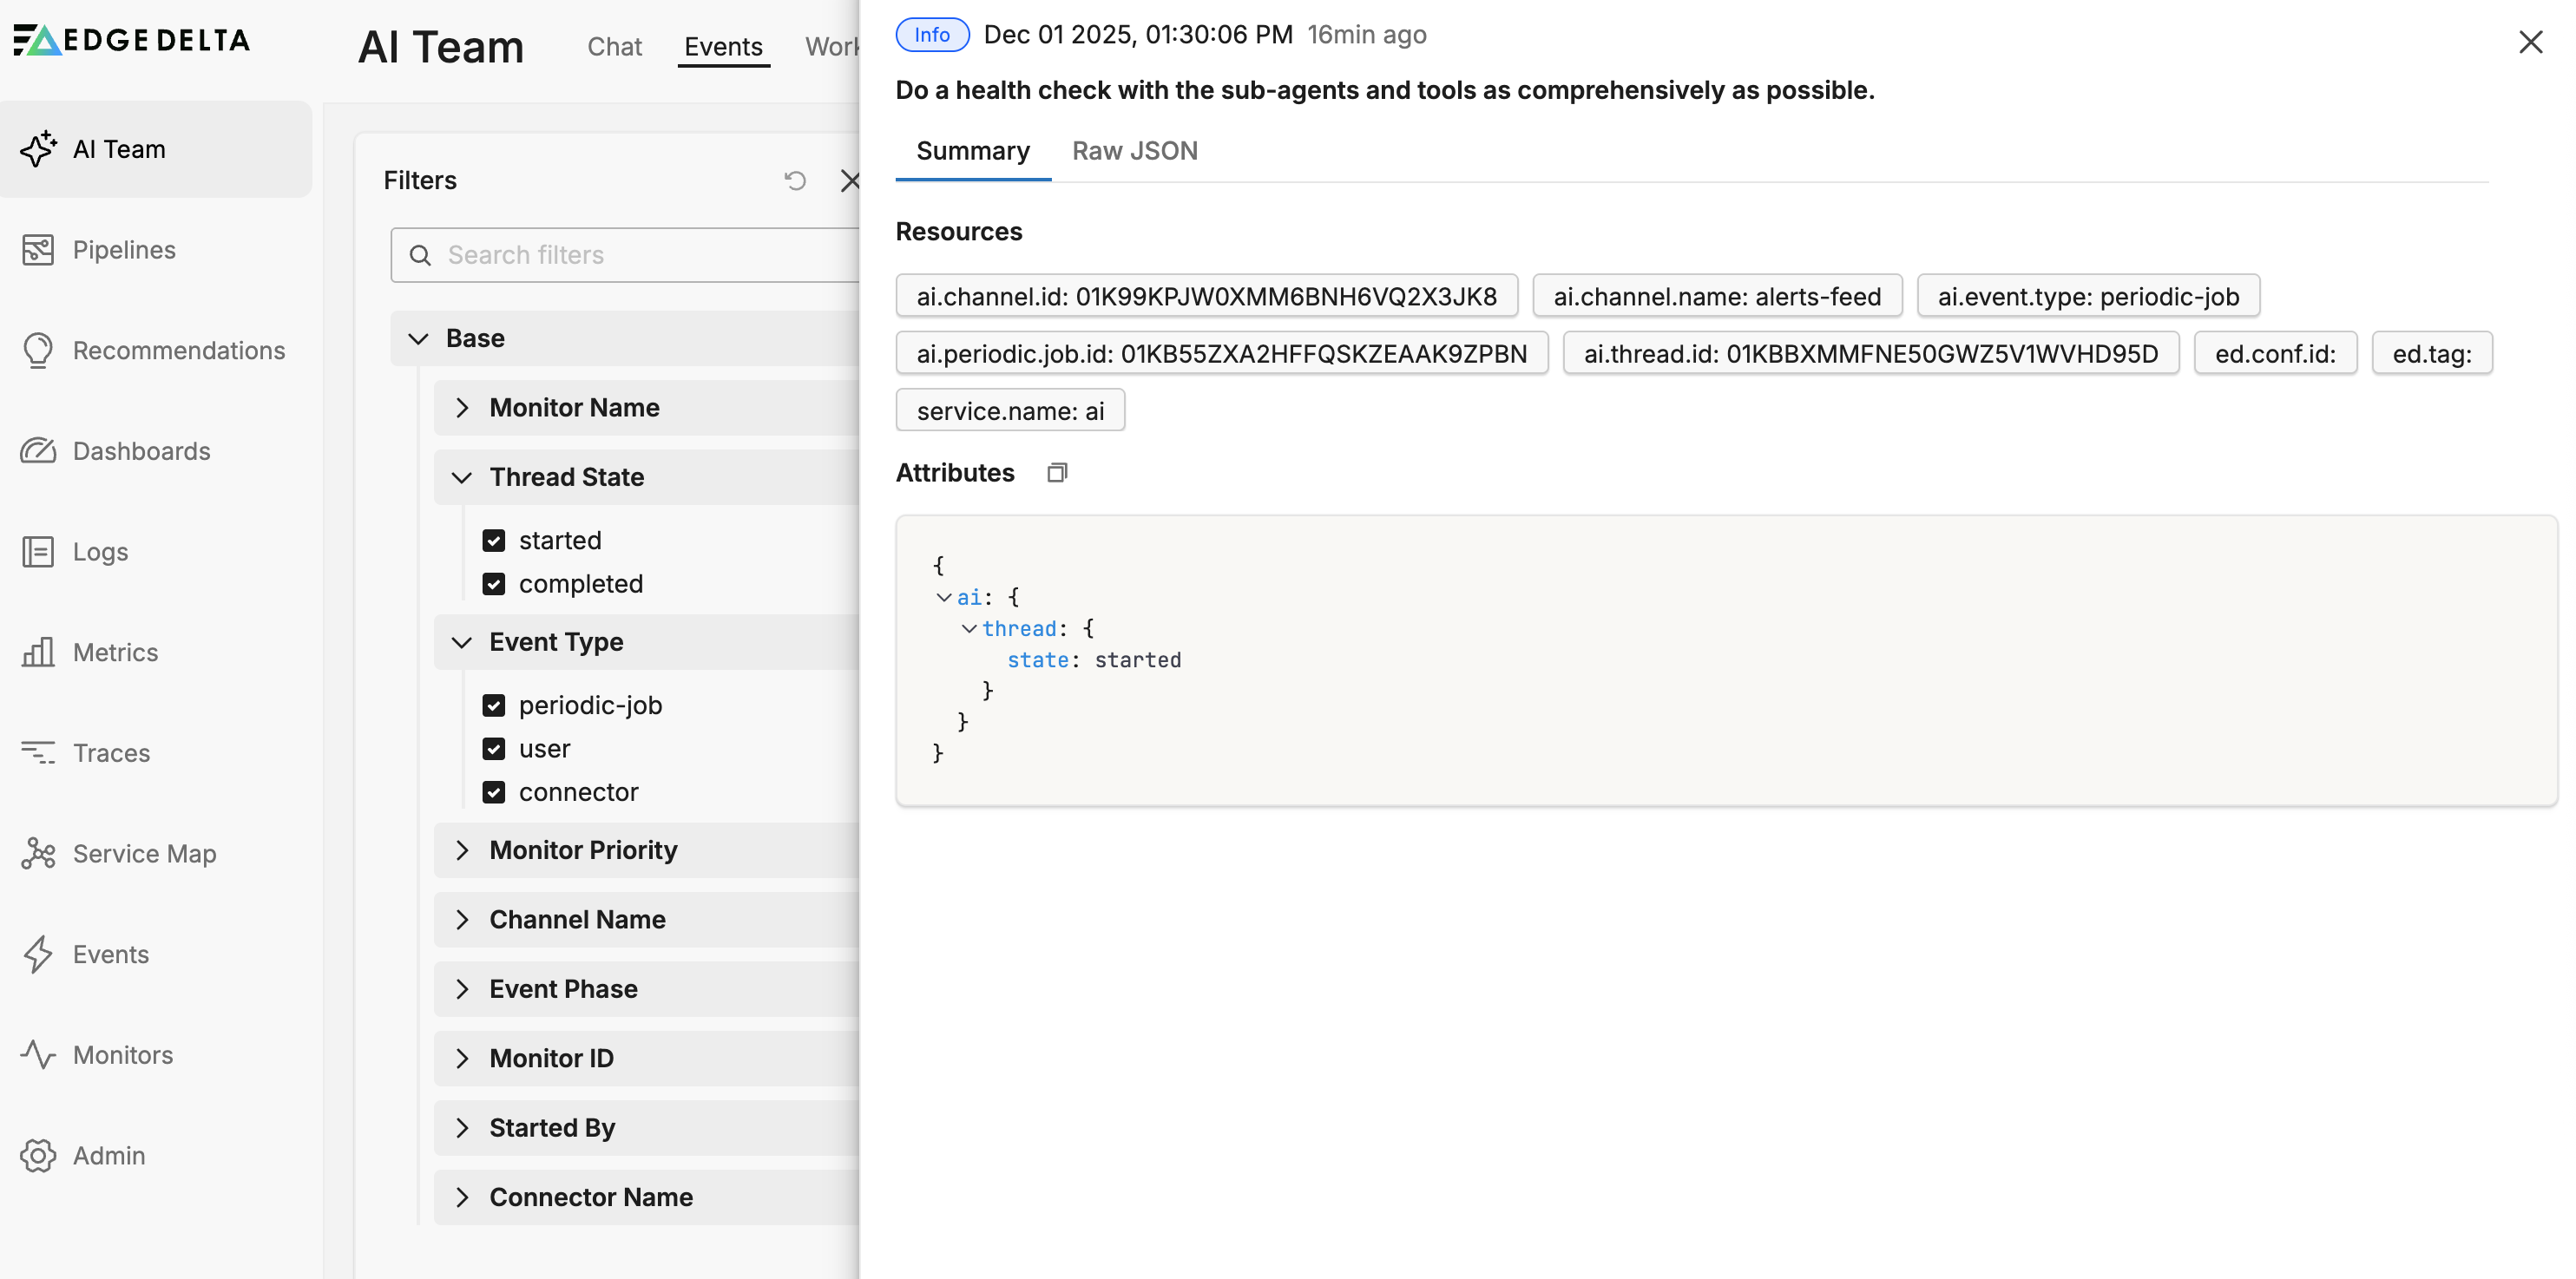
Event Details
Click any event to view its complete details:
- Timestamp – Precise event time
- Level – Event severity or importance
- Body – Full event content
- Resource – Associated resources (channel, monitor, connector)
- Attributes – Additional event metadata
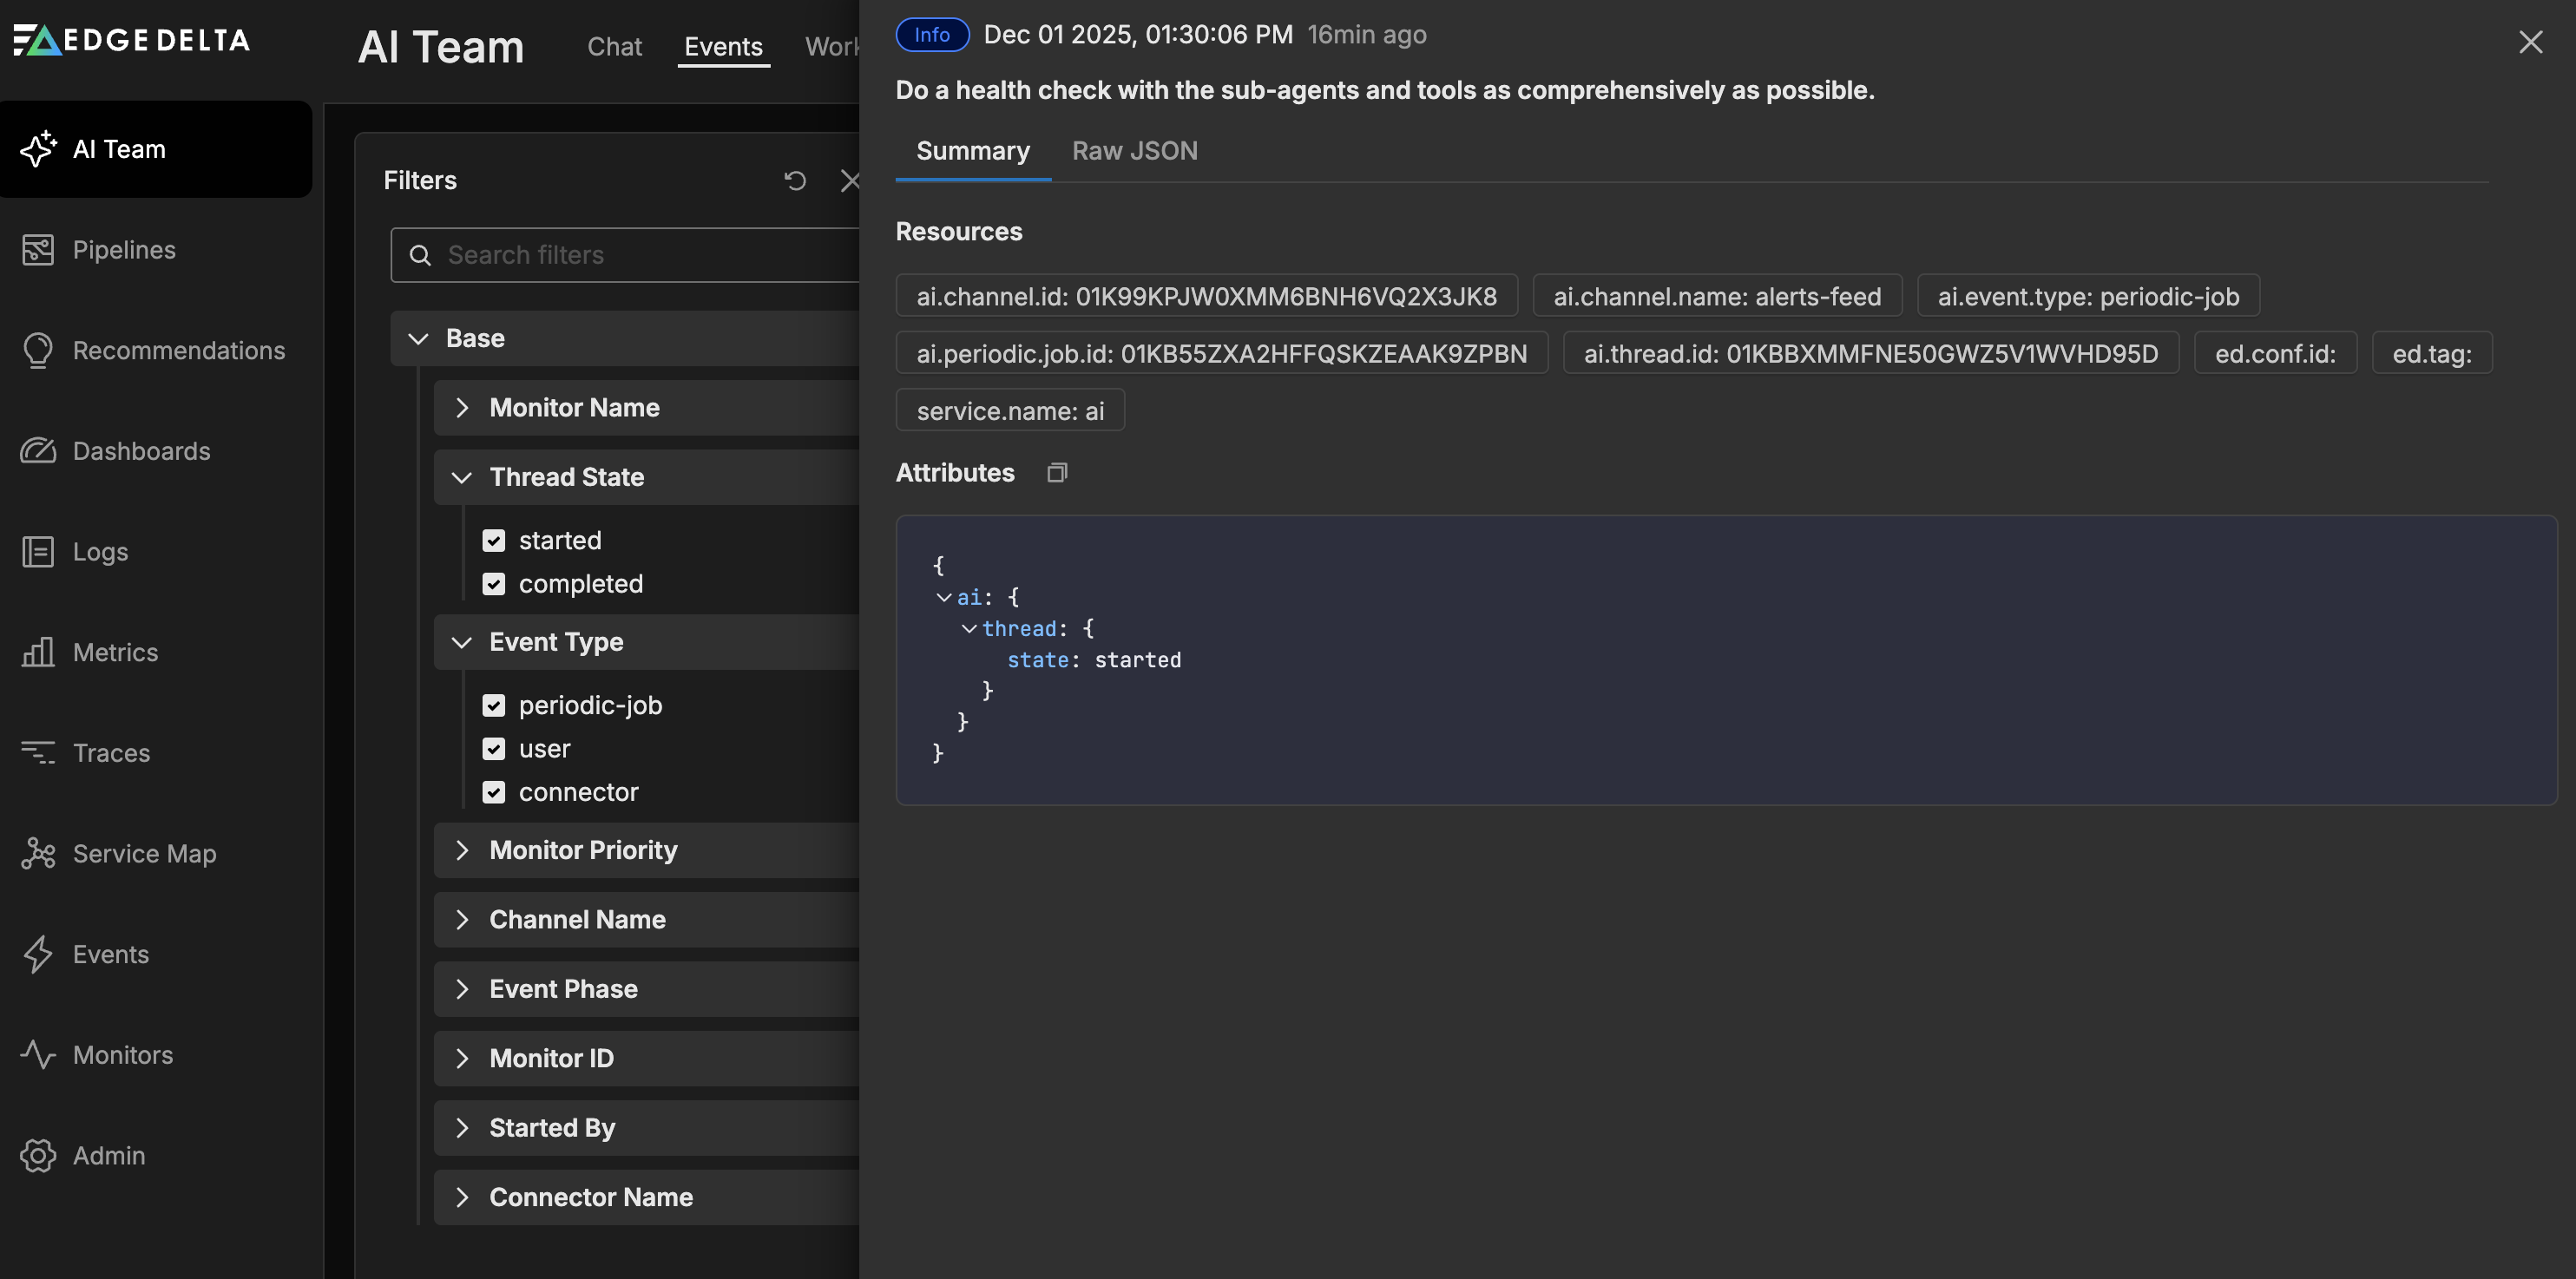
Working with Event Dimensions
When viewing event details, you can interact with any resource or attribute value:
- Add to search query – Include this dimension in the current filter
- Exclude from search query – Remove events matching this dimension
- Replace search query – Start a new query with only this dimension
- Create facet – Add this dimension to the grouping options
- Copy value – Copy the value to the clipboard
These actions let you quickly pivot your analysis without manually constructing queries.
Add to Dashboard
Create persistent visibility into AI Team activity by adding the current query to a dashboard:
- Configure the filters and query to show the events you want to track
- Click Add to Dashboard
- Select the target dashboard or create a new one
- The widget will display events matching your query with automatic updates
This workflow lets you build operational dashboards that track monitor effectiveness, channel activity, connector health, and overall AI Team engagement.
Common Use Cases
Monitor Tuning
Filter by monitor name and group by thread state to understand which monitors produce actionable threads versus noise. Adjust monitor thresholds or filters to reduce false positives.
Channel Health
Group by channel name to identify overloaded channels that might need to be split, or underutilized channels that could be consolidated. Compare activity patterns across time periods to spot trends.
Connector Validation
Filter by connector name after configuring a new event connector to verify events are arriving as expected. Check the event body to confirm payloads contain the expected fields.
Scheduled Task Verification
Filter by event type for scheduled tasks to confirm they execute on schedule and produce expected outputs. Group by task name to compare execution frequency.
Incident Analysis
When investigating a specific incident, filter by timestamp and channel to reconstruct the sequence of events that triggered AI Team involvement. Review which monitors fired, what connectors delivered context, and how teammates responded.
Best Practices
- Start broad, filter narrow – Begin with a wide time range and no filters to understand overall activity, then progressively narrow the query.
- Use grouping for pattern discovery – Aggregating by facets surfaces trends that individual events might hide.
- Save queries as dashboards – Capture useful queries as dashboard widgets so teams can monitor AI Team health without rebuilding filters.
- Validate new configurations – After adding monitors, connectors, or scheduled tasks, filter by those resources to confirm they integrate correctly.
- Compare time periods – Use the comparison series when activity looks unusual to confirm whether it represents a true anomaly or expected variation.
Next Steps
- Configure monitors to trigger AI Team investigations based on telemetry patterns
- Build workflows to automate scheduled reports, health checks, and incident response
- Configure event connectors to stream external events into AI Team channels
- Create dashboards to track AI Team activity and effectiveness over time