AI Team Performance
5 minute read
Overview
The Performance tab provides visibility into how your AI teammates operate over time. You can track aggregate scores, response times, user ratings, total interactions, and token consumption across your entire team or drill down to individual teammates. Use these insights to identify high-performing teammates, detect regressions, and optimize resource allocation.
The page includes a lookback widget that defines the data range for all metrics displayed. All comparisons reference the previous window of the same duration to highlight changes in performance.
Indicator Scores
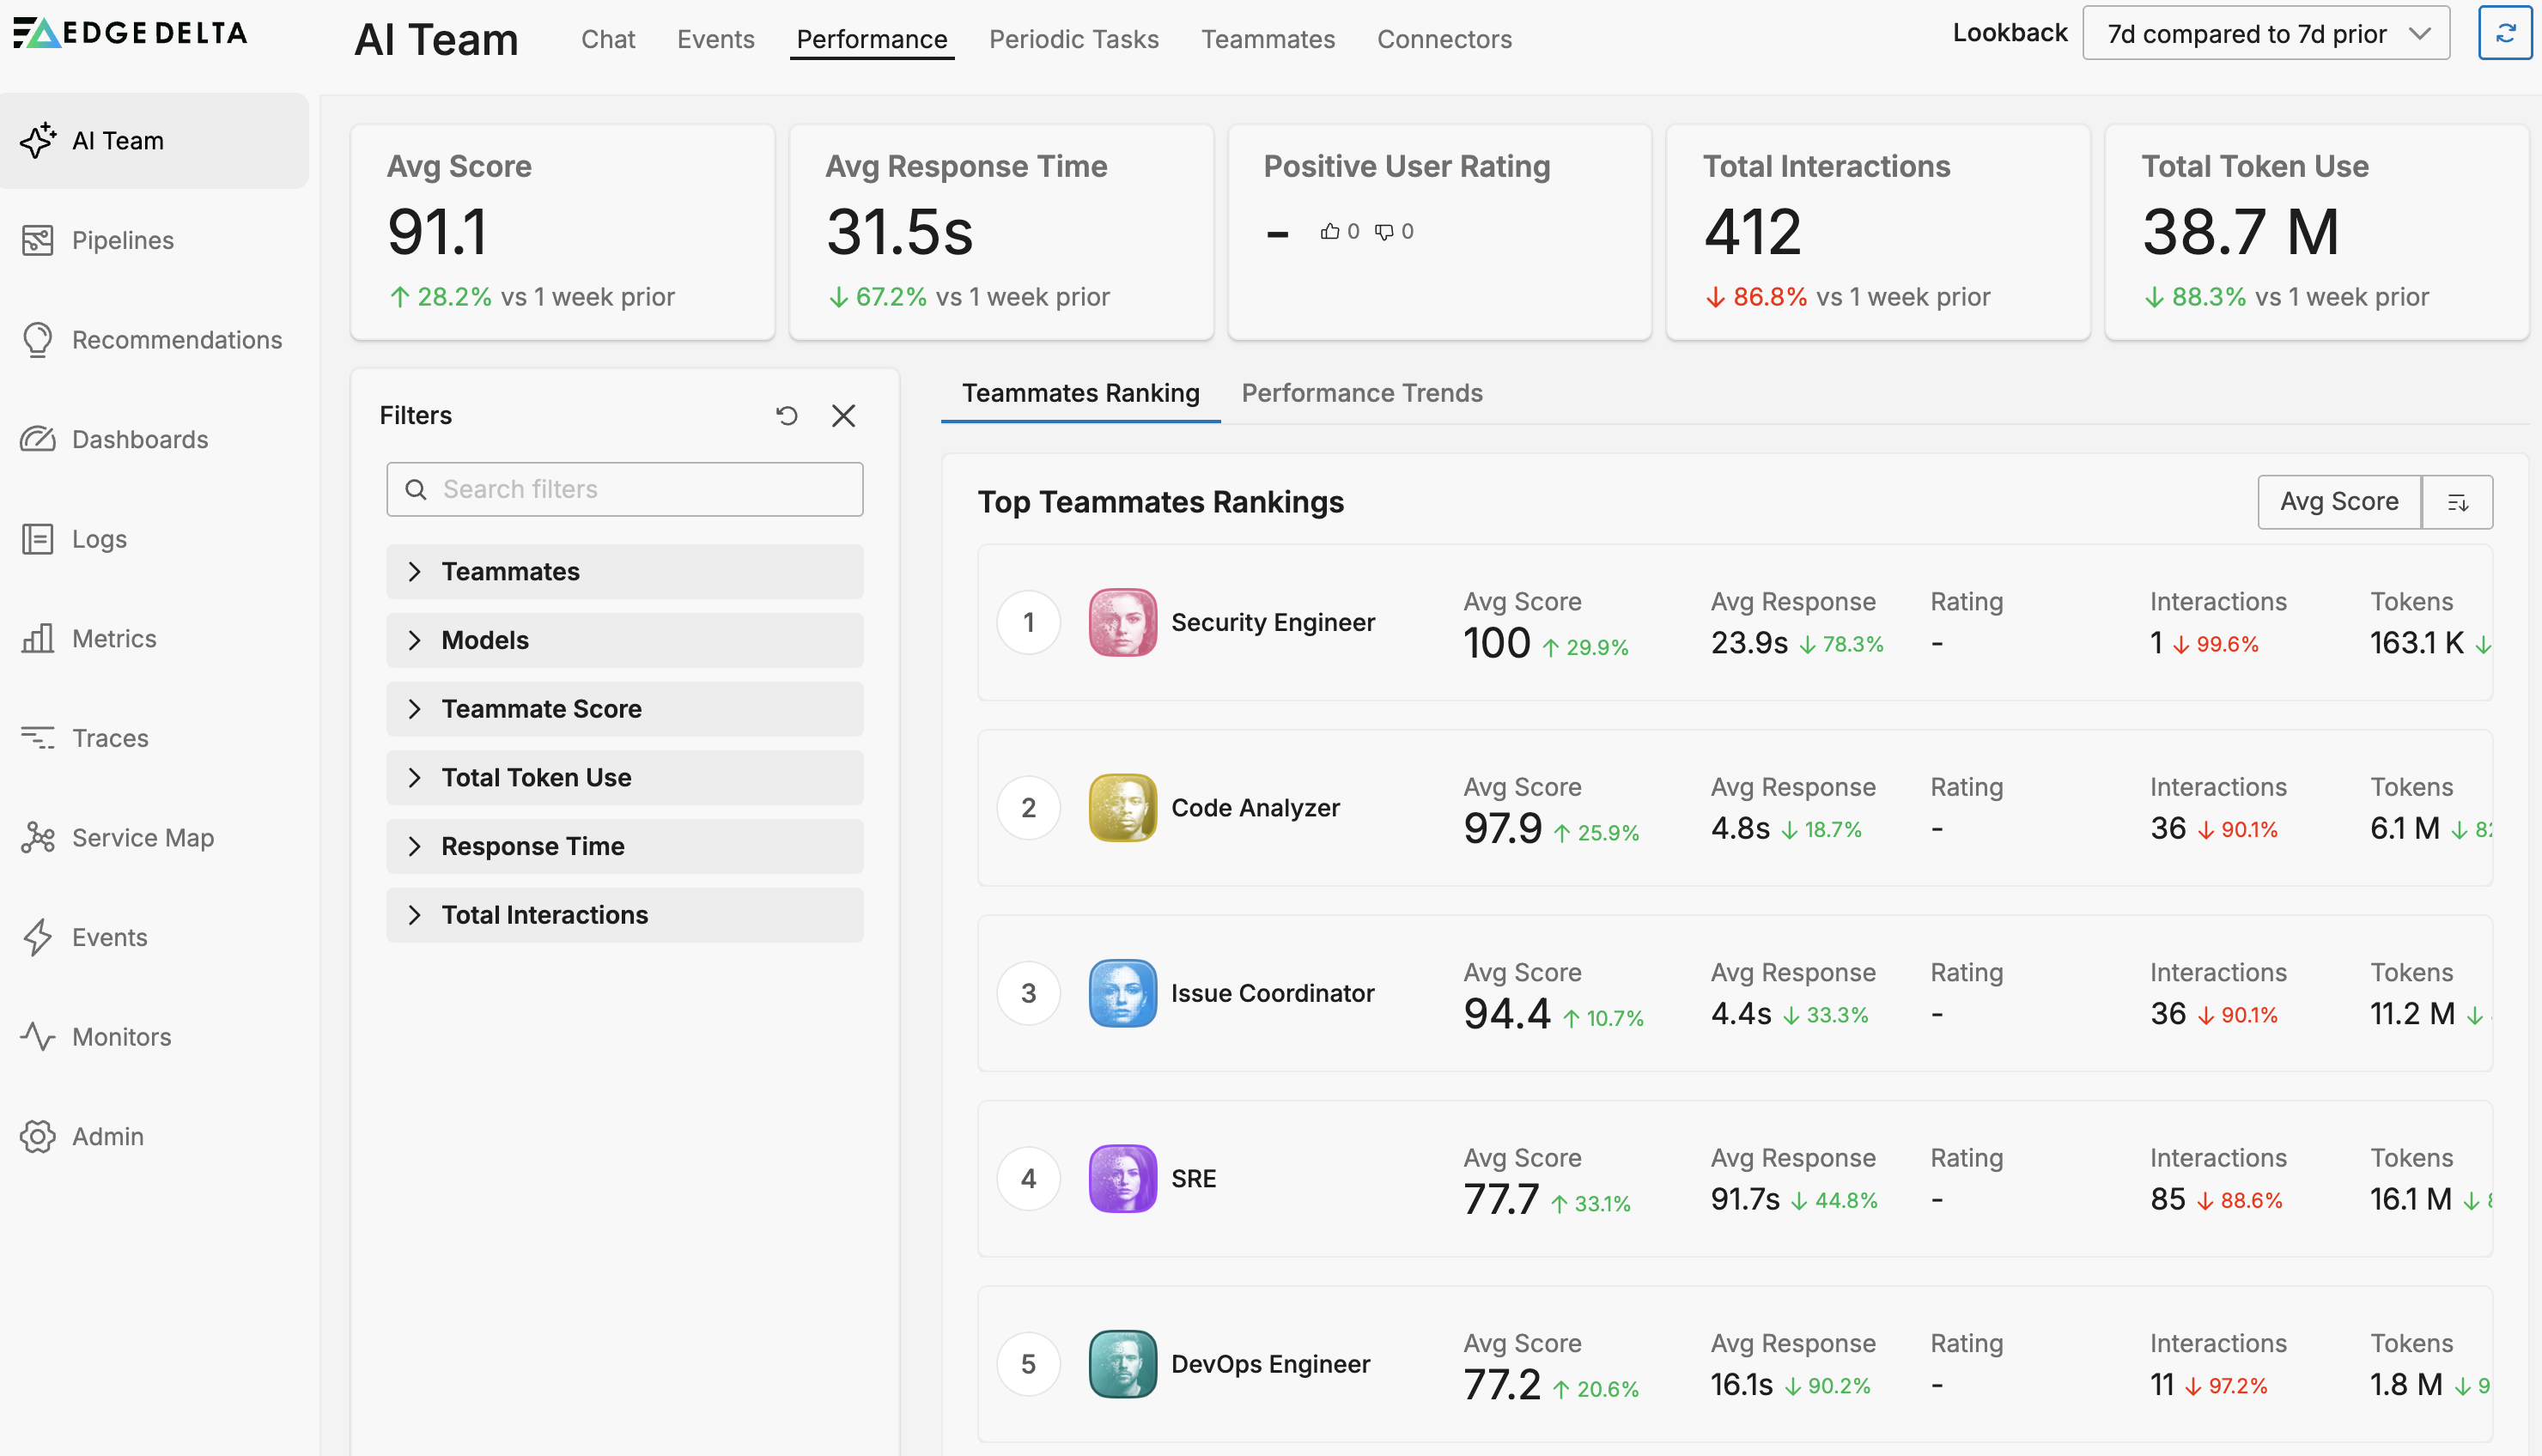
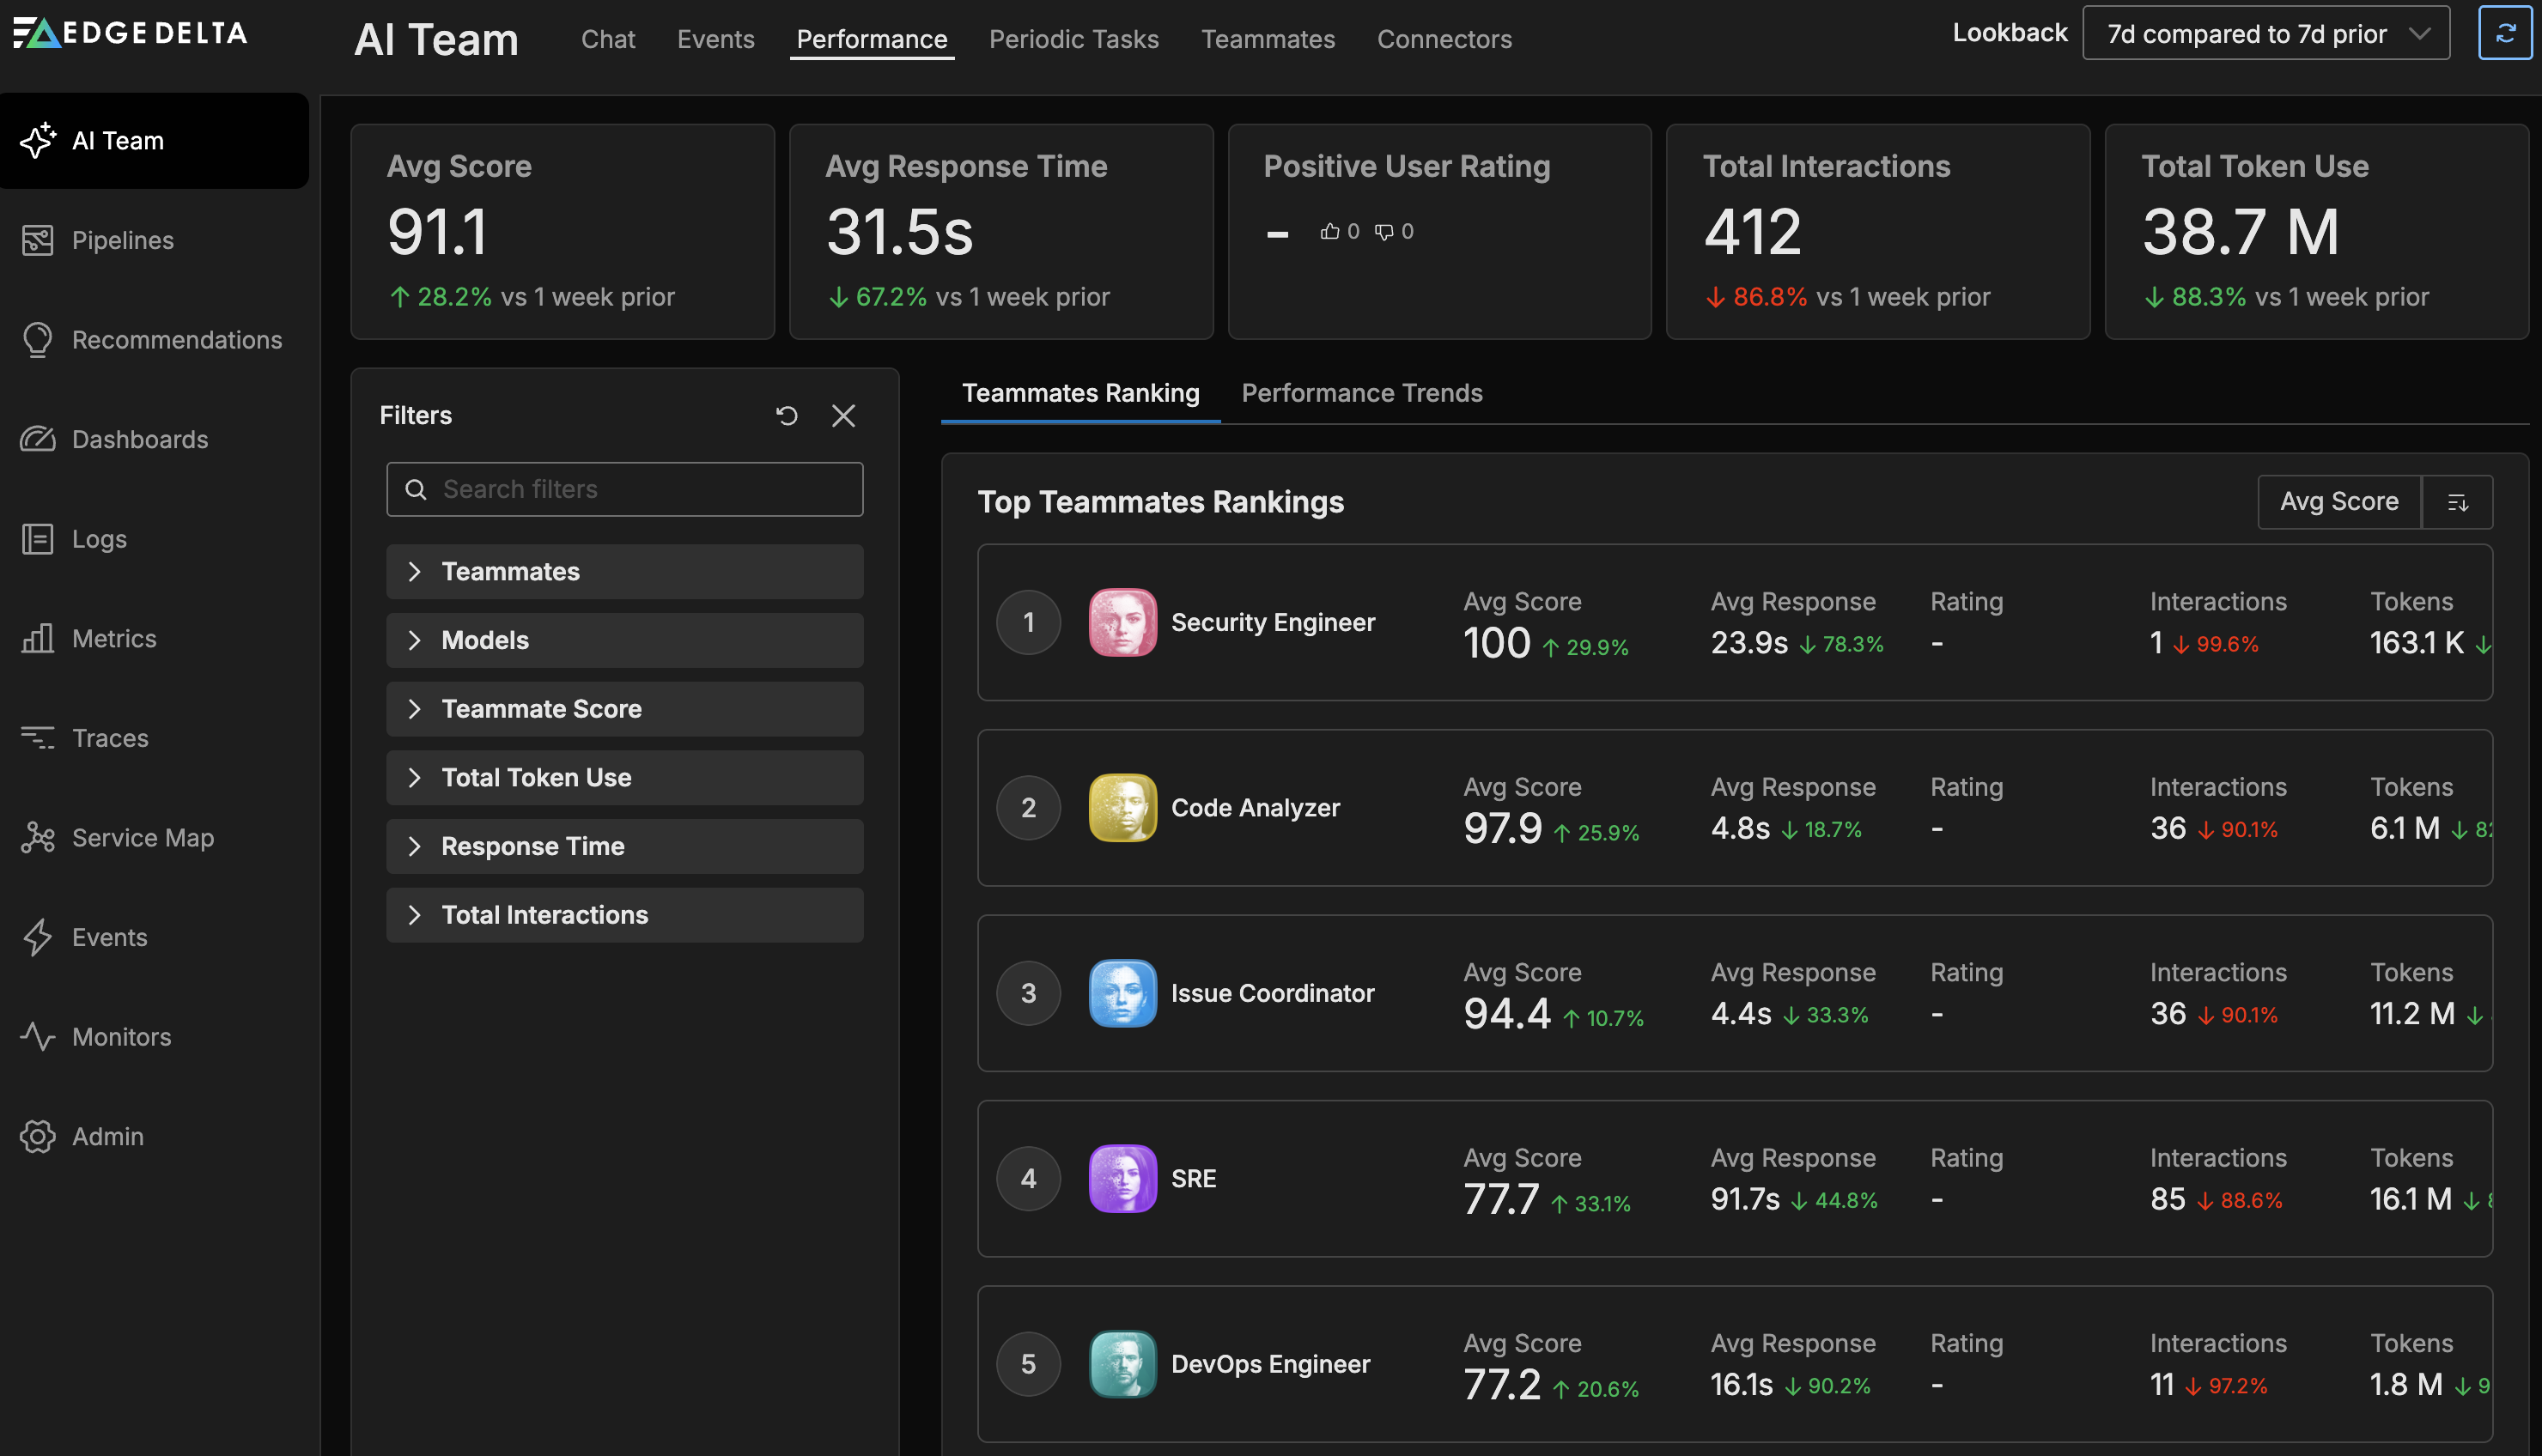
Five indicator cards summarize team-wide performance for the selected time range.
The indicators show these metrics:
- Avg Score - The average performance score across all teammates, with a comparison to the previous window showing improvement or decline.
- Avg Response Time - The mean time teammates take to respond to requests, compared against the prior period.
- Positive User Rating - The percentage of interactions that received positive feedback from users.
- Total Interactions - The count of all interactions handled by teammates during the selected window.
- Total Token Use - The aggregate token consumption across all teammates, with comparison to the previous period to track usage trends.
These aggregate metrics reflect all teammate activity regardless of any filters applied to the agents table.
Agents Table
The agents table provides detailed performance data for individual teammates. The table supports two views accessible through tabs: Teammates Ranking and Performance Trends.
Filters
A filters pane lets you narrow the agents table to specific subsets of teammates. These filters do not affect the aggregate indicator scores.
The available filters are:
- Teammates - Select specific teammates using checkboxes to include or exclude them from the table.
- Models - Filter by the foundation models that power your teammates.
- Teammate Score - Set minimum and maximum score thresholds to show only teammates within a performance range.
- Total Token Usage - Define minimum and maximum token consumption bounds.
- Response Time - Filter by response time range to identify fast or slow responders.
- Total Interactions - Set interaction count thresholds to focus on high-volume or low-activity teammates.
Teammates Ranking Tab
The Teammates Ranking tab displays a table listing each teammate with their individual performance metrics.
Each row in the ranking table shows:
- Teammate name - The identifier for the teammate.
- Avg Score - The teammate’s average performance score with comparison to the previous window.
- Avg Response Time - Mean response time with trend indicator.
- Positive User Rating - The percentage of positive ratings received by this teammate.
- Total Interactions - The number of interactions this teammate handled.
- Total Token Use - Token consumption for this teammate compared to the previous period.
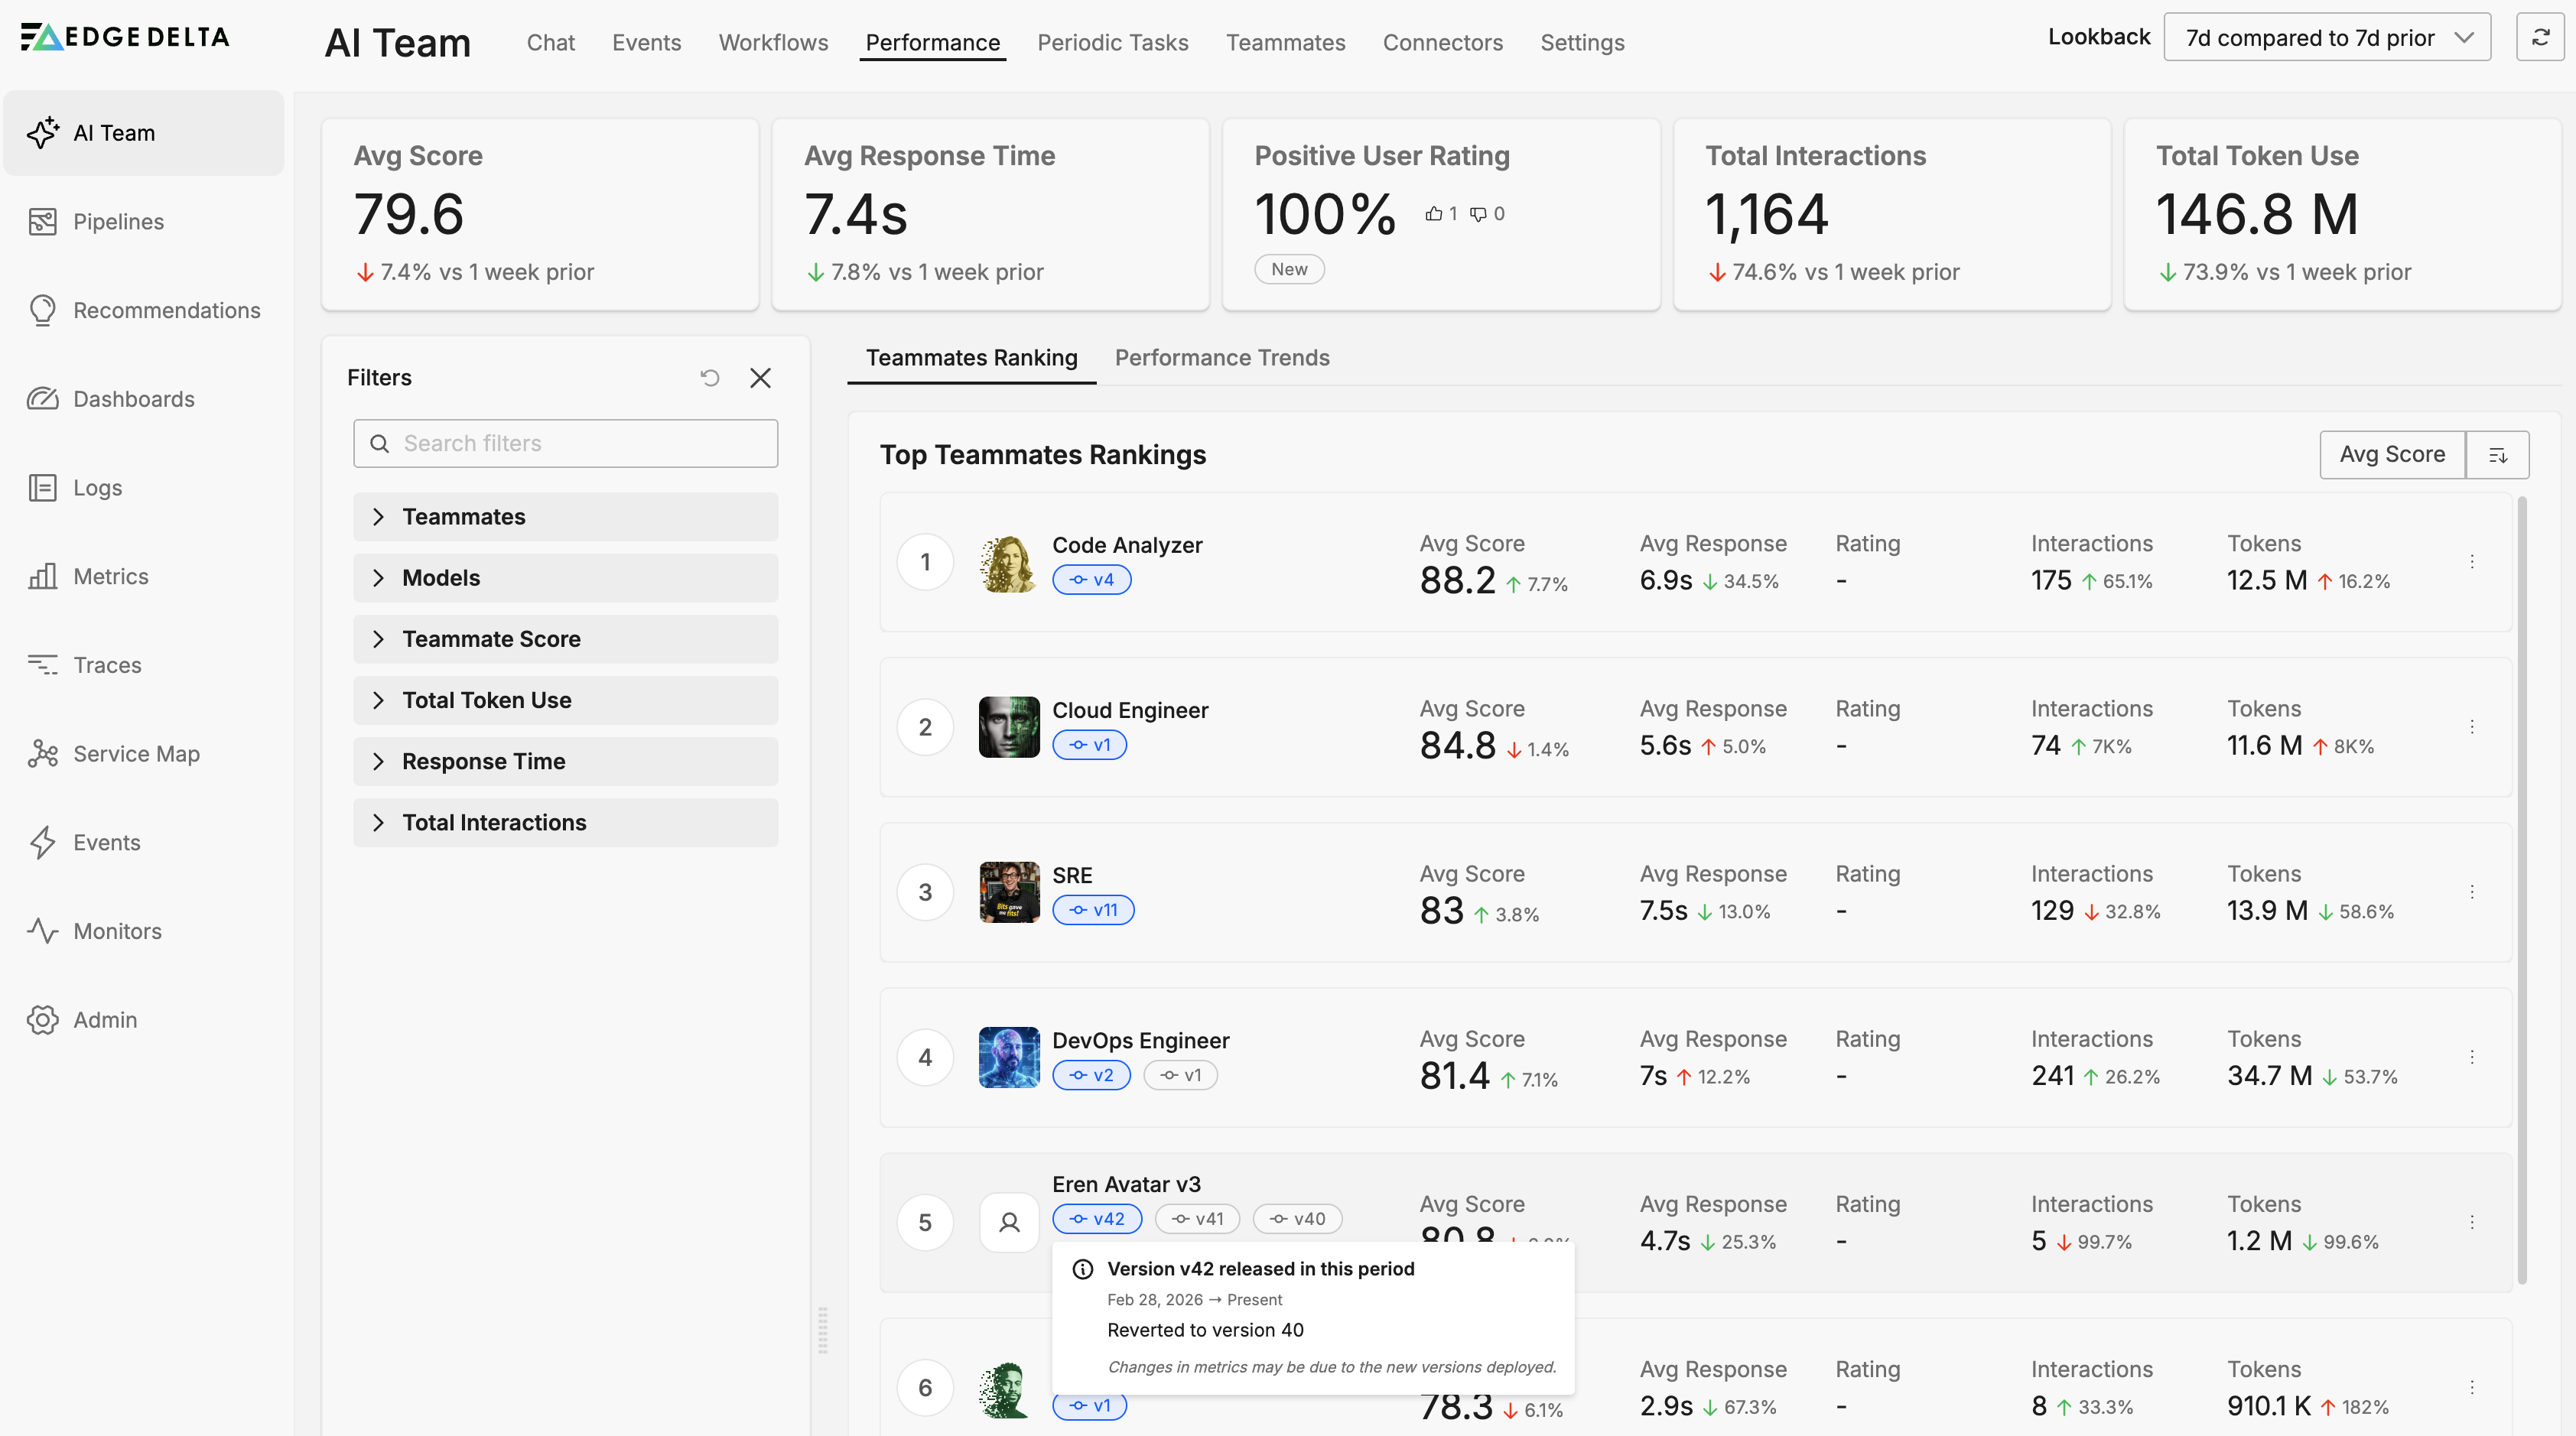
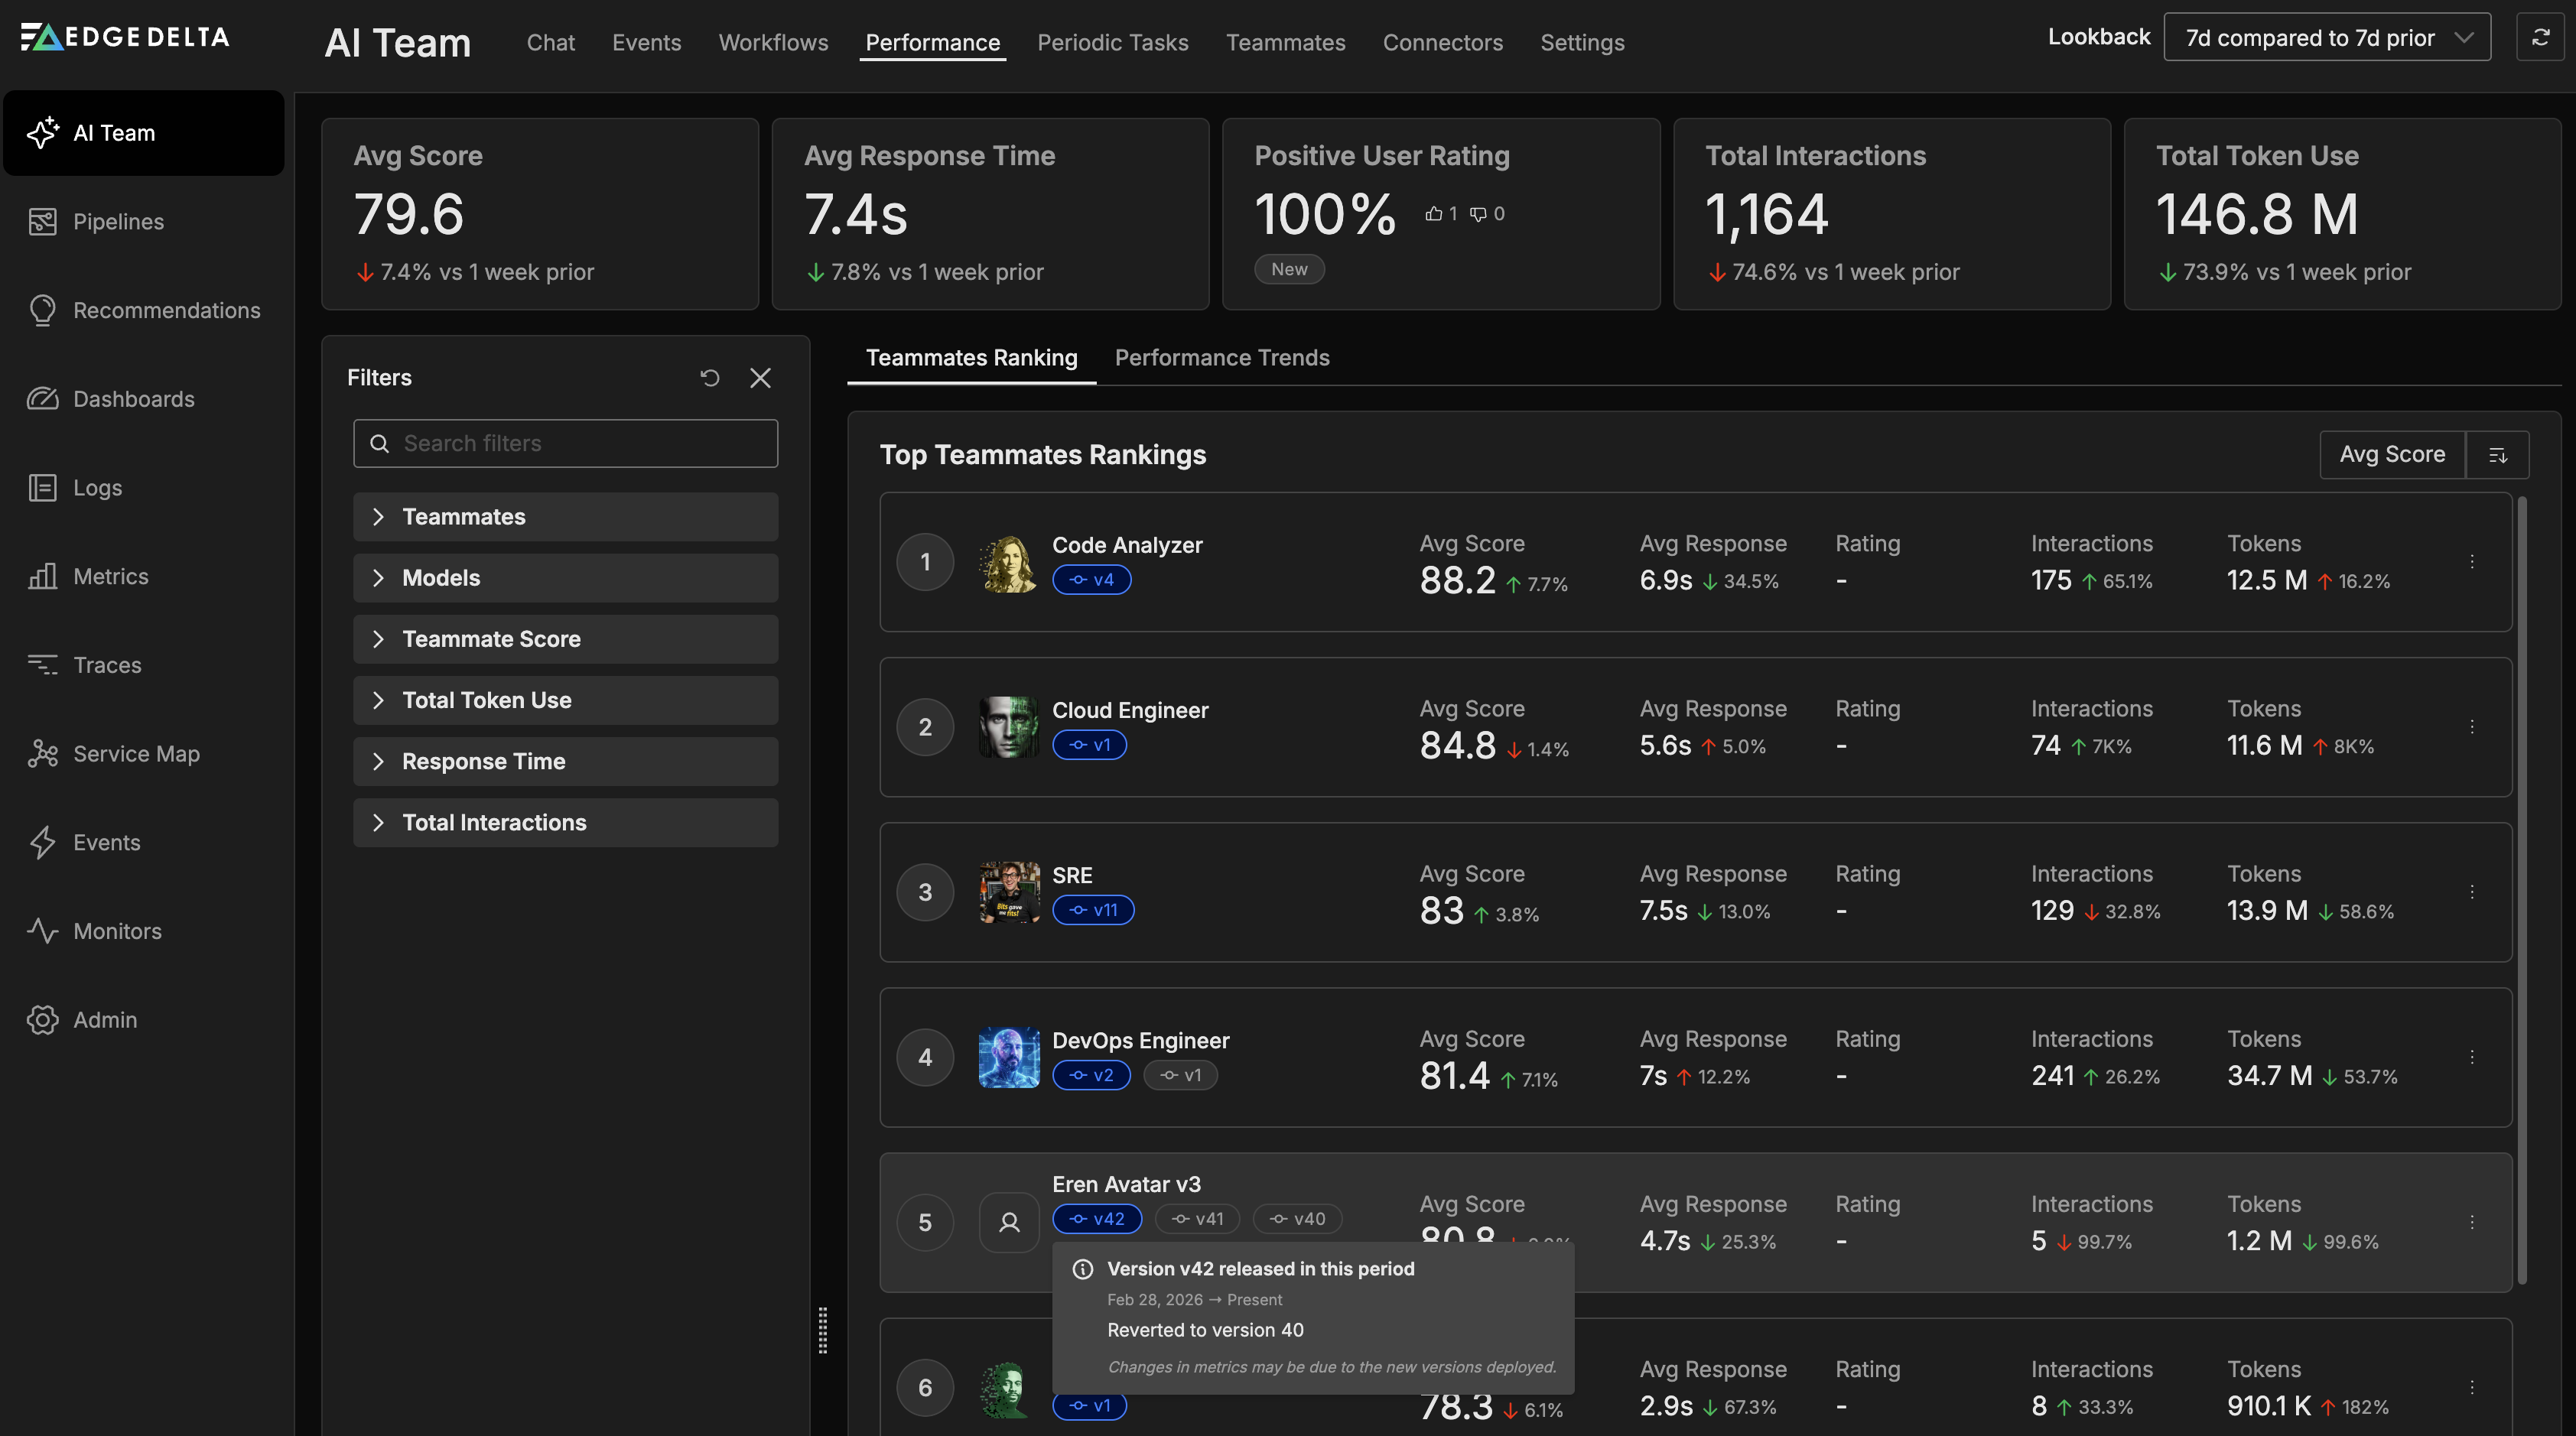
Teammate cards also display version pills when configuration changes occurred during the selected time range. The most recent version appears as a highlighted pill (for example, v42), with up to two older versions shown as greyed-out pills. If more versions exist within the lookback window, a +N more versions pill appears. Hover over any version pill to see its release date range, change notes, and an advisory that metrics may be affected by the new version. Click a version pill to open the teammate details. See Version History for details on teammate versioning.
Use this view to compare teammates side by side and identify which ones perform best on each metric.
Performance Trends Tab
The Performance Trends tab replaces the ranking table with time-series graphs that visualize how teammates perform over the selected window.

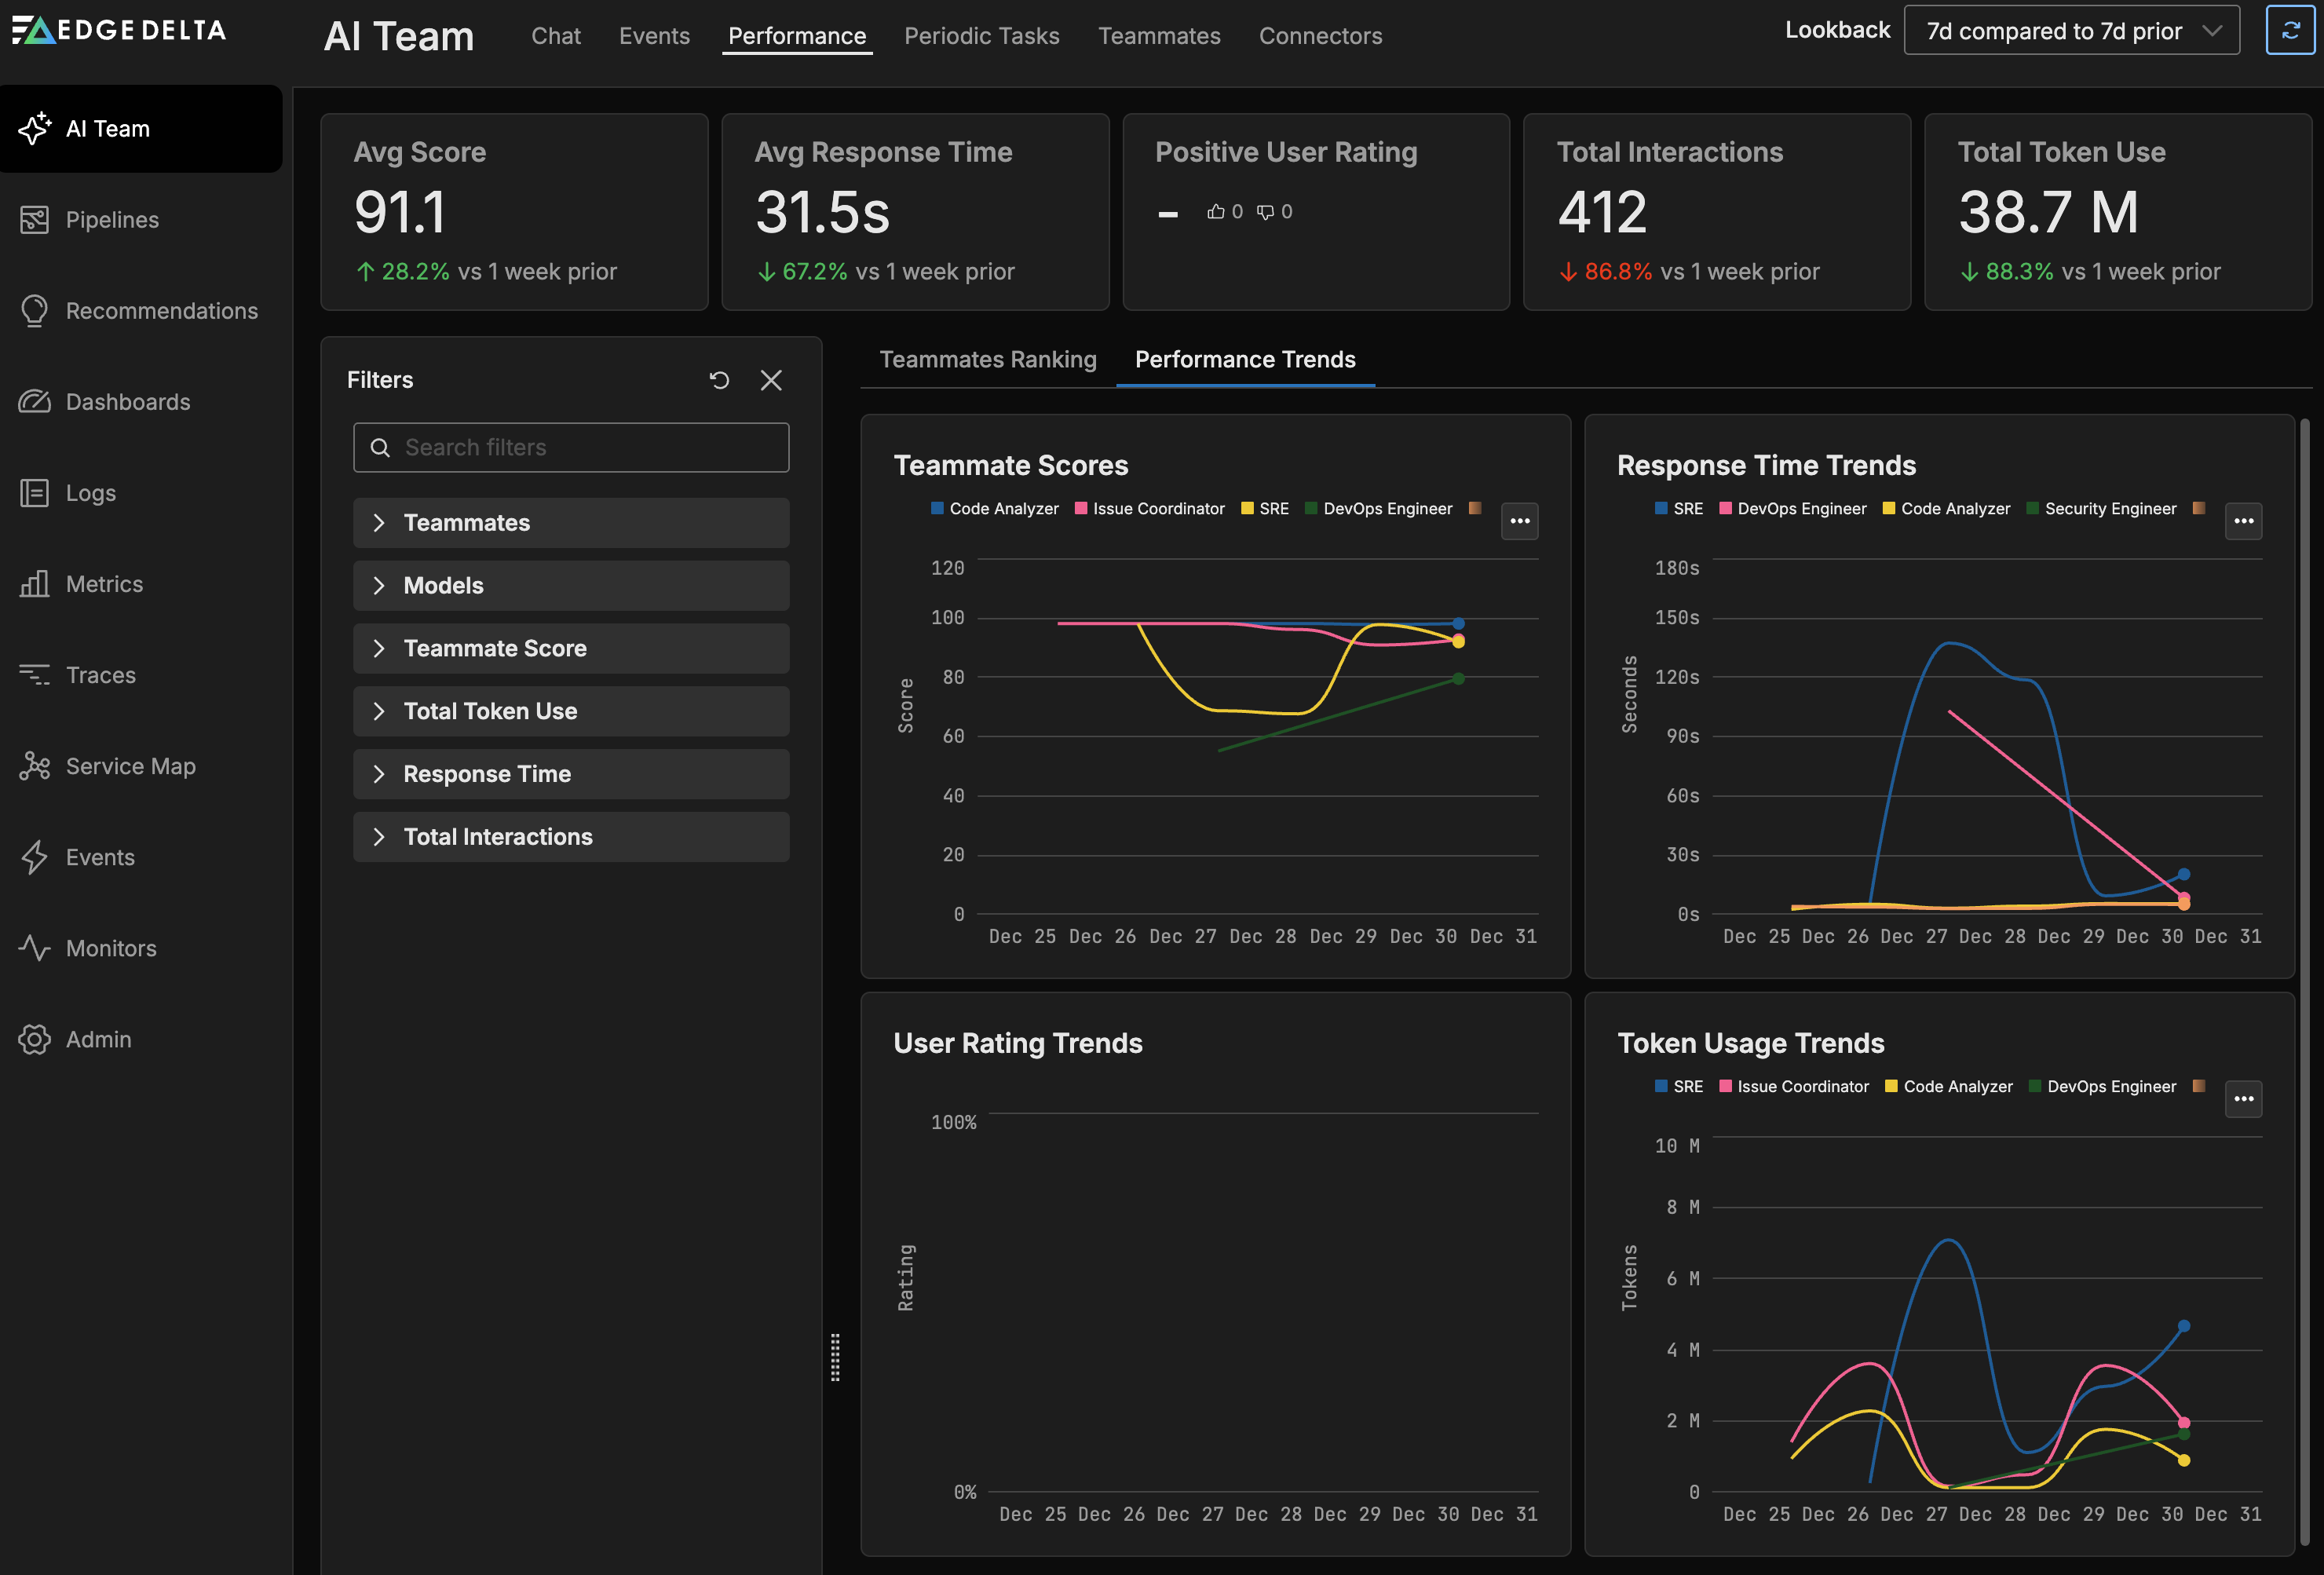
Four trend graphs display teammate performance over time:
- Teammate Scores - A line graph showing each teammate’s score trajectory, with teammates represented as individual series.
- Response Time Trends - Tracks response time changes over the period for each teammate.
- User Rating Trends - Visualizes positive rating percentages over time to reveal satisfaction patterns.
- Token Usage Trends - Shows token consumption over time to identify usage spikes or sustained increases.
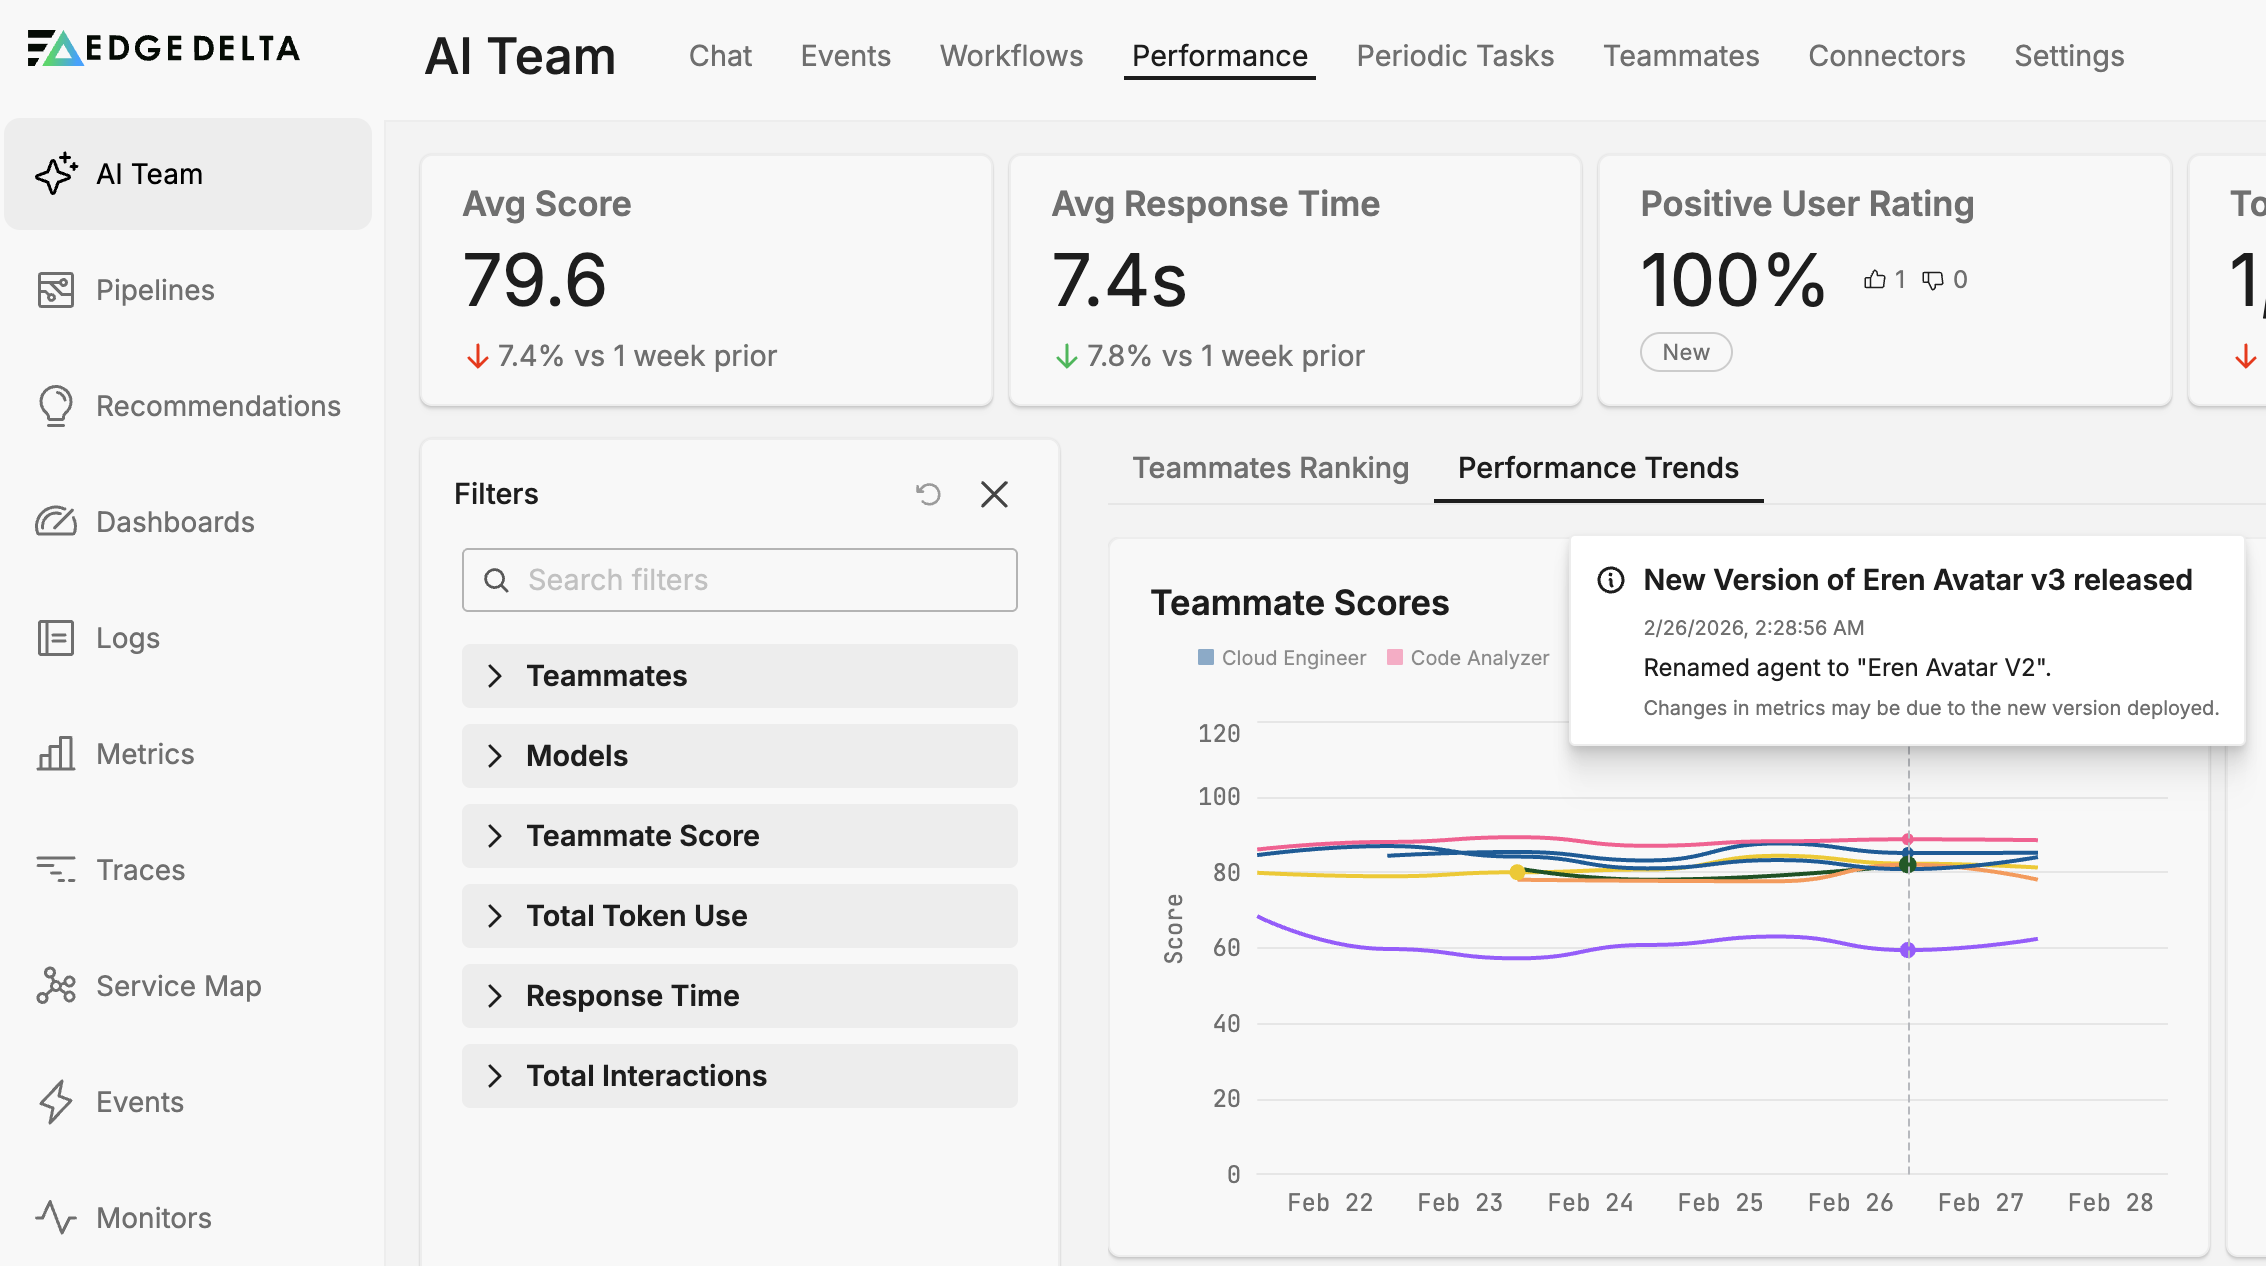
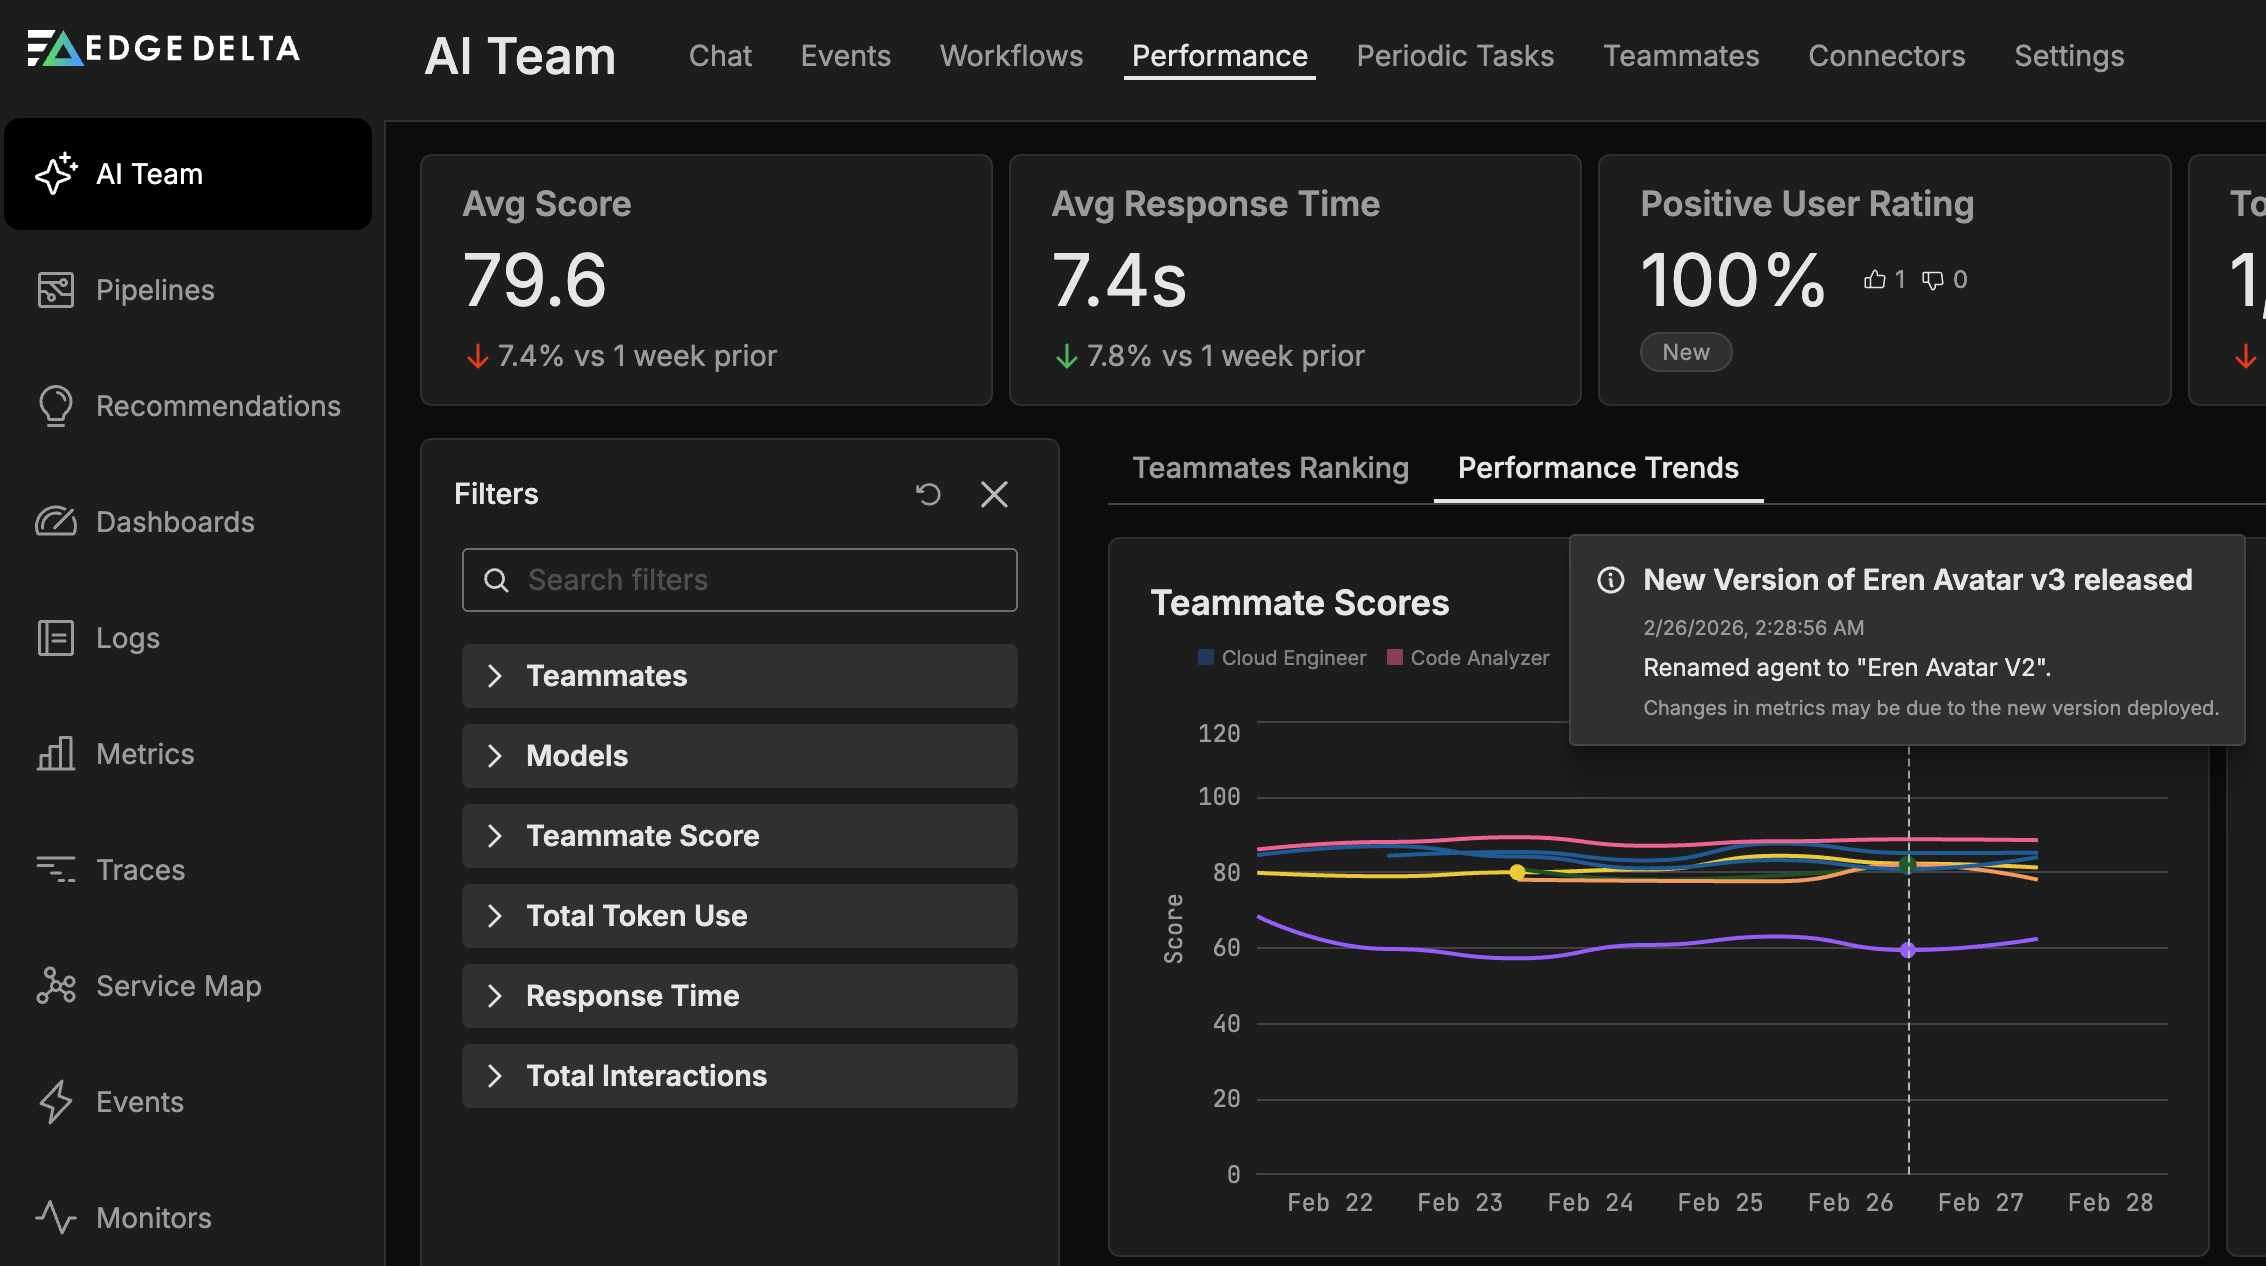
Each graph uses teammates as separate series, allowing you to compare trajectories and spot divergent behavior. Hover over data points for exact values at specific times.
Version changes also appear as dot markers on the trend charts. Each dot represents a teammate version created during the selected time range. Hover over a dot to see the teammate name, release timestamp, change notes, and an advisory that metrics may reflect the new version. Use these markers to correlate configuration changes with shifts in performance metrics.
Best Practices
Use performance data effectively with these approaches:
- Establish baselines - Before making changes to teammate configurations, record current performance metrics to measure impact accurately.
- Monitor after updates - When you modify system prompts, connectors, or model assignments, check performance trends in the following days to verify improvements.
- Investigate outliers - Teammates with unusually high token usage or slow response times may benefit from prompt optimization or connector adjustments.
- Track user feedback - Low positive rating scores often indicate misaligned expectations. Review recent interactions and refine the teammate’s scope or instructions.
- Balance efficiency and quality - High scores with high token usage may justify the cost, while low scores with high usage suggest optimization opportunities.
Related Resources
- AI Team Overview - Understand the AI Team architecture and components.
- Creating and Managing Teammates - Configure teammate settings that affect performance.
- Specialized Teammates - Review the capabilities of built-in teammates.