Azure Event Hub Connector
Configure the Azure Event Hub connector to stream event data from Azure Event Hubs into Edge Delta Pipelines for analysis by AI teammates.
10 minute read
Overview
The Azure Event Hub connector streams event data from Azure Event Hubs into Edge Delta Pipelines. It collects application logs, telemetry, and events from Azure services and makes it available for AI teammates to query through the Edge Delta MCP connector.
When you add this streaming connector, it appears as a Azure Event Hub source in your selected pipeline. AI teammates access this data by querying the Edge Delta backend with the Edge Delta MCP connector.
Add the Azure Event Hub Connector
To add the Azure Event Hub connector, you select a pipeline to receive the event data and configure Azure Event Hub access settings.
Prerequisites
Before configuring the connector, ensure you have:
- Azure Event Hub namespace with an Event Hub created
- Connection string with Listen permission (obtain from Event Hub Shared Access Policies)
- Azure Storage account for checkpoint management
- Azure Storage account access key
- Consumer group name (default is
$Default)
Configuration Steps
- Navigate to AI Team > Connectors in the Edge Delta application
- Find the Azure Event Hub connector in Streaming Connectors
- Click the connector card
- Select the pipeline (environment) to receive this data
- Configure Event Hub and Storage options (see below)
- Click Save
The connector is now streaming Event Hub data into your pipeline.
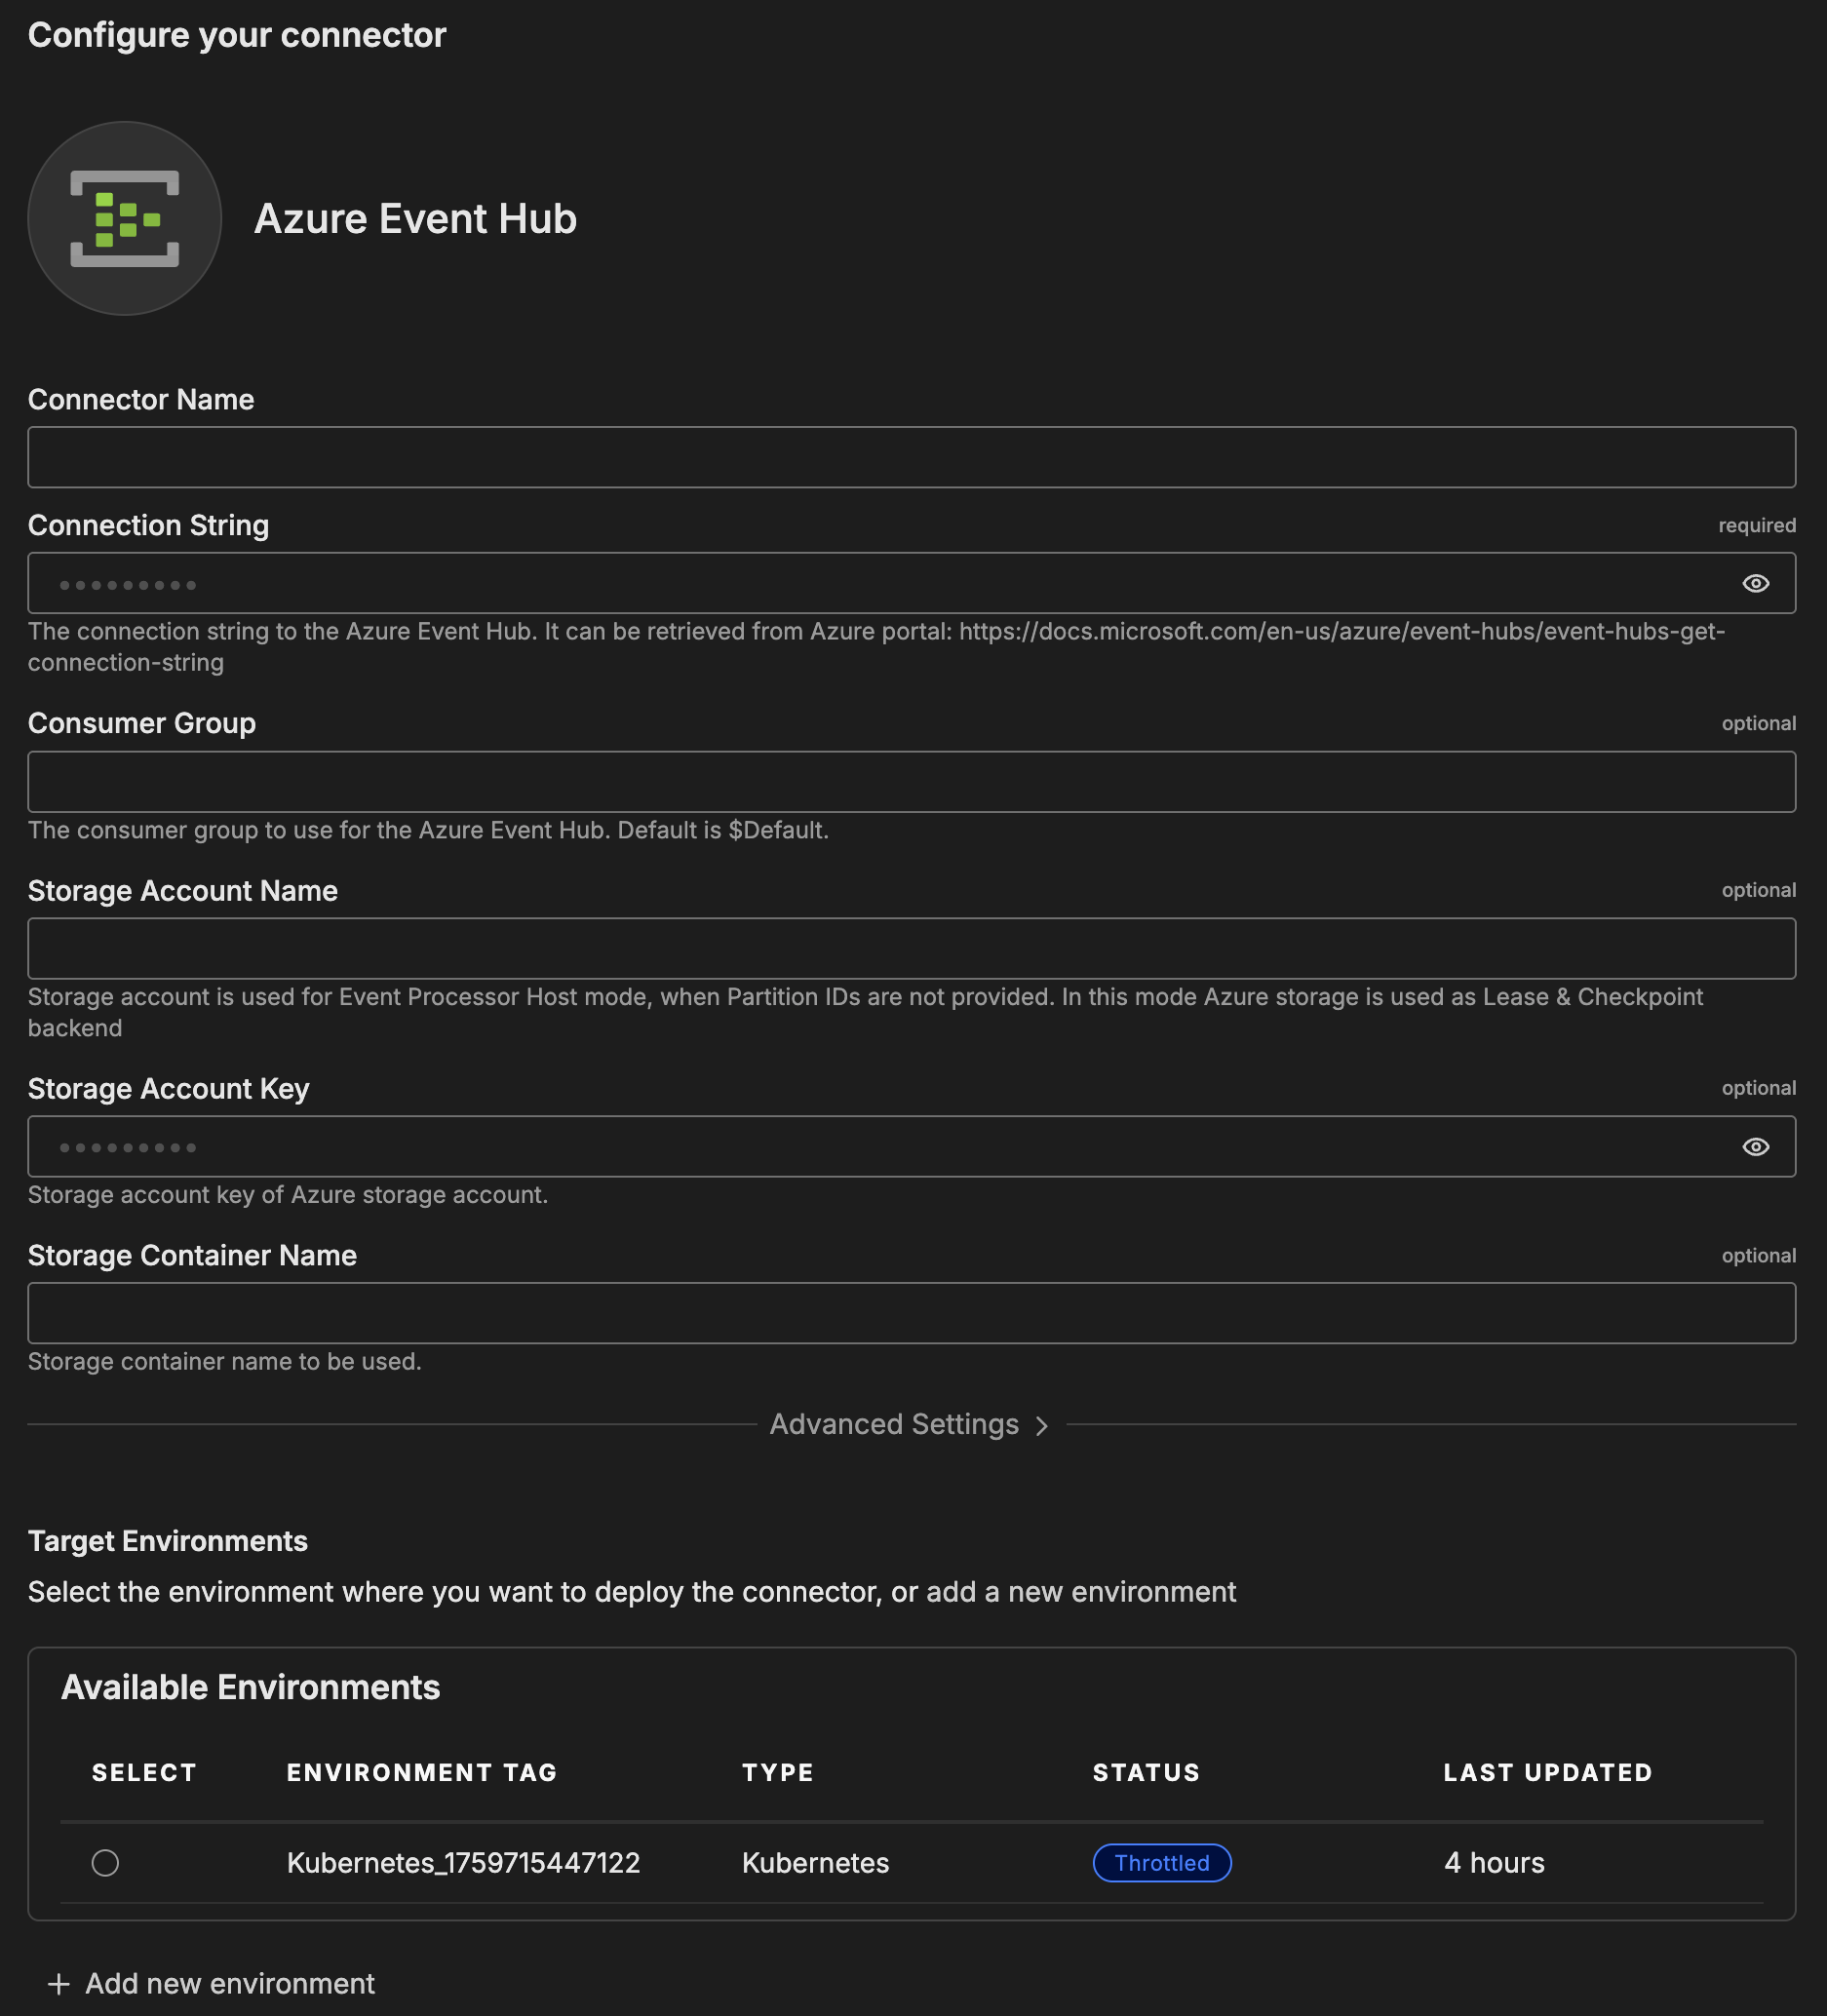
Configuration Options
Connector Name
Name to identify this Azure Event Hub connector instance.
Connection String
Connection string to the Azure Event Hub with Listen permission. The connection string contains the endpoint, shared access key name, shared access key, and entity path needed to connect to your Event Hub.
To retrieve the connection string from Azure Portal:
- Navigate to your Event Hubs Namespace
- Select Shared access policies under Settings
- Choose a policy with Listen claims (or create a new one)
- Copy the Connection string–primary key value
For detailed instructions, see Get an Event Hubs connection string.
Format: Endpoint=sb://namespace.servicebus.windows.net/;SharedAccessKeyName=PolicyName;SharedAccessKey=KEY;EntityPath=eventhubname
Consumer Group
Consumer group to use for the Azure Event Hub. Each consumer group maintains its own offsets independently.
Default: $Default
Storage Account Name
Azure Storage account name used for Event Processor Host checkpointing and lease management. The connector uses this to track progress and coordinate partition consumption.
Format: Storage account name only (e.g., mycompanystorage), not the full URL
Storage Account Key
Access key for the Azure Storage account. Retrieve from Azure Portal: Storage Account → Access Keys → Copy key1 or key2.
Storage Container Name
Blob container name for storing checkpoint and lease data. The container is automatically created if it doesn’t exist.
Format: Lowercase letters, numbers, and hyphens (3-63 characters)
Partition IDs
Specific Event Hub partition IDs to consume. Leave empty to automatically balance all partitions across consumers (Event Processor Host mode).
Default: Empty (automatic partition balancing)
Format: Comma-separated partition numbers (e.g., 0,1,2) or empty
Checkpoint Directory
Local filesystem path for persisting checkpoint data as backup to Azure Storage.
Default: /var/lib/edgedelta/checkpoints
Metadata Level (Resource Attributes)
Resource attributes attached to ingested events for filtering and grouping.
Default attributes: host.name, host.ip, service.name, ed.source.name, ed.source.type
Metadata Level (Attributes)
Additional attributes to attach to events, such as ed.env.id for environment identification.
Rate Limit
The rate_limit parameter enables you to control data ingestion based on system resource usage. This advanced setting helps prevent source nodes from overwhelming the agent by automatically throttling or stopping data collection when CPU or memory thresholds are exceeded.
Use rate limiting to prevent runaway log collection from overwhelming the agent in high-volume sources, protect agent stability in resource-constrained environments with limited CPU/memory, automatically throttle during bursty traffic patterns, and ensure fair resource allocation across source nodes in multi-tenant deployments.
When rate limiting triggers, pull-based sources (File, S3, HTTP Pull) stop fetching new data, push-based sources (HTTP, TCP, UDP, OTLP) reject incoming data, and stream-based sources (Kafka, Pub/Sub) pause consumption. Rate limiting operates at the source node level, where each source with rate limiting enabled independently monitors and enforces its own thresholds.
Rate limiting vs backpressure: Rate limiting and backpressure are different mechanisms. Rate limiting controls data ingestion at the source based on CPU or memory thresholds. Backpressure controls data output at the destination when in-memory queues fill up. Backpressure logs such as
backpressure: dataCh at 92% capacitydo not appear when rate limiting triggers, and rate limiting logs do not appear during backpressure events.
Observability: When rate limiting is active in enforce mode, the agent does not produce INFO, WARN, or ERROR level logs. To confirm that rate limiting is triggering, check the source node’s Bytes I/O metrics in the Edge Delta app for gaps or drops that coincide with expected throttling periods.
Configuration Steps:
- Click Add New in the Rate Limit section
- Click Add New for Evaluation Policy
- Select Policy Type:
- CPU Usage: Monitors CPU consumption and rate limits when usage exceeds defined thresholds. Use for CPU-intensive sources like file parsing or complex transformations.
- Memory Usage: Monitors memory consumption and rate limits when usage exceeds defined thresholds. Use for memory-intensive sources like large message buffers or caching.
- AND (composite): Combines multiple sub-policies with AND logic. All sub-policies must be true simultaneously to trigger rate limiting. Use when you want conservative rate limiting (both CPU and memory must be high).
- OR (composite): Combines multiple sub-policies with OR logic. Any sub-policy can trigger rate limiting. Use when you want aggressive rate limiting (either CPU or memory being high triggers).
- Select Evaluation Mode. Choose how the policy behaves when thresholds are exceeded:
- Enforce (default): Actively applies rate limiting when thresholds are met. Pull-based sources (File, S3, HTTP Pull) stop fetching new data, push-based sources (HTTP, TCP, UDP, OTLP) reject incoming data, and stream-based sources (Kafka, Pub/Sub) pause consumption. Use in production to protect agent resources.
- Monitor: Logs when rate limiting would occur without actually limiting data flow. Use for testing thresholds before enforcing them in production.
- Passthrough: Disables rate limiting entirely while keeping the configuration in place. Use to temporarily disable rate limiting without removing configuration.
- Set Absolute Limits and Relative Limits (for CPU Usage and Memory Usage policies)
Note: If you specify both absolute and relative limits, the system evaluates both conditions and rate limiting triggers when either condition is met (OR logic). For example, if you set absolute limit to
1.0CPU cores and relative limit to50%, rate limiting triggers when the source uses either 1 full core OR 50% of available CPU, whichever happens first.
For CPU Absolute Limits: Enter value in full core units:
0.1= one-tenth of a CPU core0.5= half a CPU core1.0= one full CPU core2.0= two full CPU cores
For CPU Relative Limits: Enter percentage of total available CPU (0-100):
50= 50% of available CPU75= 75% of available CPU85= 85% of available CPU
For Memory Absolute Limits: Enter value in bytes
104857600= 100Mi (100 × 1024 × 1024)536870912= 512Mi (512 × 1024 × 1024)1073741824= 1Gi (1 × 1024 × 1024 × 1024)
For Memory Relative Limits: Enter percentage of total available memory (0-100)
60= 60% of available memory75= 75% of available memory80= 80% of available memory
- Set Refresh Interval (for CPU Usage and Memory Usage policies). Specify how frequently the system checks resource usage:
- Recommended Values:
10sto30sfor most use cases5sto10sfor high-volume sources requiring quick response1mor higher for stable, low-volume sources
The system fetches current CPU/memory usage at the specified refresh interval and uses that value for evaluation until the next refresh. Shorter intervals provide more responsive rate limiting but incur slightly higher overhead, while longer intervals are more efficient but slower to react to sudden resource spikes.
The GUI generates YAML as follows:
# Simple CPU-based rate limiting
nodes:
  - name: <node name>
    type: <node type>
    rate_limit:
      evaluation_policy:
        policy_type: cpu_usage
        evaluation_mode: enforce
        absolute_limit: 0.5  # Limit to half a CPU core
        refresh_interval: 10s
# Simple memory-based rate limiting
nodes:
  - name: <node name>
    type: <node type>
    rate_limit:
      evaluation_policy:
        policy_type: memory_usage
        evaluation_mode: enforce
        absolute_limit: 536870912  # 512Mi in bytes
        refresh_interval: 30s
Composite Policies (AND / OR)
When using AND or OR policy types, you define sub-policies instead of limits. Sub-policies must be siblings (at the same level)—do not nest sub-policies within other sub-policies. Each sub-policy is independently evaluated, and the parent policy’s evaluation mode applies to the composite result.
- AND Logic: All sub-policies must evaluate to true at the same time to trigger rate limiting. Use when you want conservative rate limiting (limit only when CPU AND memory are both high).
- OR Logic: Any sub-policy evaluating to true triggers rate limiting. Use when you want aggressive protection (limit when either CPU OR memory is high).
Configuration Steps:
- Select AND (composite) or OR (composite) as the Policy Type
- Choose the Evaluation Mode (typically Enforce)
- Click Add New under Sub-Policies to add the first condition
- Configure the first sub-policy by selecting policy type (CPU Usage or Memory Usage), selecting evaluation mode, setting absolute and/or relative limits, and setting refresh interval
- In the parent policy (not within the child), click Add New again to add a sibling sub-policy
- Configure additional sub-policies following the same pattern
The GUI generates YAML as follows:
# AND composite policy - both CPU AND memory must exceed limits
nodes:
  - name: <node name>
    type: <node type>
    rate_limit:
      evaluation_policy:
        policy_type: and
        evaluation_mode: enforce
        sub_policies:
          # First sub-policy (sibling)
          - policy_type: cpu_usage
            evaluation_mode: enforce
            absolute_limit: 0.75  # Limit to 75% of one core
            refresh_interval: 15s
          # Second sub-policy (sibling)
          - policy_type: memory_usage
            evaluation_mode: enforce
            absolute_limit: 1073741824  # 1Gi in bytes
            refresh_interval: 15s
# OR composite policy - either CPU OR memory can trigger
nodes:
  - name: <node name>
    type: <node type>
    rate_limit:
      evaluation_policy:
        policy_type: or
        evaluation_mode: enforce
        sub_policies:
          - policy_type: cpu_usage
            evaluation_mode: enforce
            relative_limit: 85  # 85% of available CPU
            refresh_interval: 20s
          - policy_type: memory_usage
            evaluation_mode: enforce
            relative_limit: 80  # 80% of available memory
            refresh_interval: 20s
# Monitor mode for testing thresholds
nodes:
  - name: <node name>
    type: <node type>
    rate_limit:
      evaluation_policy:
        policy_type: memory_usage
        evaluation_mode: monitor  # Only logs, doesn't limit
        relative_limit: 70  # Test at 70% before enforcing
        refresh_interval: 30s
Target Environments
Select the Edge Delta pipeline (environment) where you want to deploy this connector.
How to Use the Azure Event Hub Connector
The Azure Event Hub connector integrates seamlessly with AI Team, enabling analysis of streaming event data from Azure services. AI teammates automatically leverage the ingested data based on the queries they receive and the context of the conversation.
Use Case: Azure Application Diagnostics
When Azure App Services or Functions stream diagnostic logs to Event Hub, AI teammates can analyze application errors, performance issues, and usage patterns. For example, when investigating a production incident, teammates can correlate application exceptions from Event Hub with infrastructure metrics to identify root causes.
Use Case: IoT Device Monitoring
Azure IoT Hub routes device telemetry to Event Hub for downstream processing. AI teammates can analyze device health patterns, identify failing sensors, and detect anomalies across device populations. This is valuable when combined with alert event connectors like PagerDuty—teammates can investigate IoT alerts by querying recent telemetry from affected devices.
Use Case: Azure Resource Activity Analysis
Azure Monitor diagnostic settings export resource activity logs to Event Hub. AI teammates can track configuration changes, analyze resource health trends, and correlate operational events across your Azure infrastructure. When integrated with ticketing systems like Jira, teammates can automatically document infrastructure changes and their impacts.
Troubleshooting
Connection errors: Verify the connection string is complete and correctly formatted, including endpoint, shared access key name, key, and entity path. Ensure the Event Hub exists and is not paused.
Authentication failures: Confirm the shared access policy has Listen permission on the Event Hub. Verify the storage account key is valid and hasn’t been rotated.
Checkpoint errors: Ensure the storage container name follows Azure naming requirements (3-63 lowercase characters, numbers, hyphens). Verify the storage account key provides write access.
No events received: Check that events are being sent to the Event Hub (verify in Azure Portal metrics). Confirm the consumer group name matches exactly (case-sensitive).
High partition lag: Increase Edge Delta consumer instances to distribute partition processing load. Optimize downstream pipeline processing to reduce per-event processing time.
Next Steps
- Learn about creating custom teammates that can use Event Hub data
- Explore the Edge Delta MCP connector for querying event data
For additional help, visit AI Team Support.