Edge Delta ClickHouse Destination
12 minute read
Overview
The ClickHouse destination node streams data to ClickHouse databases via the HTTP interface. ClickHouse is a high-performance, column-oriented database management system optimized for real-time analytics on large datasets.
This node supports schema mapping using OTTL expressions, allowing you to define how Edge Delta fields map to ClickHouse columns. Data is sent using the ClickHouse HTTP interface with optional gzip compression for improved throughput.
Note: This node is currently in beta and is available for Enterprise tier accounts.
This node requires Edge Delta agent version v2.10.0 or higher.
Example Configuration
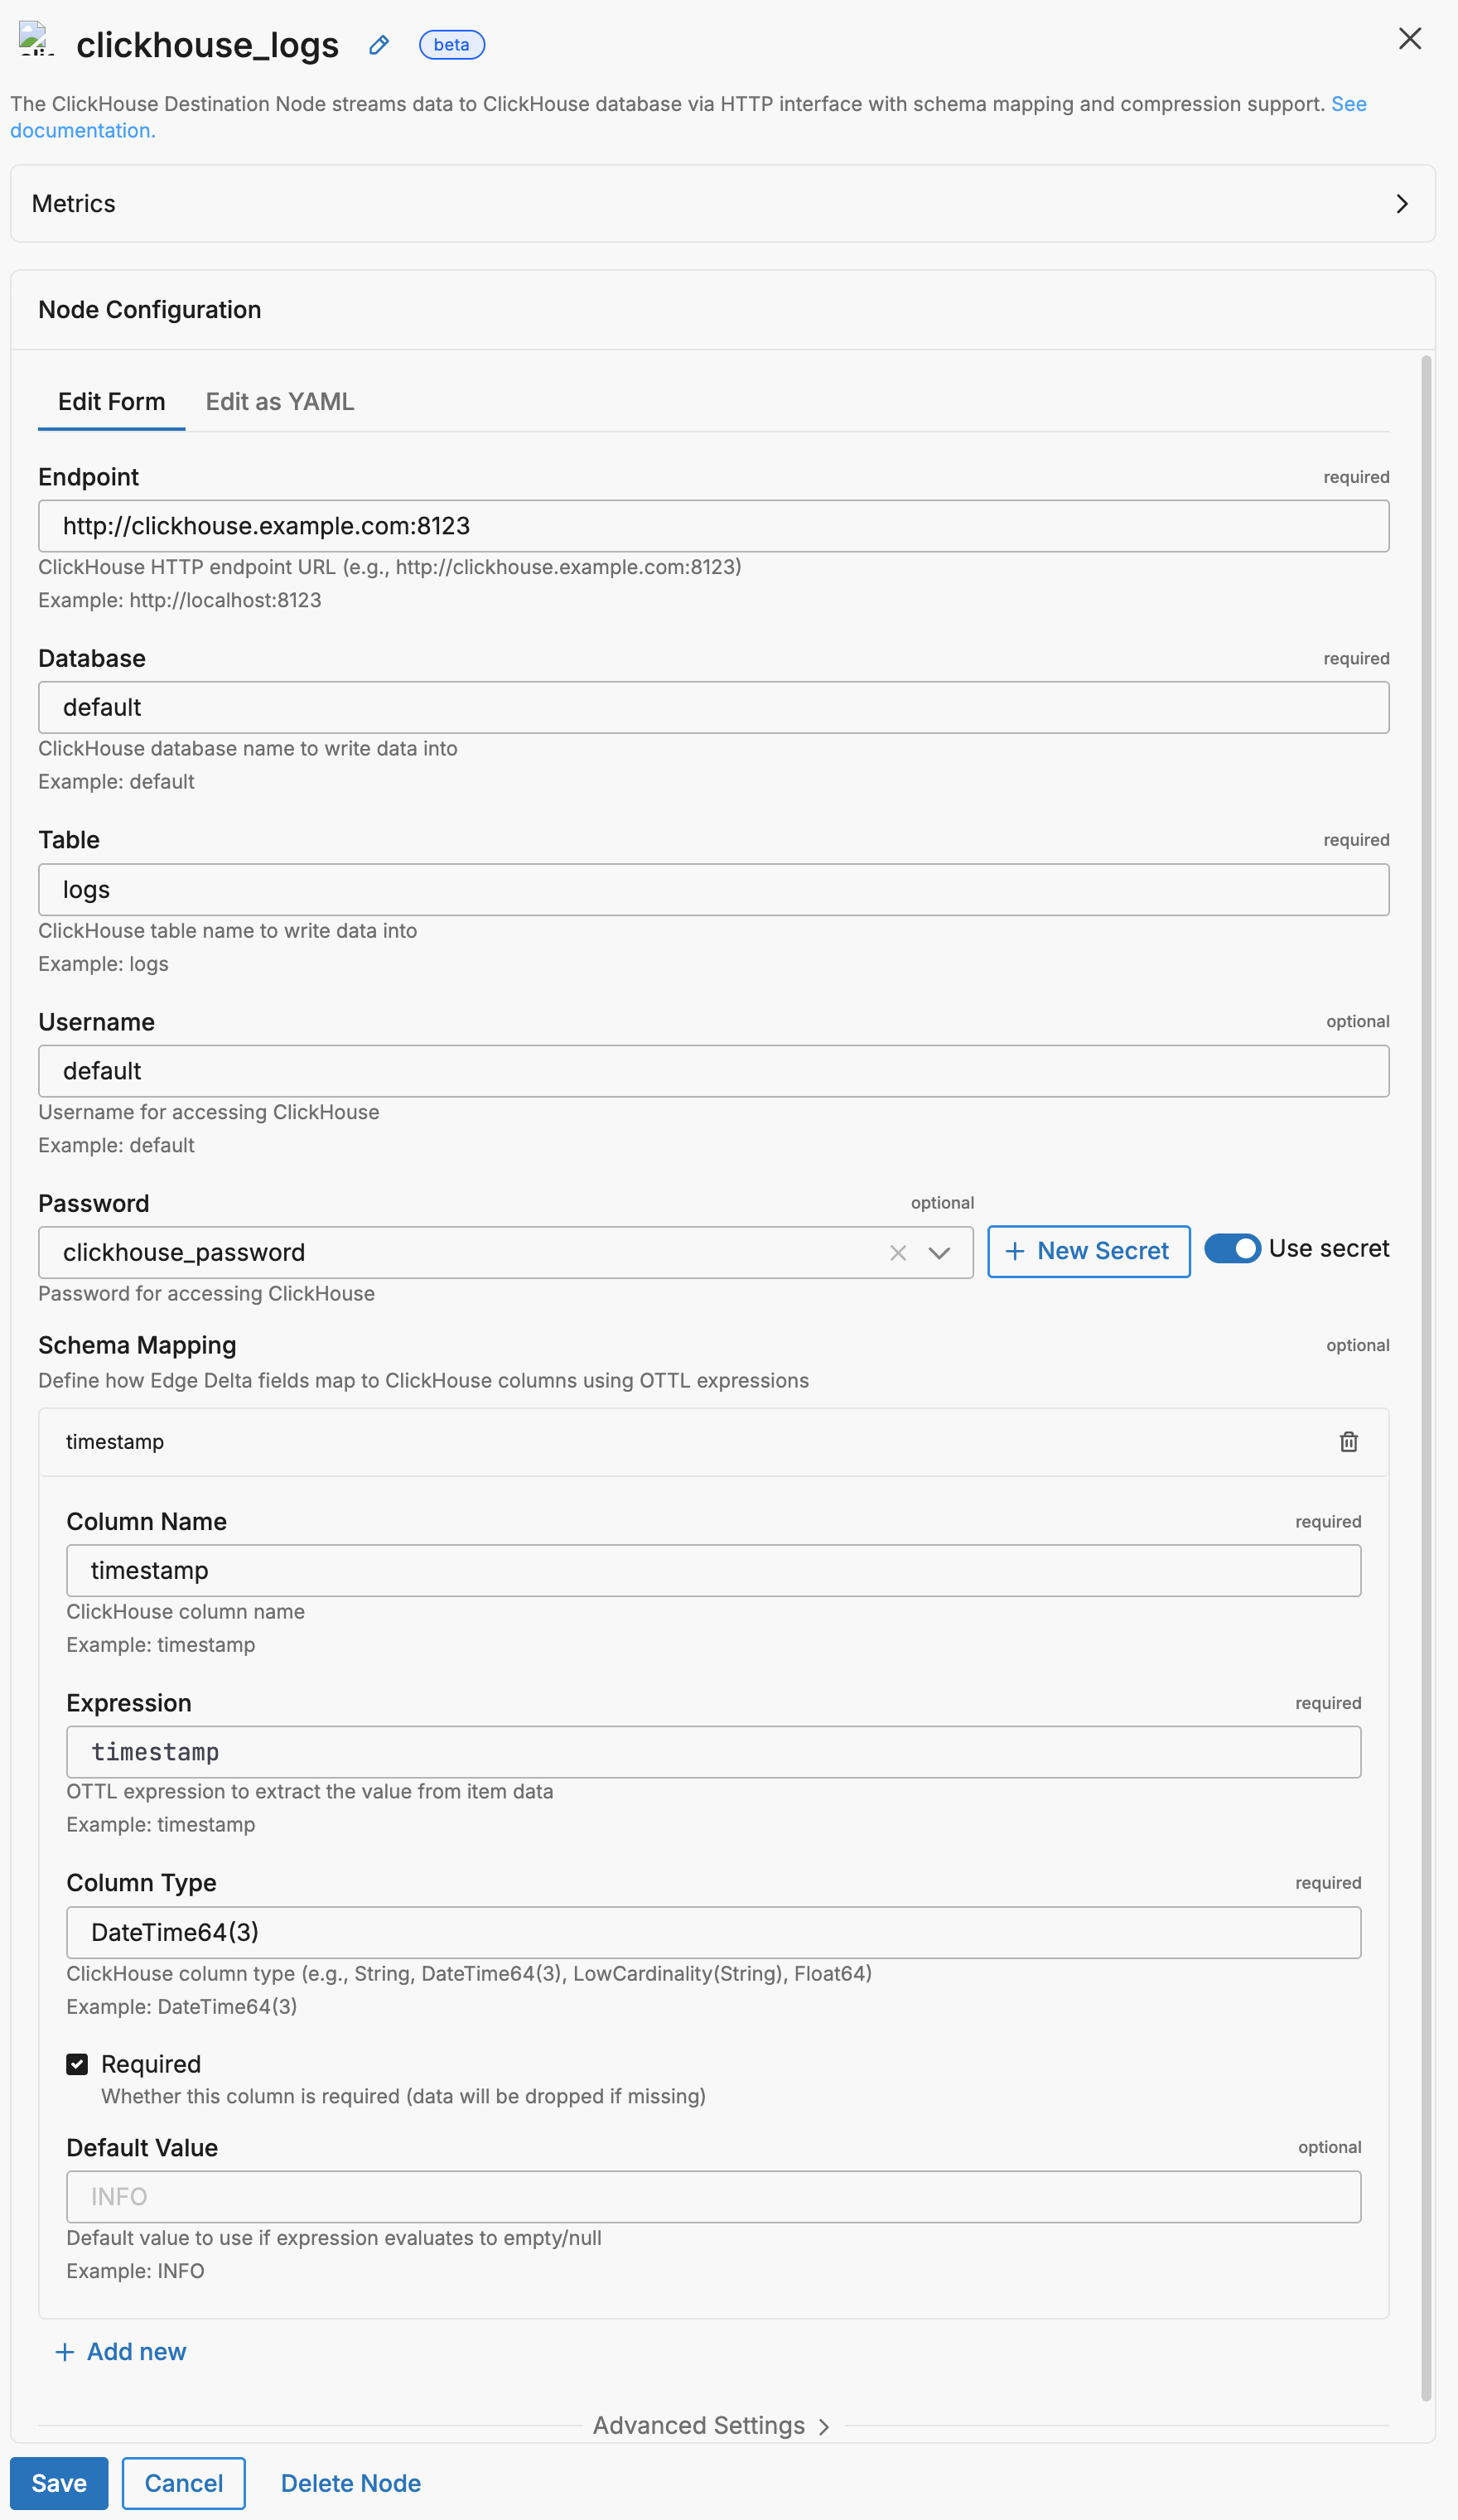
This configuration sends log data to a ClickHouse table. The schema_mapping defines how Edge Delta data fields map to ClickHouse columns using OTTL expressions.
nodes:
  - name: clickhouse_logs
    type: clickhouse_output
    endpoint: "http://clickhouse.example.com:8123"
    database: default
    clickhouse_table: logs
    password: '{{ SECRET clickhouse_password }}'
    compression: gzip
    schema_mapping:
      - column_name: timestamp
        expression: timestamp
        column_type: DateTime64(3)
        required: true
      - column_name: severity
        expression: severity_text
        column_type: LowCardinality(String)
        default_value: INFO
      - column_name: body
        expression: body
        column_type: String
      - column_name: host
        expression: resource["host.name"]
        column_type: String
      - column_name: service
        expression: resource["service.name"]
        column_type: LowCardinality(String)
See Secrets for information on securely storing credentials.
Required Parameters
name
A descriptive name for the node. This is the name that will appear in pipeline builder and you can reference this node in the YAML using the name. It must be unique across all nodes. It is a YAML list element so it begins with a - and a space followed by the string. It is a required parameter for all nodes.
nodes:
  - name: <node name>
    type: <node type>
type: clickhouse_output
The type parameter specifies the type of node being configured. It is specified as a string from a closed list of node types. It is a required parameter.
nodes:
  - name: <node name>
    type: <node type>
endpoint
The ClickHouse HTTP endpoint URL. This is the HTTP interface endpoint for your ClickHouse instance, typically running on port 8123.
nodes:
  - name: <node name>
    type: clickhouse_output
    endpoint: "http://clickhouse.example.com:8123"
    database: <database>
    clickhouse_table: <table>
database
The ClickHouse database name to write data into. The database must already exist in your ClickHouse instance.
nodes:
  - name: <node name>
    type: clickhouse_output
    endpoint: <endpoint>
    database: default
    clickhouse_table: <table>
clickhouse_table
The ClickHouse table name to write data into. The table must already exist within the specified database with a schema compatible with your schema_mapping configuration.
nodes:
  - name: <node name>
    type: clickhouse_output
    endpoint: <endpoint>
    database: <database>
    clickhouse_table: logs
Optional Parameters
disabled
The disabled parameter disables the node in the pipeline. When set to true, the agent ignores the node at startup. You can toggle nodes on or off in the pipeline builder. It is specified as a boolean, defaults to false, and is optional.
nodes:
  - name: <node name>
    type: <node type>
    disabled: true
username
Username for authenticating with ClickHouse. If omitted, uses the default ClickHouse user.
nodes:
  - name: <node name>
    type: clickhouse_output
    endpoint: <endpoint>
    database: <database>
    clickhouse_table: <table>
    username: default
user
Username for ClickHouse access. If omitted, the default ClickHouse user is used. It is specified as a string and is optional.
nodes:
  - name: <node name>
    type: clickhouse_output
    endpoint: <endpoint>
    database: <database>
    clickhouse_table: <table>
    user: analytics_writer
password
Password for authenticating with ClickHouse.
This field supports secret references for secure credential management. Instead of hardcoding sensitive values, you can reference a secret configured in your pipeline.
To use a secret in the GUI:
- Create a secret in your pipeline’s Settings > Secrets section (see Secrets)
- In this field, select the secret name from the dropdown list that appears
To use a secret in YAML:
Reference it using the syntax: '{{ SECRET secret-name }}'
Example:
field_name: '{{ SECRET my-credential }}'
Note: The secret reference must be enclosed in single quotes when using YAML. Secret values are encrypted at rest and resolved at runtime, ensuring no plaintext credentials appear in logs or API responses.
nodes:
  - name: <node name>
    type: clickhouse_output
    endpoint: <endpoint>
    database: <database>
    clickhouse_table: <table>
    password: '{{ SECRET clickhouse_password }}'
compression
Compression method for data sent to ClickHouse. Options are none or gzip. Default is gzip.
nodes:
  - name: <node name>
    type: clickhouse_output
    endpoint: <endpoint>
    database: <database>
    clickhouse_table: <table>
    compression: gzip
flush_byte_length
Maximum size of data to accumulate before flushing to ClickHouse, in bytes. Default is 1048576 (1 MB).
nodes:
  - name: <node name>
    type: clickhouse_output
    endpoint: <endpoint>
    database: <database>
    clickhouse_table: <table>
    flush_byte_length: 2097152
schema_mapping
Defines how Edge Delta fields map to ClickHouse columns using OTTL expressions. Each mapping includes:
| Field | Description | Required |
|---|---|---|
column_name | ClickHouse column name | Yes |
expression | OTTL expression to extract the value from item data | Yes |
column_type | ClickHouse column type (e.g., String, DateTime64(3), LowCardinality(String), Float64) | Yes |
required | If true, data is dropped when this field is missing | No |
default_value | Default value if expression evaluates to empty/null | No |
nodes:
  - name: <node name>
    type: clickhouse_output
    endpoint: <endpoint>
    database: <database>
    clickhouse_table: <table>
    schema_mapping:
      - column_name: timestamp
        expression: timestamp
        column_type: DateTime64(3)
        required: true
      - column_name: message
        expression: body
        column_type: String
tls
TLS configuration for secure connections to ClickHouse.
| Field | Description | Default |
|---|---|---|
enabled | Enable TLS for this connection | false |
ignore_certificate_check | Disable certificate verification (not recommended for production) | false |
ca_file | Path to CA certificate file | - |
crt_file | Path to client certificate file | - |
key_file | Path to client private key file | - |
min_version | Minimum TLS version (TLSv1_2, TLSv1_3) | TLSv1_2 |
nodes:
  - name: <node name>
    type: clickhouse_output
    endpoint: "https://clickhouse.example.com:8443"
    database: <database>
    clickhouse_table: <table>
    tls:
      enabled: true
      ca_file: /etc/ssl/certs/ca.crt
persistent_queue
The persistent_queue configuration enables disk-based buffering to prevent data loss during destination failures or slowdowns. When enabled, the agent stores data on disk and automatically retries delivery when the destination recovers.
Complete example:
persistent_queue:
  path: /var/lib/edgedelta/outputbuffer
  mode: error
  max_byte_size: 1GB
  drain_rate_limit: 1000
How it works:
- Normal operation: Data flows directly to the destination (for
errorandbackpressuremodes) or through the disk buffer (foralwaysmode) - Destination issue detected: Based on the configured
mode, data is written to disk at the configuredpath - Recovery: When the destination recovers, buffered data drains at the configured
drain_rate_limitwhile new data continues flowing - Completion: Buffer clears and normal operation resumes
Key benefits:
- Data durability: Logs preserved during destination outages and slowdowns
- Agent protection: Slow backends don’t cascade failures into the agent cluster
- Automatic recovery: No manual intervention required
- Configurable behavior: Choose when and how buffering occurs based on your needs
Learn more: Buffer Configuration - Conceptual overview, sizing guidance, and troubleshooting
path
The path parameter specifies the directory where buffered data is stored on disk. This parameter is required when configuring a persistent queue.
Example:
persistent_queue:
  path: /var/lib/edgedelta/outputbuffer
Requirements:
- Required field - persistent queue will not function without a valid path
- The directory must have sufficient disk space for the configured
max_byte_size - The agent process must have read/write permissions to this location
- The path should be on a persistent volume (not tmpfs or memory-backed filesystem)
Best practices:
- Use dedicated storage for buffer data separate from logs
- Monitor disk usage to prevent buffer from filling available space
- Ensure the path persists across agent restarts to maintain buffered data
max_byte_size
The max_byte_size parameter defines the maximum disk space the persistent buffer is allowed to use. Once this limit is reached, any new incoming items are dropped, ensuring the buffer never grows beyond the configured maximum.
Note: This limit is total storage for the persistent queue, not per-worker. If you configure
max_byte_size: 1GBand the destination has 15 workers, the buffer uses 1GB total, not 15GB.
Example:
persistent_queue:
  path: /var/lib/edgedelta/outputbuffer
  max_byte_size: 1GB
Sizing guidance:
- Small deployments (1-10 logs/sec): 100MB - 500MB
- Medium deployments (10-100 logs/sec): 500MB - 2GB
- Large deployments (100+ logs/sec): 2GB - 10GB
Calculation example:
Average log size: 1KB
Expected outage duration: 1 hour
Log rate: 100 logs/sec

Buffer size = 1KB × 100 logs/sec × 3600 sec = 360MB
Recommended: 500MB - 1GB (with safety margin)
Important: Set this value based on your disk space availability and expected outage duration. The buffer will accumulate data during destination failures and drain when the destination recovers.
mode
The mode parameter determines when data is buffered to disk. Three modes are available:
error(default) - Buffers data only when the destination returns errors (connection failures, HTTP 5xx errors, timeouts). During healthy operation, data flows directly to the destination without buffering.backpressure- Buffers data when the in-memory queue reaches 80% capacity OR when destination errors occur. This mode helps handle slow destinations that respond successfully but take longer than usual to process requests.always- Uses write-ahead-log behavior where all data is written to disk before being sent to the destination. This provides maximum durability but adds disk I/O overhead to every operation.
Example:
persistent_queue:
  path: /var/lib/edgedelta/outputbuffer
  mode: error
  max_byte_size: 1GB
Mode comparison:
| Mode | Protects Against | Trade-off | Recommended For |
|---|---|---|---|
error | Destination outages and failures | No protection during slow responses | Reliable destinations with consistent response times |
backpressure | Outages + slow/degraded destinations | Slightly more disk writes during slowdowns | Most production deployments |
always | All scenarios including agent crashes | Disk I/O on every item reduces throughput | Maximum durability requirements |
Why choose error mode:
The error mode provides the minimal protection layer needed to prevent data loss when destinations temporarily fail. Without any persistent queue, a destination outage means data is lost. With error mode enabled, data is preserved on disk during failures and delivered automatically when the destination recovers.
Why choose backpressure mode:
The backpressure mode provides everything error mode offers, plus protection against slow destinations. When a destination is slow but not completely down:
- Without
backpressure: Data delivery becomes unreliable, and the backend’s slowness propagates to the agent—the agent can get stuck waiting before sending subsequent payloads - With
backpressure: The agent spills data to disk and continues processing, isolating itself from the slow backend
This prevents a slow destination from cascading failures into your agent cluster. For most production environments, backpressure provides the best balance of protection and performance.
Why choose always mode:
The always mode is designed for customers with extremely strict durability requirements. It forces the agent to write every item to disk before attempting delivery, then reads from disk for transmission. This guarantees that data survives even sudden agent crashes or restarts.
Important: This mode introduces a measurable performance cost. Each agent performs additional disk I/O on every item, which reduces overall throughput. Most deployments do not require this level of durability—this feature addresses specialized needs that apply to a small minority of customers.
Only enable always mode if you have a specific, well-understood requirement where the durability guarantee outweighs the throughput reduction.
strict_ordering
The strict_ordering parameter controls how items are consumed from the persistent buffer.
When strict_ordering: true, the agent runs in strict ordering mode with a single processing thread. This mode always prioritizes draining buffered items first—new incoming data waits until all buffered items are processed in exact chronological order. When strict_ordering: false (default), multiple workers process data in parallel, and new data flows directly to the destination while buffered data drains in the background.
Example:
persistent_queue:
  path: /var/lib/edgedelta/outputbuffer
  mode: always
  strict_ordering: true
parallel_workers: 1
Default value: false
Important: Strict ordering is a specialized feature needed by a very small minority of deployments. Most users should keep the default value of false. Only enable strict ordering if you have a specific, well-understood requirement for exact event sequencing.
Required setting: When strict_ordering: true, you must set parallel_workers: 1. Pipeline validation will fail if parallel_workers is greater than 1 because parallel processing inherently breaks ordering guarantees.
Behavior:
| Value | Processing Model | Buffer Priority | Recovery Latency |
|---|---|---|---|
false (default) | Parallel workers | Buffered data drains in background | Lower - current state visible immediately |
true | Single-threaded | Buffered items always drain first | Higher - queue must drain before new data |
Why the default is false:
In most observability use cases, data freshness is more valuable than strict ordering. When a destination recovers from an outage, operators typically want to see current system state on dashboards immediately, while historical data backfills in the background. The default behavior prioritizes this real-time visibility.
When to enable strict ordering:
Strict ordering is primarily needed by security-focused customers who build systems where events must arrive in the exact delivery order. These customers typically run stateful security streaming engines that depend on precise temporal sequencing.
Specific use cases:
- Stateful security streaming engines - Security systems that maintain state across events and detect patterns based on exact event order
- Audit and compliance logs - Regulatory requirements that mandate audit trails preserve exact temporal sequence
- State reconstruction - Systems that replay events to rebuild state require chronological order
When to keep default (false):
The vast majority of deployments should keep the default:
- Real-time monitoring dashboards - Current state visibility is more important than historical order
- High-volume log ingestion - Faster drain times reduce recovery period
- Stateless analytics - When each log is analyzed independently without temporal correlation
drain_rate_limit
The drain_rate_limit parameter controls the maximum items per second when draining the persistent buffer after a destination recovers from a failure.
Example:
persistent_queue:
  path: /var/lib/edgedelta/outputbuffer
  drain_rate_limit: 1000
Default value: 0 (no limit - drain as fast as the destination accepts)
Why rate limiting matters:
When a destination recovers from an outage, it may still be fragile. Immediately flooding it with hours of backlogged data can trigger another failure. The drain rate limit allows gradual, controlled recovery that protects destination stability.
Choosing the right rate:
| Scenario | Recommended Rate | Reasoning |
|---|---|---|
| Stable, well-provisioned destination | 0 (unlimited) | Minimize recovery time when destination can handle full load |
| Shared or multi-tenant destination | 20-50% of capacity | Leave headroom for live traffic and other tenants |
| Recently recovered destination | 10-25% of capacity | Gentle ramp-up to prevent re-triggering failure |
| Rate-limited destination (e.g., SaaS) | Below API rate limit | Avoid throttling or quota exhaustion |
Impact on recovery time:
Buffer size: 1GB
Average log size: 1KB
Total items: ~1,000,000 logs

At unlimited (0): Depends on destination capacity
At 5000:      ~3.5 minutes to drain
At 1000:      ~17 minutes to drain
At 100:       ~2.8 hours to drain
memory_buffer
This parameter requires Edge Delta agent version v2.12.0 or higher.
The memory_buffer parameter configures the in-memory buffer queue for the destination. The size sub-parameter sets the maximum number of events to hold in the memory buffer queue before blocking. It is specified as an integer, has a default of 1000, and it is optional.
nodes:
  - name: <destination-name>
    type: <destination-type>
    memory_buffer:
      size: 2000
ClickHouse Table Schema
Create your ClickHouse table with a schema that matches your schema_mapping configuration.
Example Logs Table:
CREATE TABLE logs (
    timestamp DateTime64(3),
    severity LowCardinality(String),
    body String,
    host String,
    service LowCardinality(String)
) ENGINE = MergeTree()
ORDER BY timestamp;
Example Metrics Table:
CREATE TABLE metrics (
    timestamp DateTime64(3),
    metric_name LowCardinality(String),
    metric_value Float64,
    host String,
    tags Map(String, String)
) ENGINE = MergeTree()
ORDER BY (metric_name, timestamp);
Use Cases
Log Analytics
Stream application logs to ClickHouse for fast SQL-based analytics and long-term storage.
nodes:
  - name: clickhouse_app_logs
    type: clickhouse_output
    endpoint: "http://clickhouse:8123"
    database: observability
    clickhouse_table: application_logs
    compression: gzip
    schema_mapping:
      - column_name: timestamp
        expression: timestamp
        column_type: DateTime64(3)
        required: true
      - column_name: level
        expression: severity_text
        column_type: LowCardinality(String)
      - column_name: message
        expression: body
        column_type: String
      - column_name: trace_id
        expression: attributes["trace_id"]
        column_type: String
Metrics Storage
Store time-series metrics in ClickHouse for custom dashboards and reporting.
nodes:
  - name: clickhouse_metrics
    type: clickhouse_output
    endpoint: "http://clickhouse:8123"
    database: metrics
    clickhouse_table: system_metrics
    schema_mapping:
      - column_name: timestamp
        expression: timestamp
        column_type: DateTime64(3)
        required: true
      - column_name: name
        expression: metric_name
        column_type: LowCardinality(String)
        required: true
      - column_name: value
        expression: metric_value
        column_type: Float64
        required: true