Edge Delta Cloud Pipelines
10 minute read
Overview
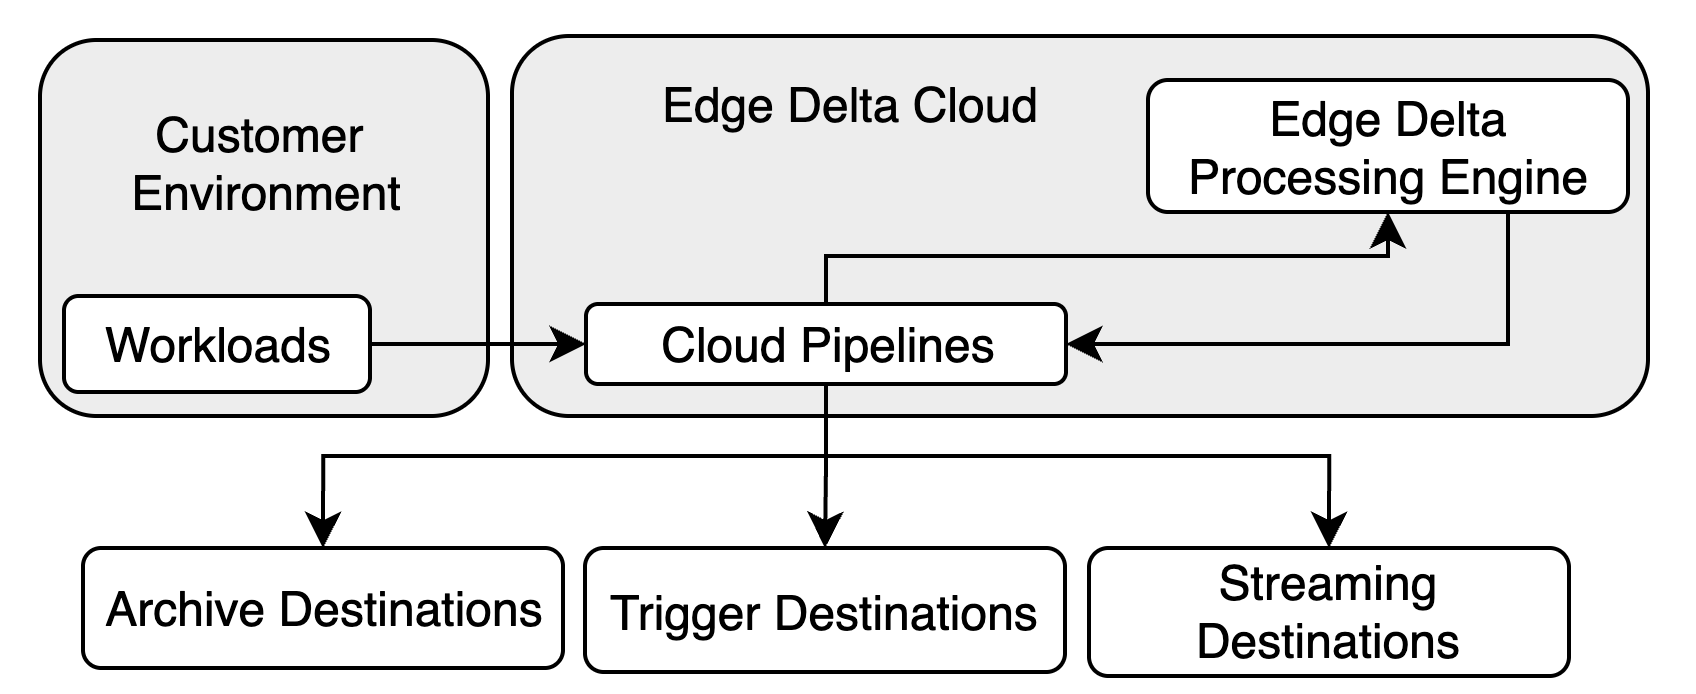
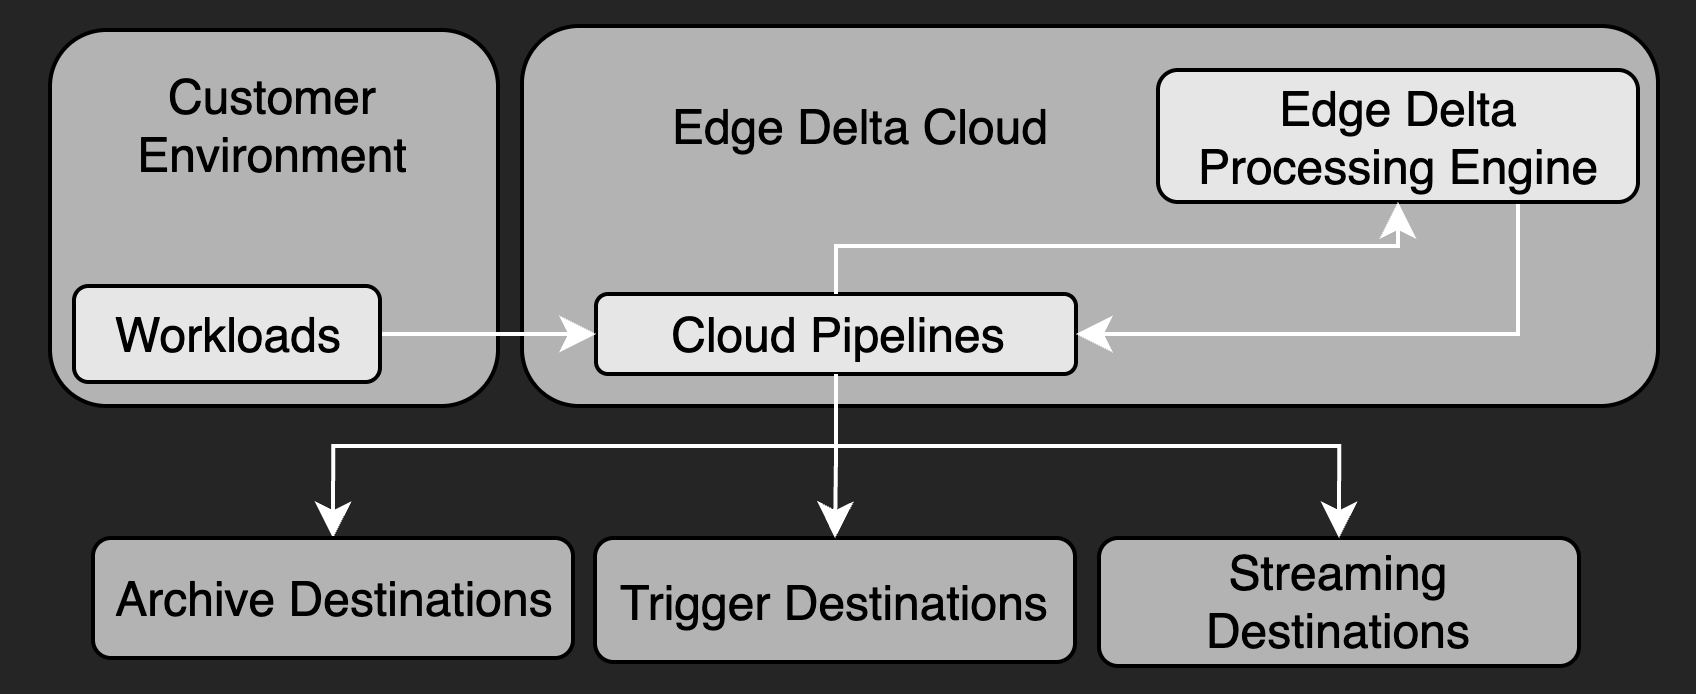
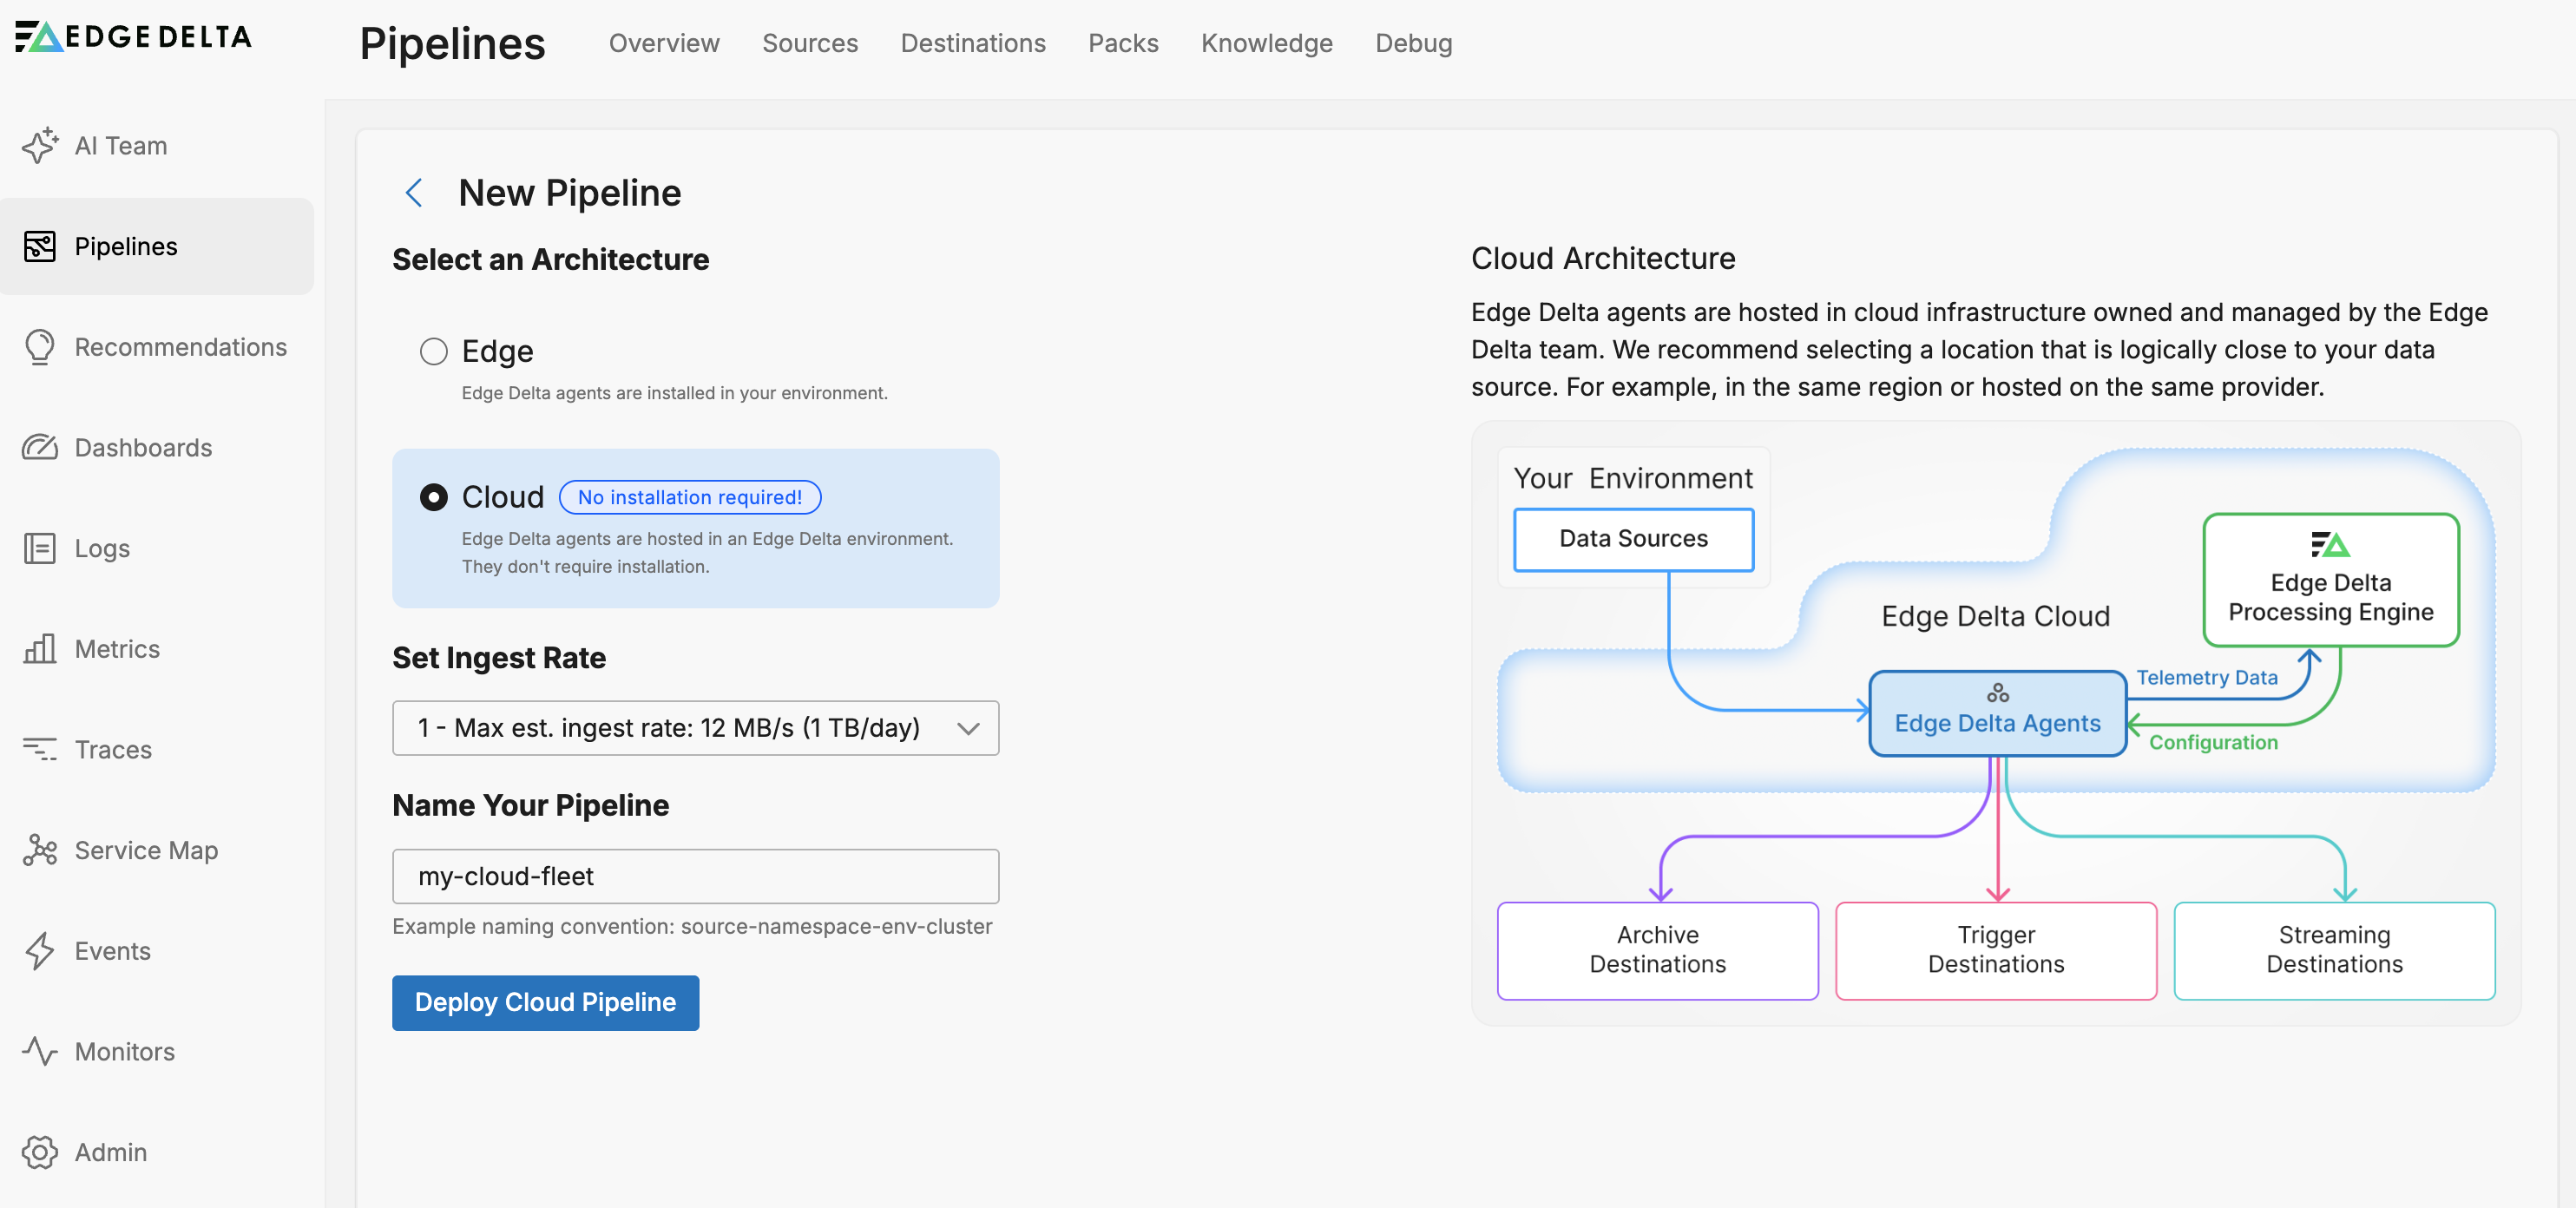
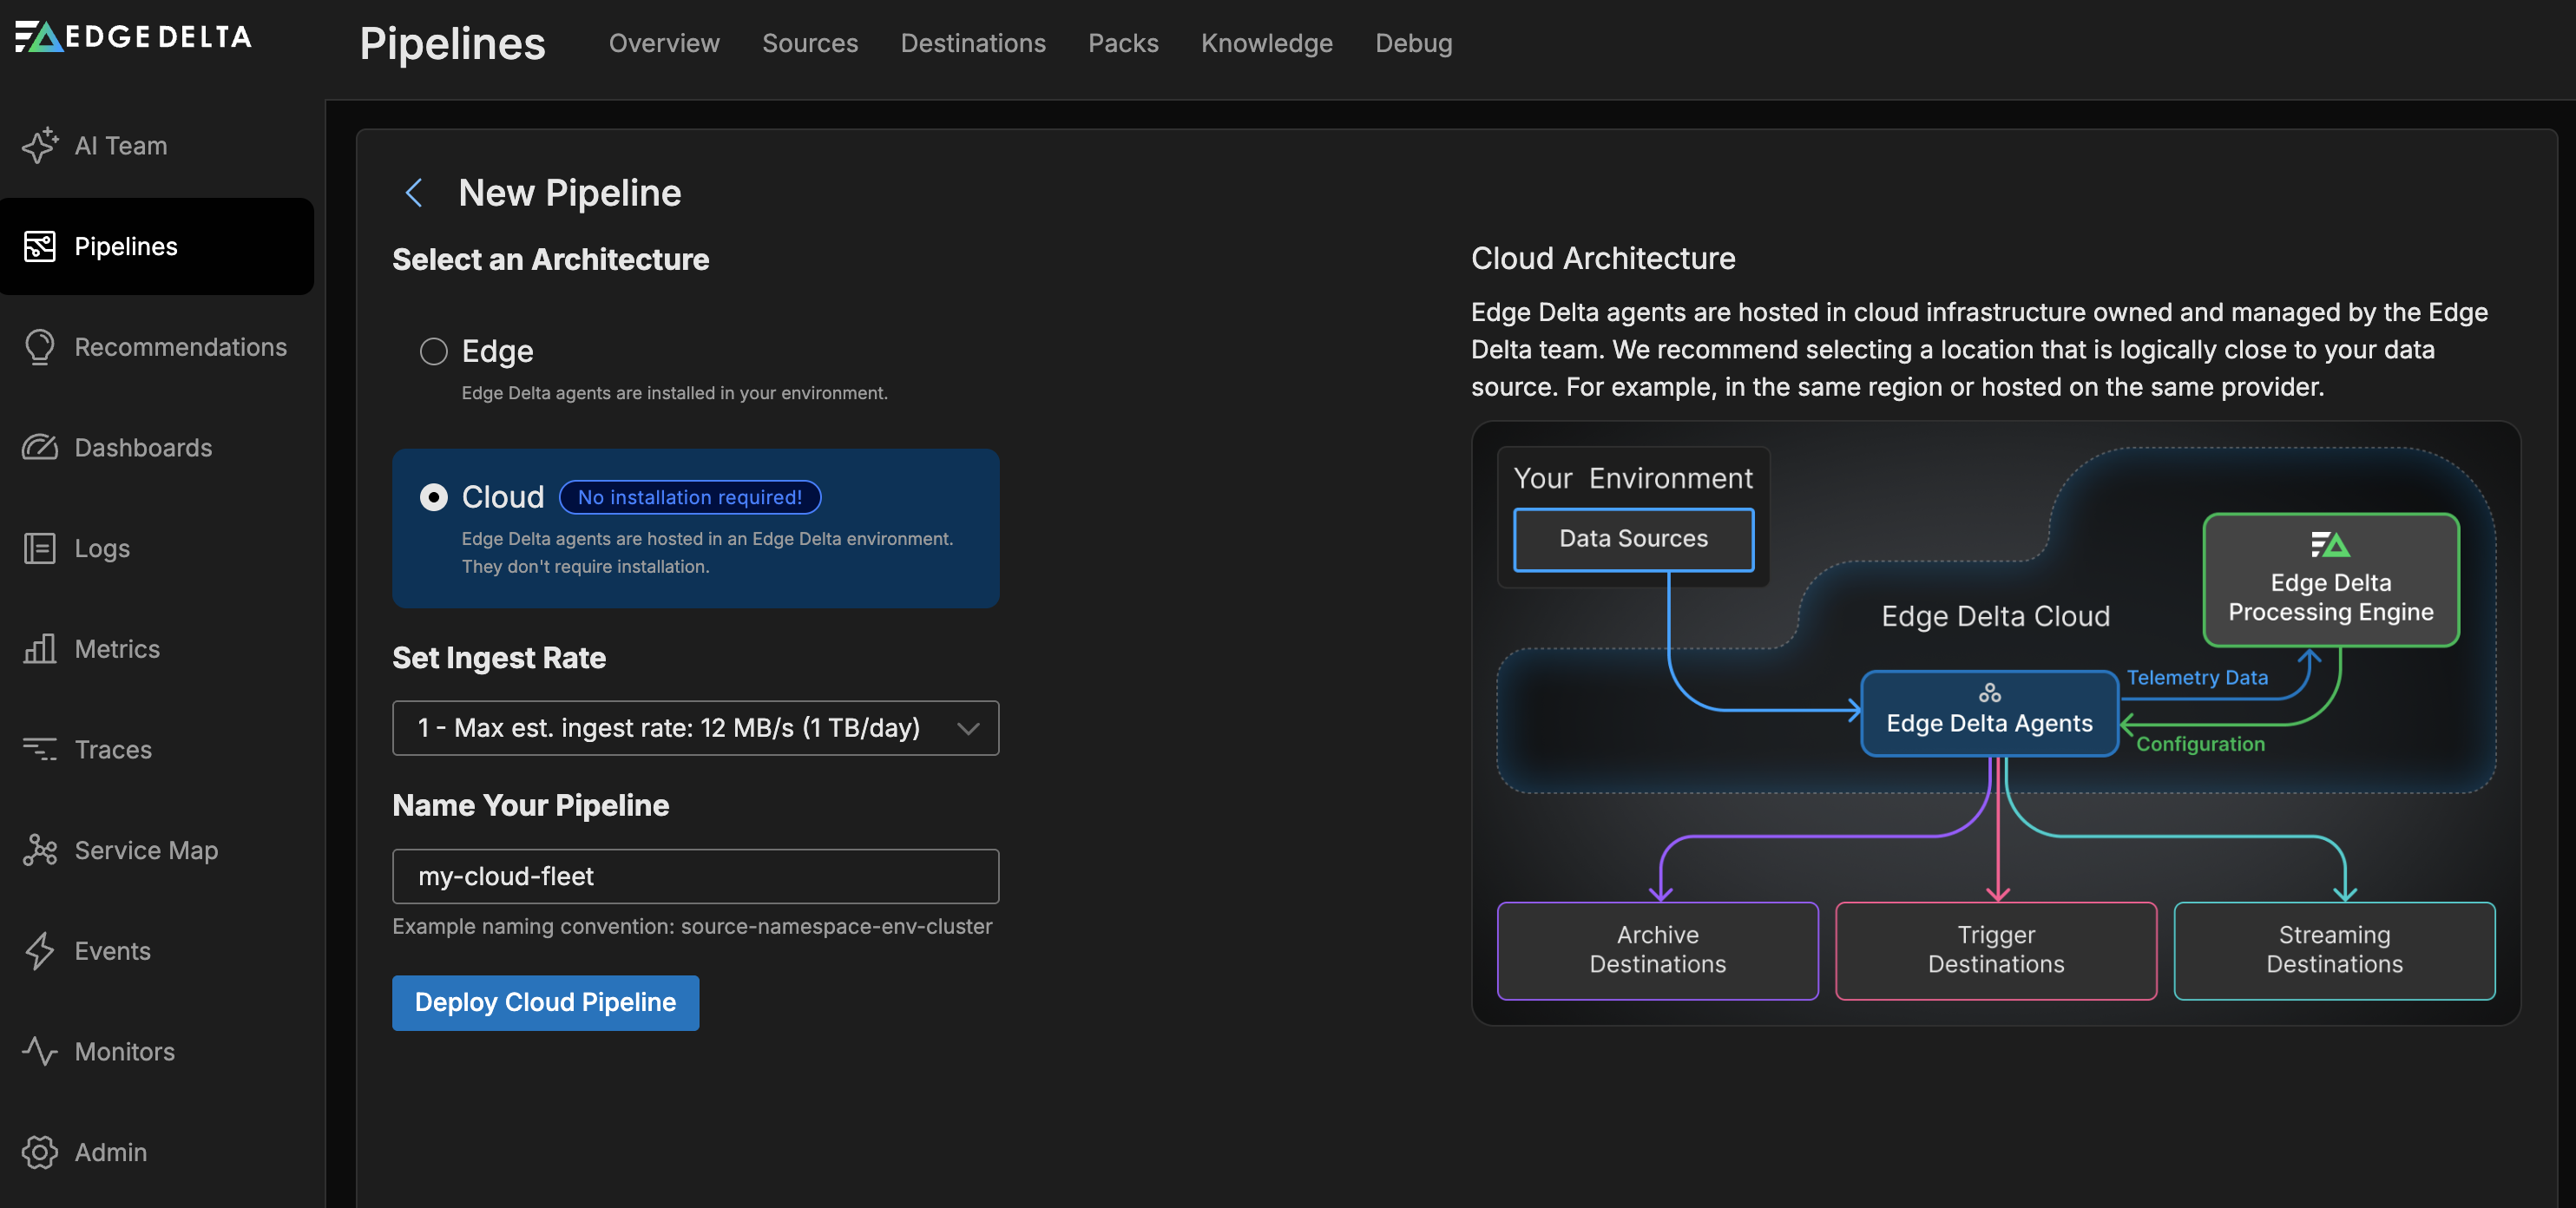
Cloud pipelines are Edge Delta agents that are hosted in cloud infrastructure owned and managed by the Edge Delta team.
See Third Party Agents or Agentless integrations.
You might decide to use Cloud pipelines in the following scenarios:
- data sources are serverless workloads such as AWS Lambda functions or events generated from Amazon Kinesis.
- lightweight edge environments host thin data producers, such as Internet of Things.
- you do not want to take on resource management associated with hosting an additional workload.
- security limitations exist for deploying a pipeline in your environment.
- you need to validate instrumentation or run demos without infrastructure setup.
For high-volume production workloads where you want to filter, aggregate, or sample data before transmission, consider using an Edge Pipeline instead. Edge Pipelines process data locally, which can reduce egress volume and network latency.
You can create, configure, and remove pipeline configurations using the Edge Delta interface. The Cloud pipelines expose an HTTP, HTTPS, or GRPCS endpoint so you can push data to it.
Push or Pull Data Inputs
Cloud pipelines cater for both push or pull data input integrations. To push data to the Cloud pipeline configure your sources such as an OTEL collector, a CDN or Amazon Kinesis to push data to the pipeline endpoint. To pull data into the Cloud pipeline, add a source node such as HTTP pull configured with your data source’s endpoint to the Cloud pipeline’s configuration.
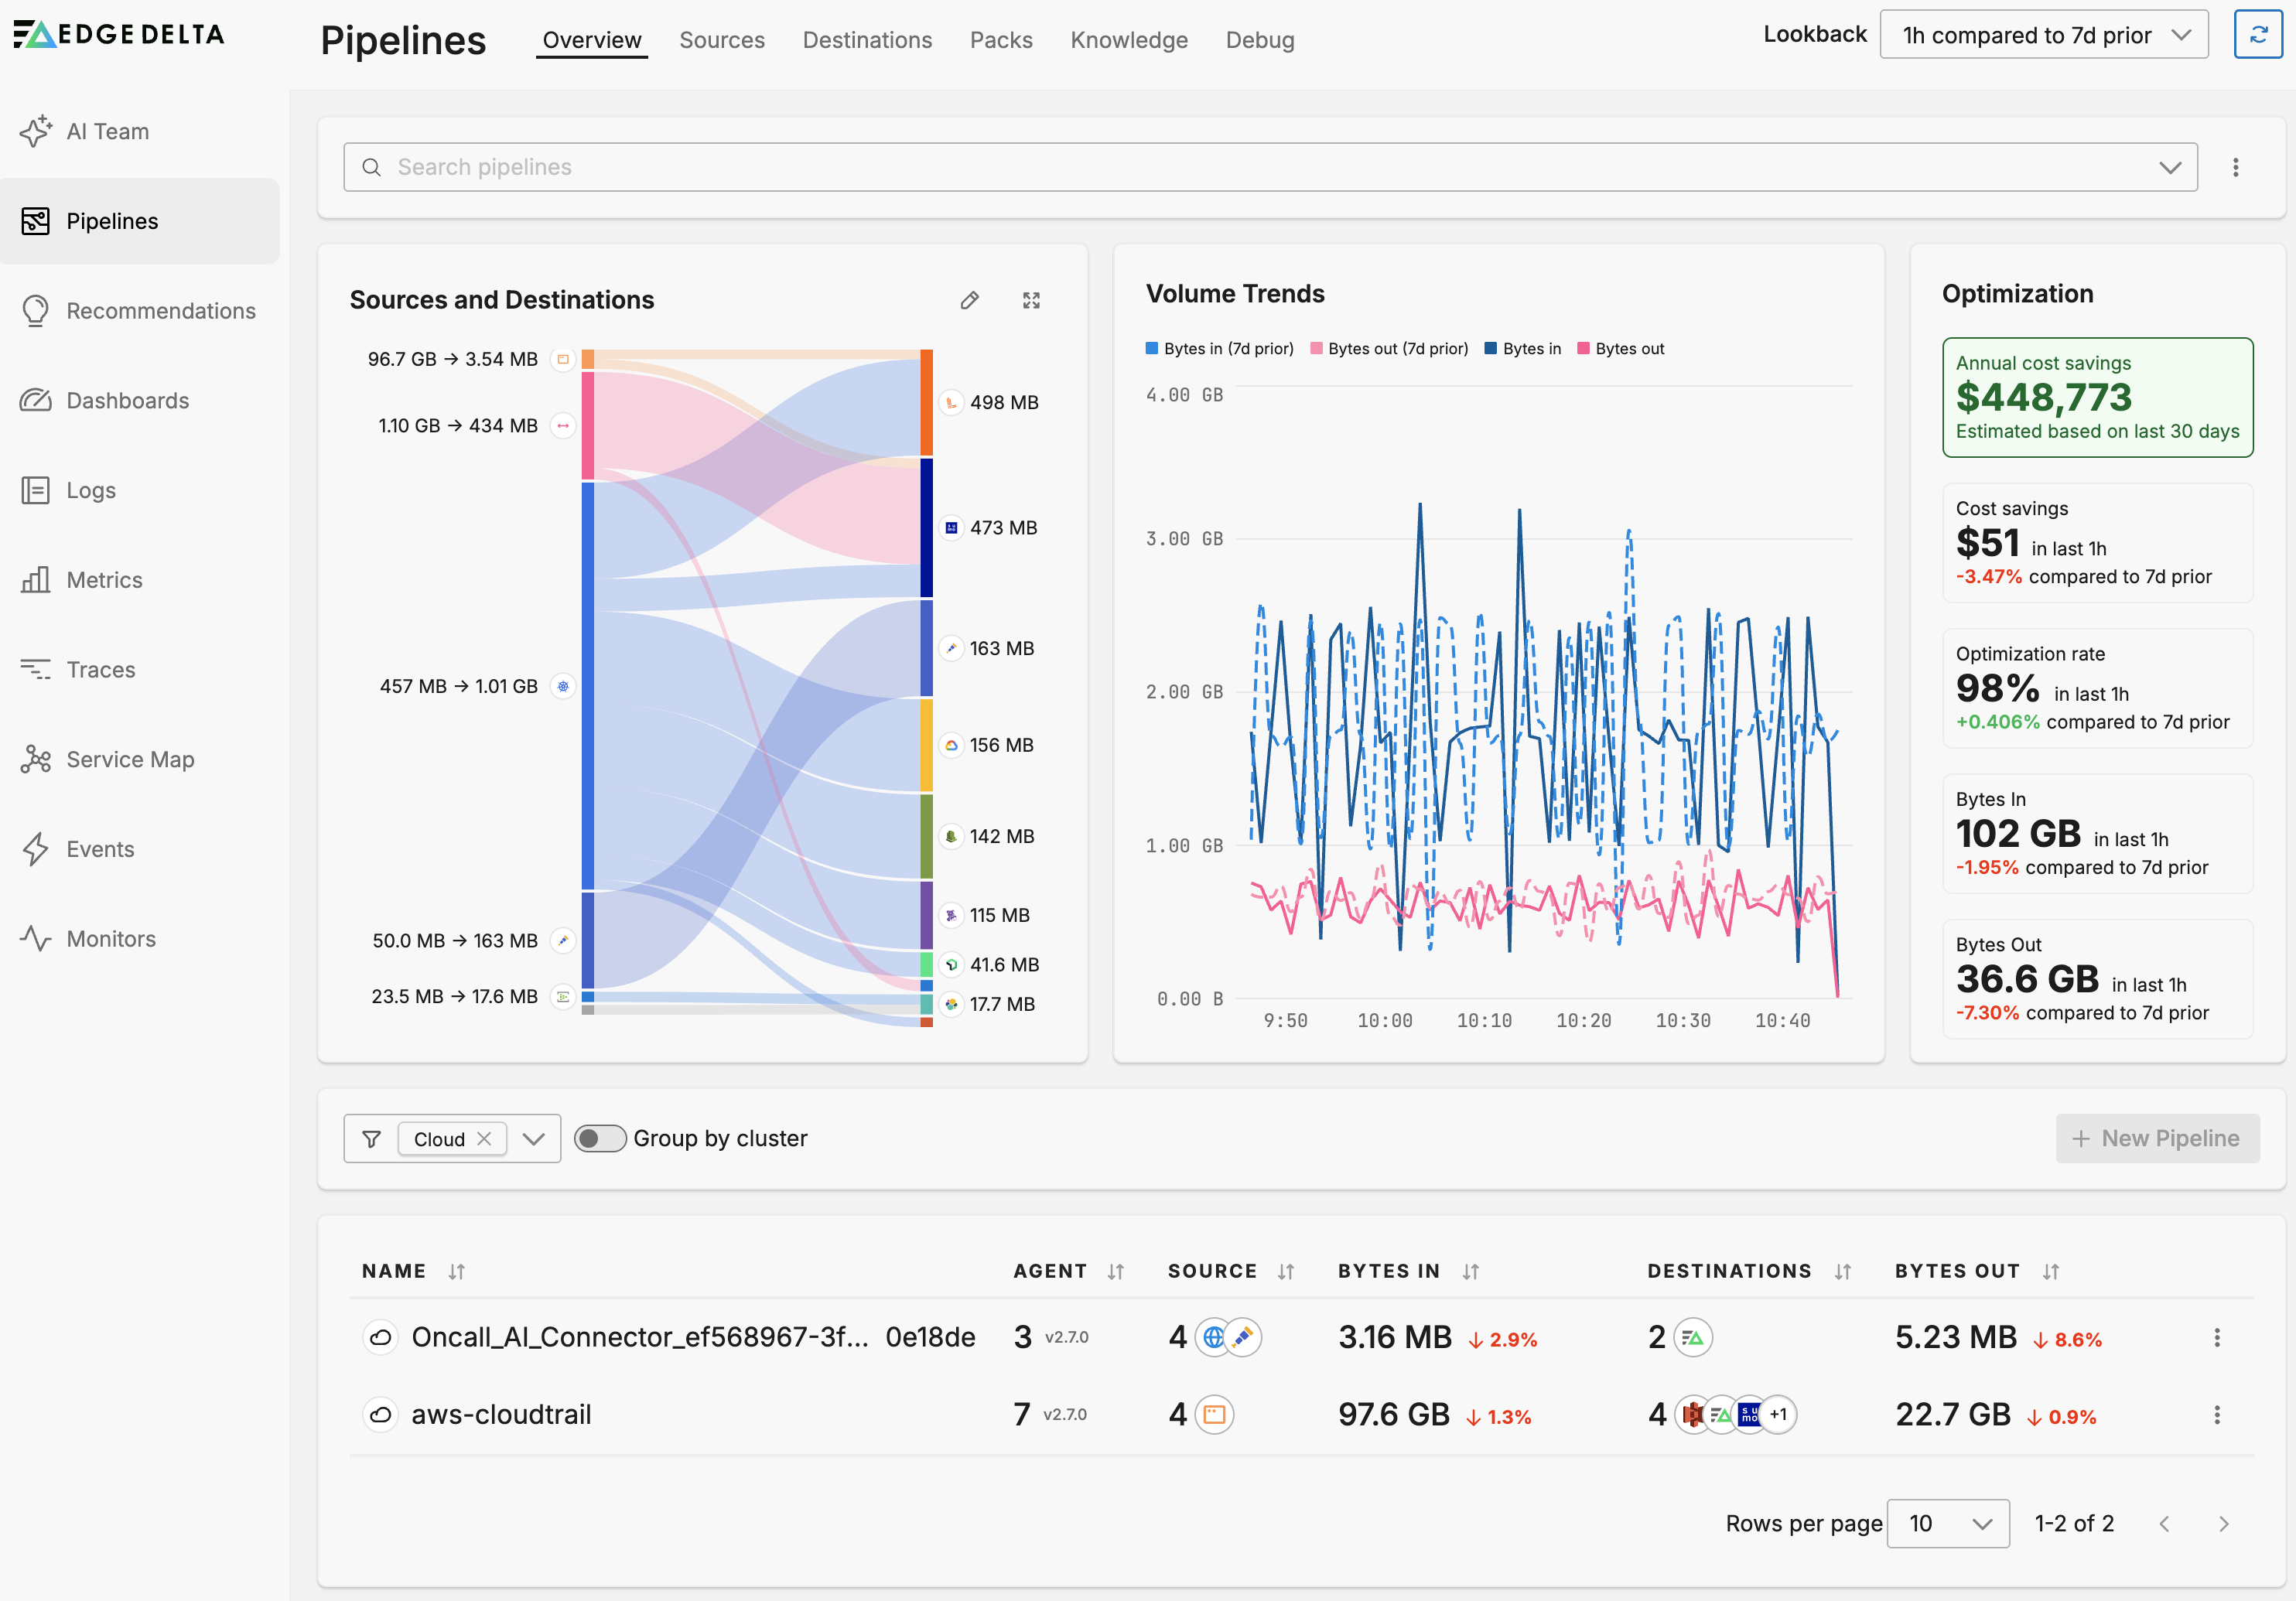
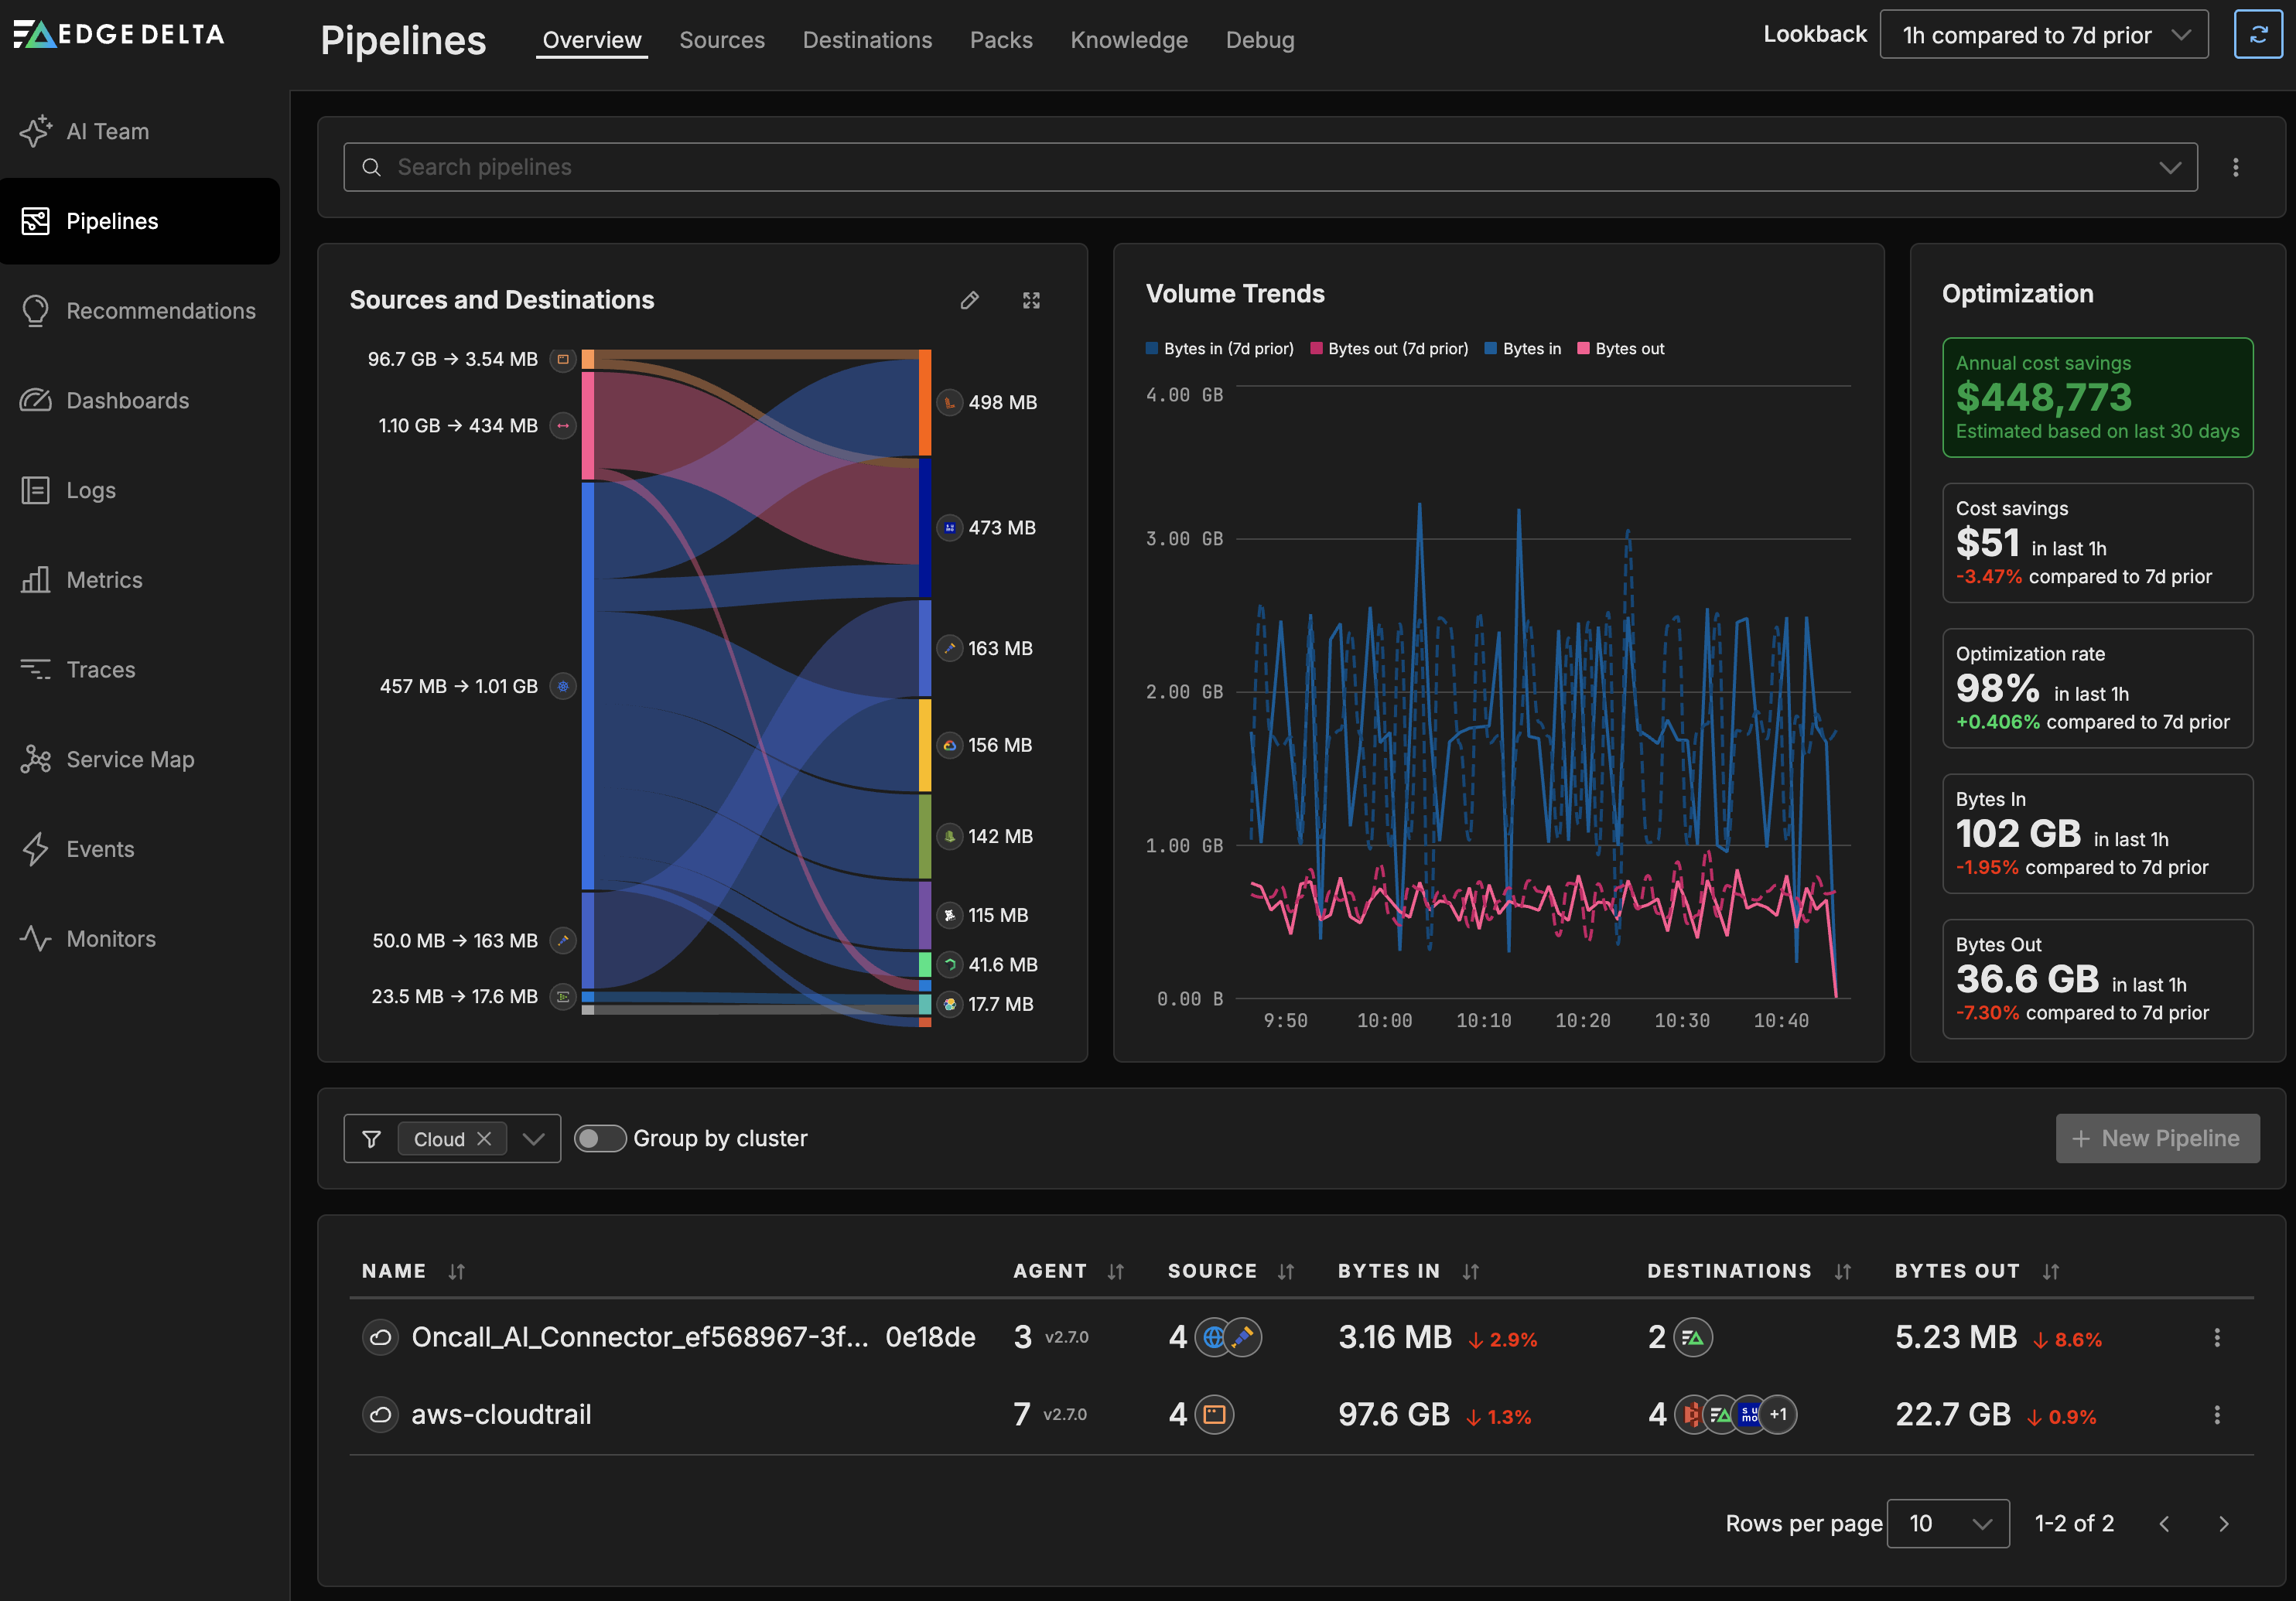
Managing a Cloud Pipeline
Click Pipelines and select Cloud from the filter by filter.
Creating a Cloud Pipeline
- Click Pipelines.
- Click New Pipeline.
- Select Cloud
- Specify a name to identify the pipeline.
- Select Compute Units based on your estimated traffic volume. This is the maximum bandwidth the agent can handle before signalling an error. The number of compute units used per hour counts towards your plan usage.
- Click Deploy Cloud Pipeline.
The new Cloud pipeline is added to the pipelines table.
Compute Units
You can change a Cloud pipeline’s resource capability setting known as compute units. This is the maximum bandwidth the agent can handle before signalling an error.
Bear in mind the number of compute units you use per hour contribute to your plan usage in the form of compute units allocated per day. For example, running one Cloud pipeline with one compute unit (a maximum of 12MB per second or 1TB per day), and another Cloud pipeline with three compute units (36MB per second or 3TB per day) will result in a daily usage of 4 compute units. In addition, data flowing from your workloads to your Cloud pipelines will contribute to your Cloud Ingress plan allocation.
Edit Cloud Pipeline Settings
- Select the cloud pipeline on the Pipelines page.
- Select Settings.
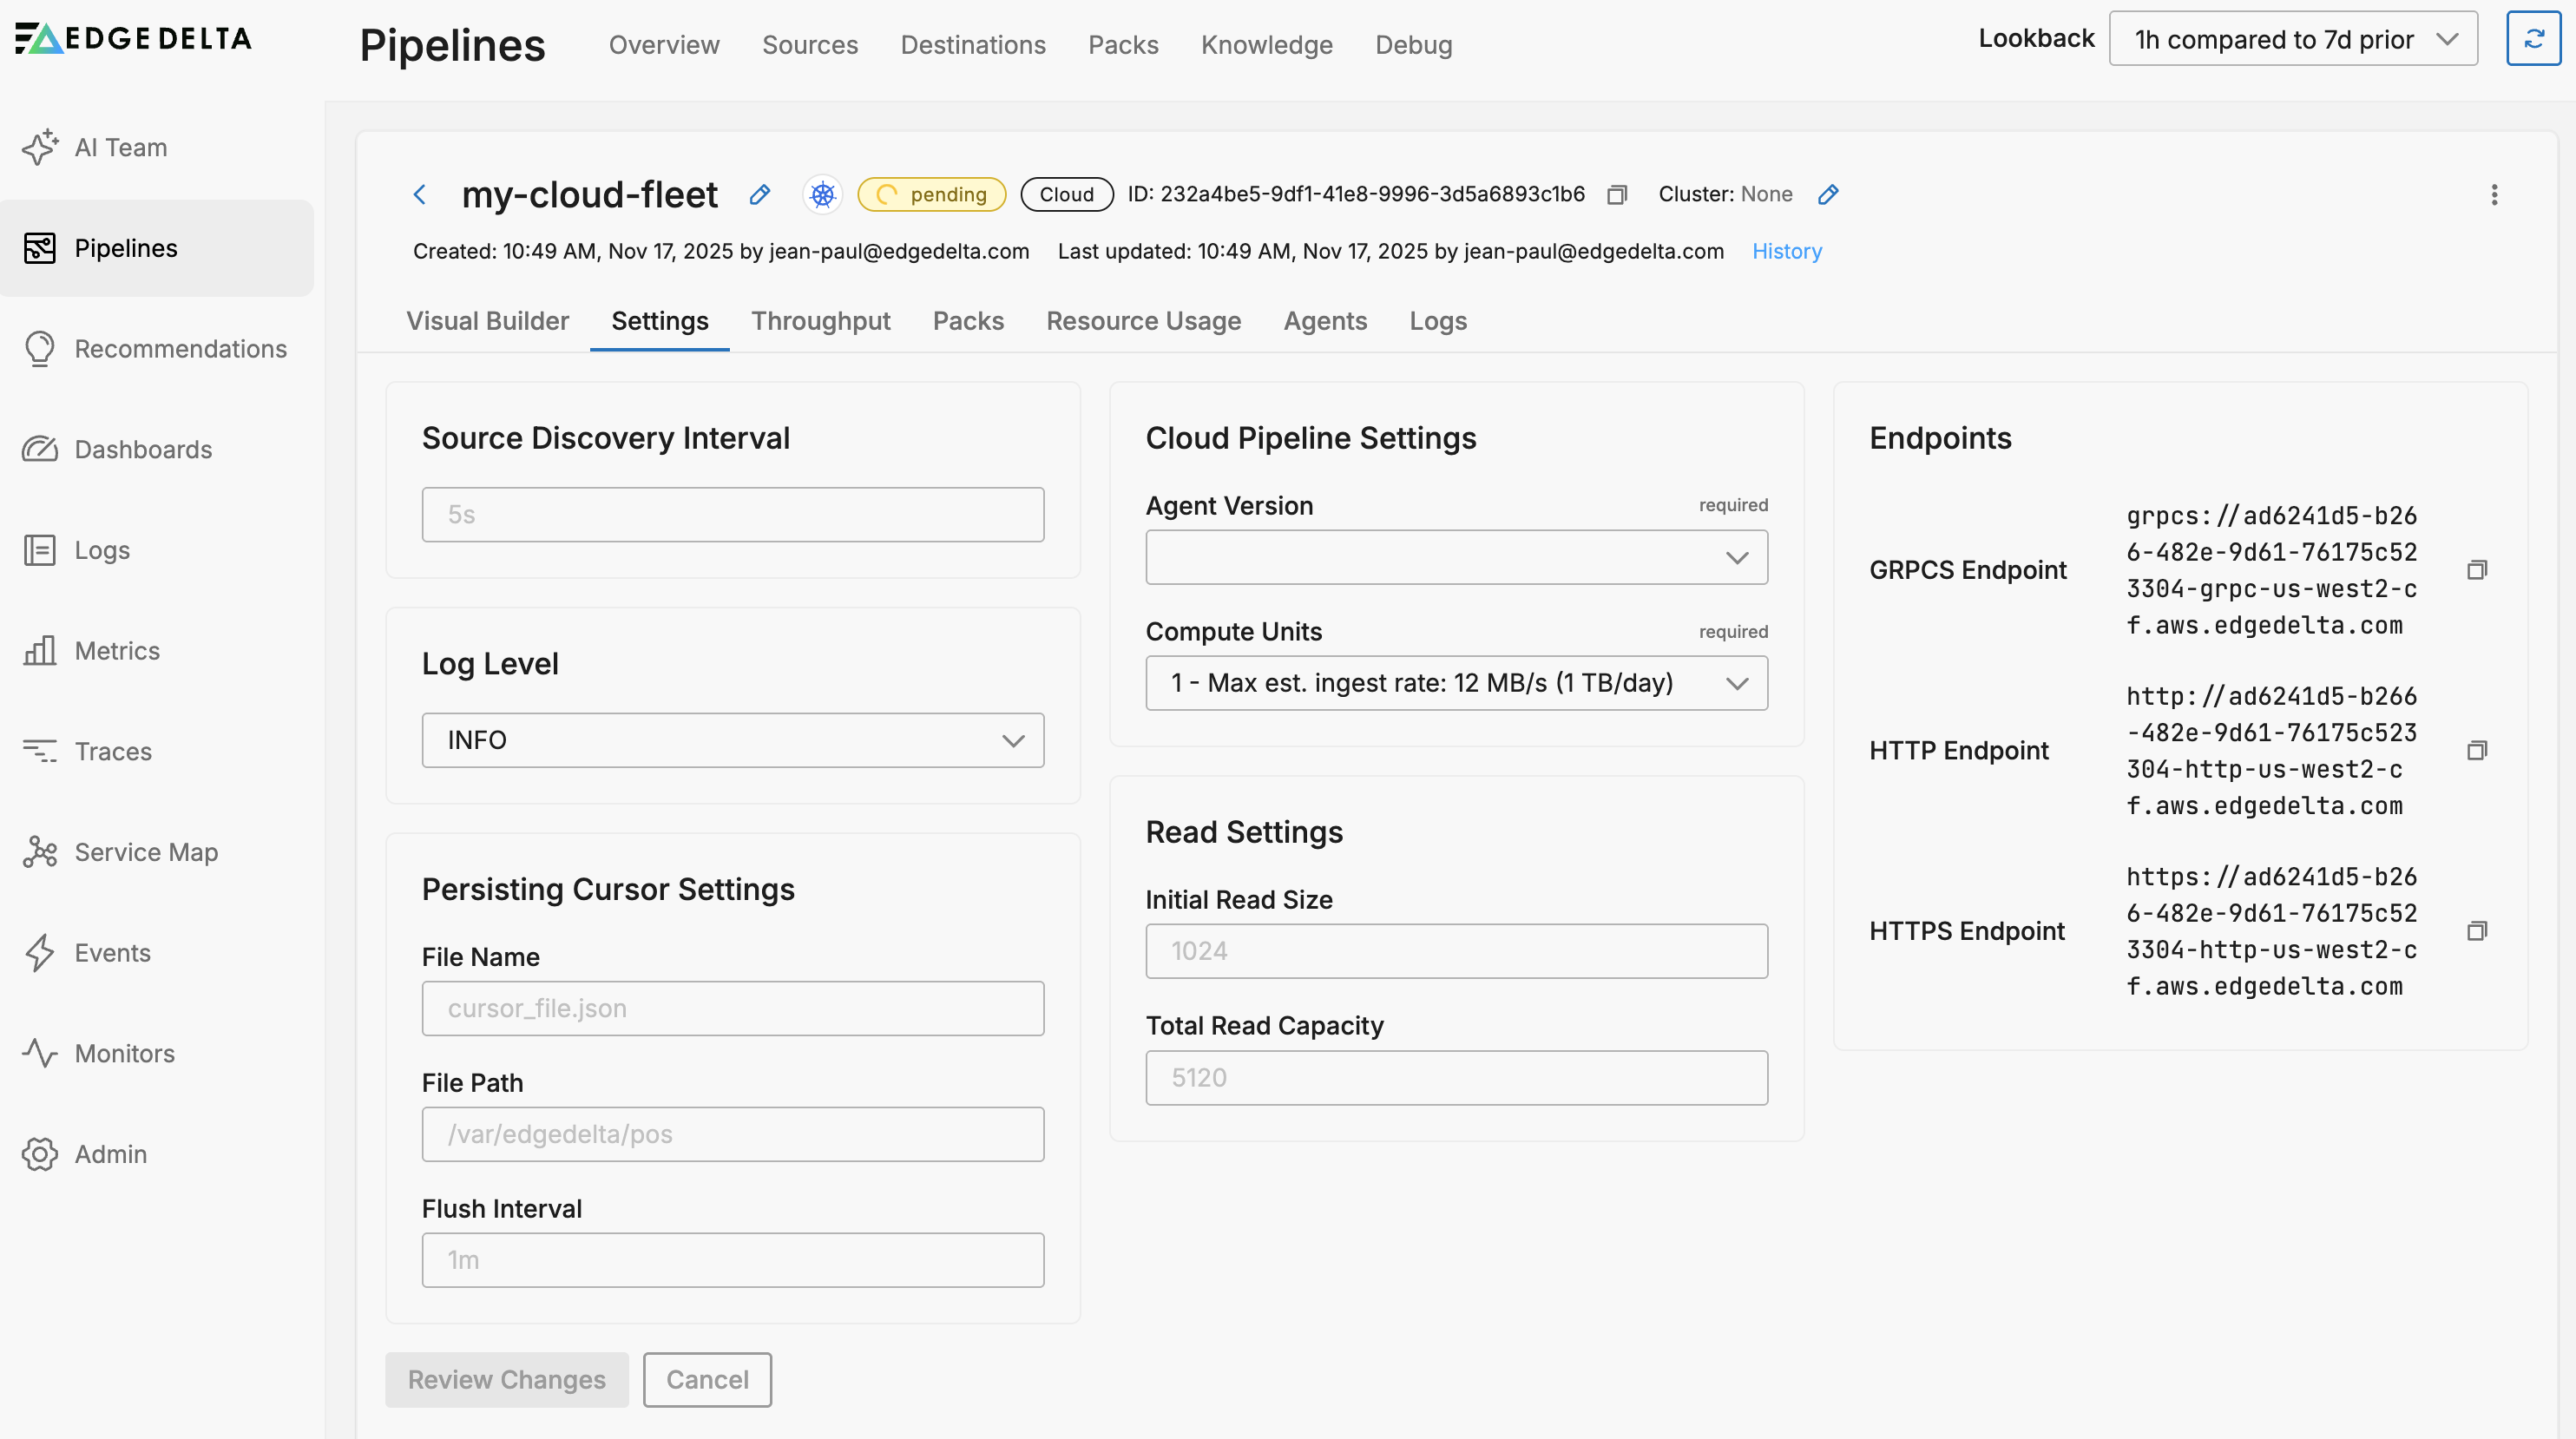
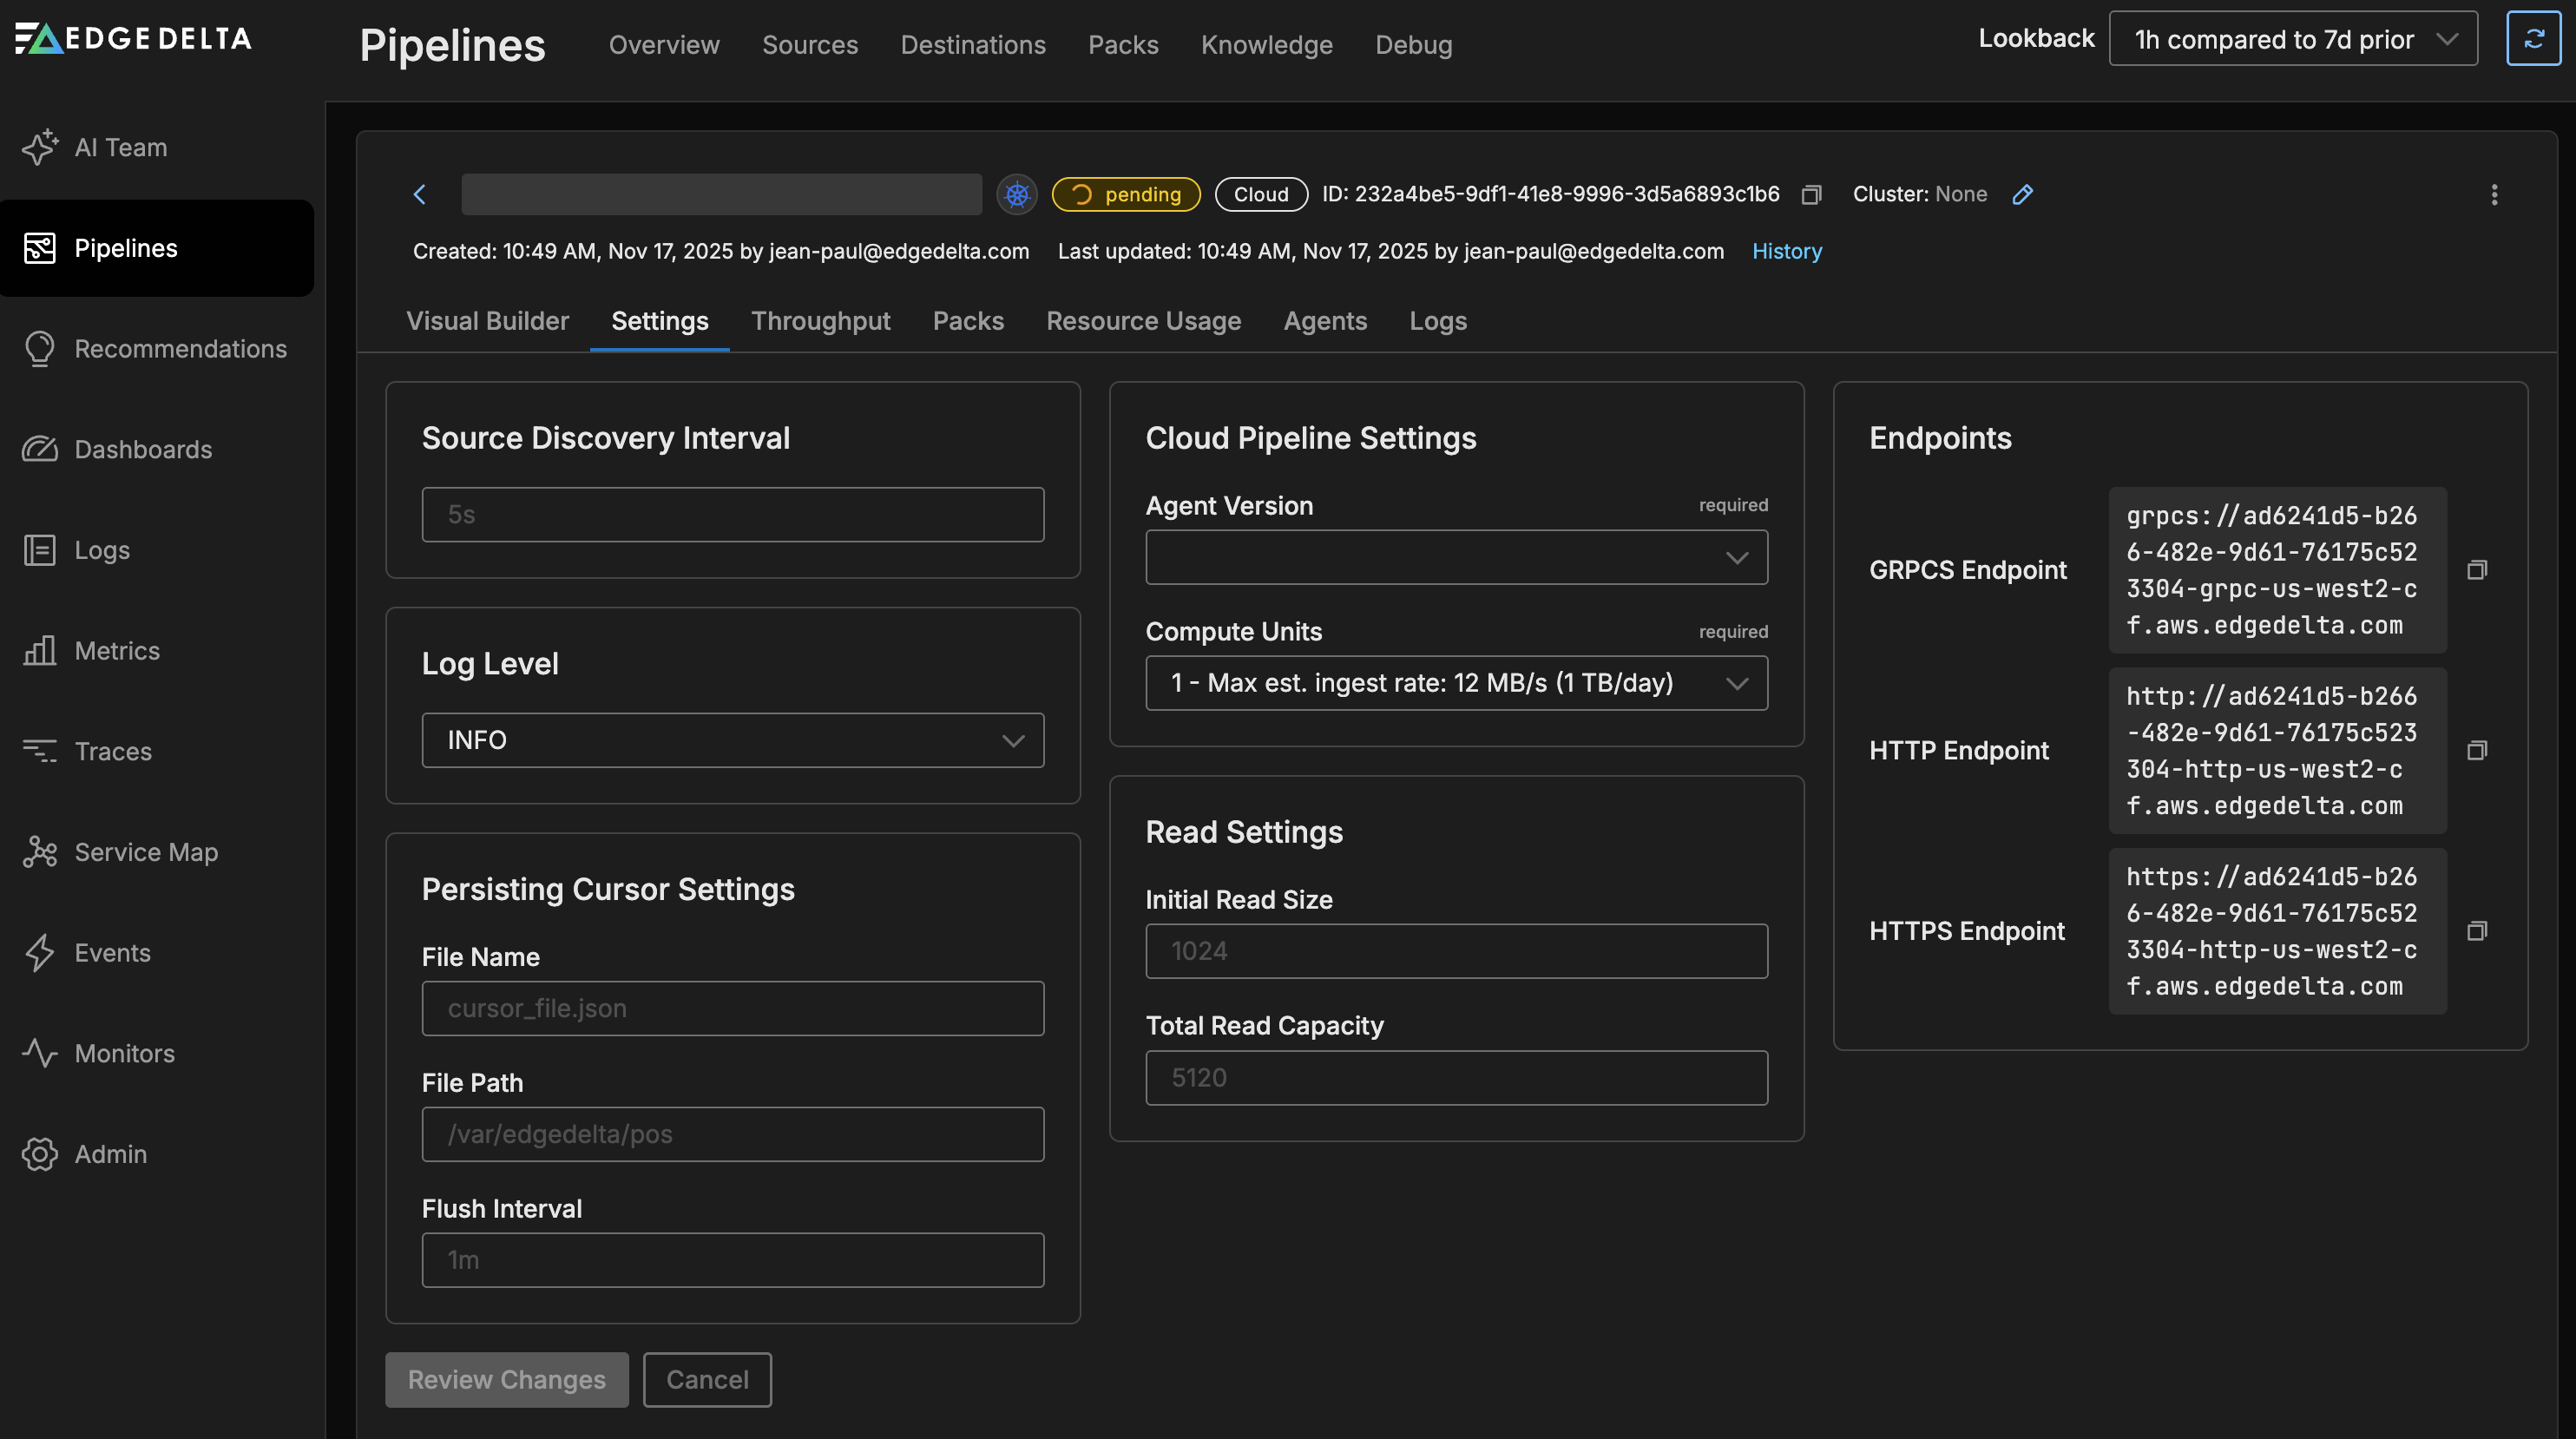
The Cloud Pipeline Settings tab displays the following configuration options:
General Settings:
- Source Discovery Interval: How frequently the pipeline discovers new data sources (default: 5s)
- Log Level: Controls the verbosity of pipeline logging (e.g., INFO, DEBUG, ERROR)
Persisting Cursor Settings:
- File Name: Name of the cursor file that tracks reading position (default: cursor_file.json)
- File Path: Directory where cursor files are stored (default: /var/edgedelta/pos)
- Flush Interval: How often cursor positions are saved to disk (default: 1m)
Cloud Pipeline Settings:
- Agent Version: The Edge Delta agent version to use. Lists the most recent stable versions and candidate versions (containing rc). Choose the latest stable version. If this configuration doesn’t work, contact Edge Delta support to experiment with the candidate.
- Compute Units: Resource allocation for the pipeline. Each unit supports approximately 12 MB/s (1 TB/day) maximum ingestion rate
Read Settings:
- Initial Read Size: Initial buffer size for reading data (default: 1024)
- Total Read Capacity: Total read buffer capacity (default: 5120)
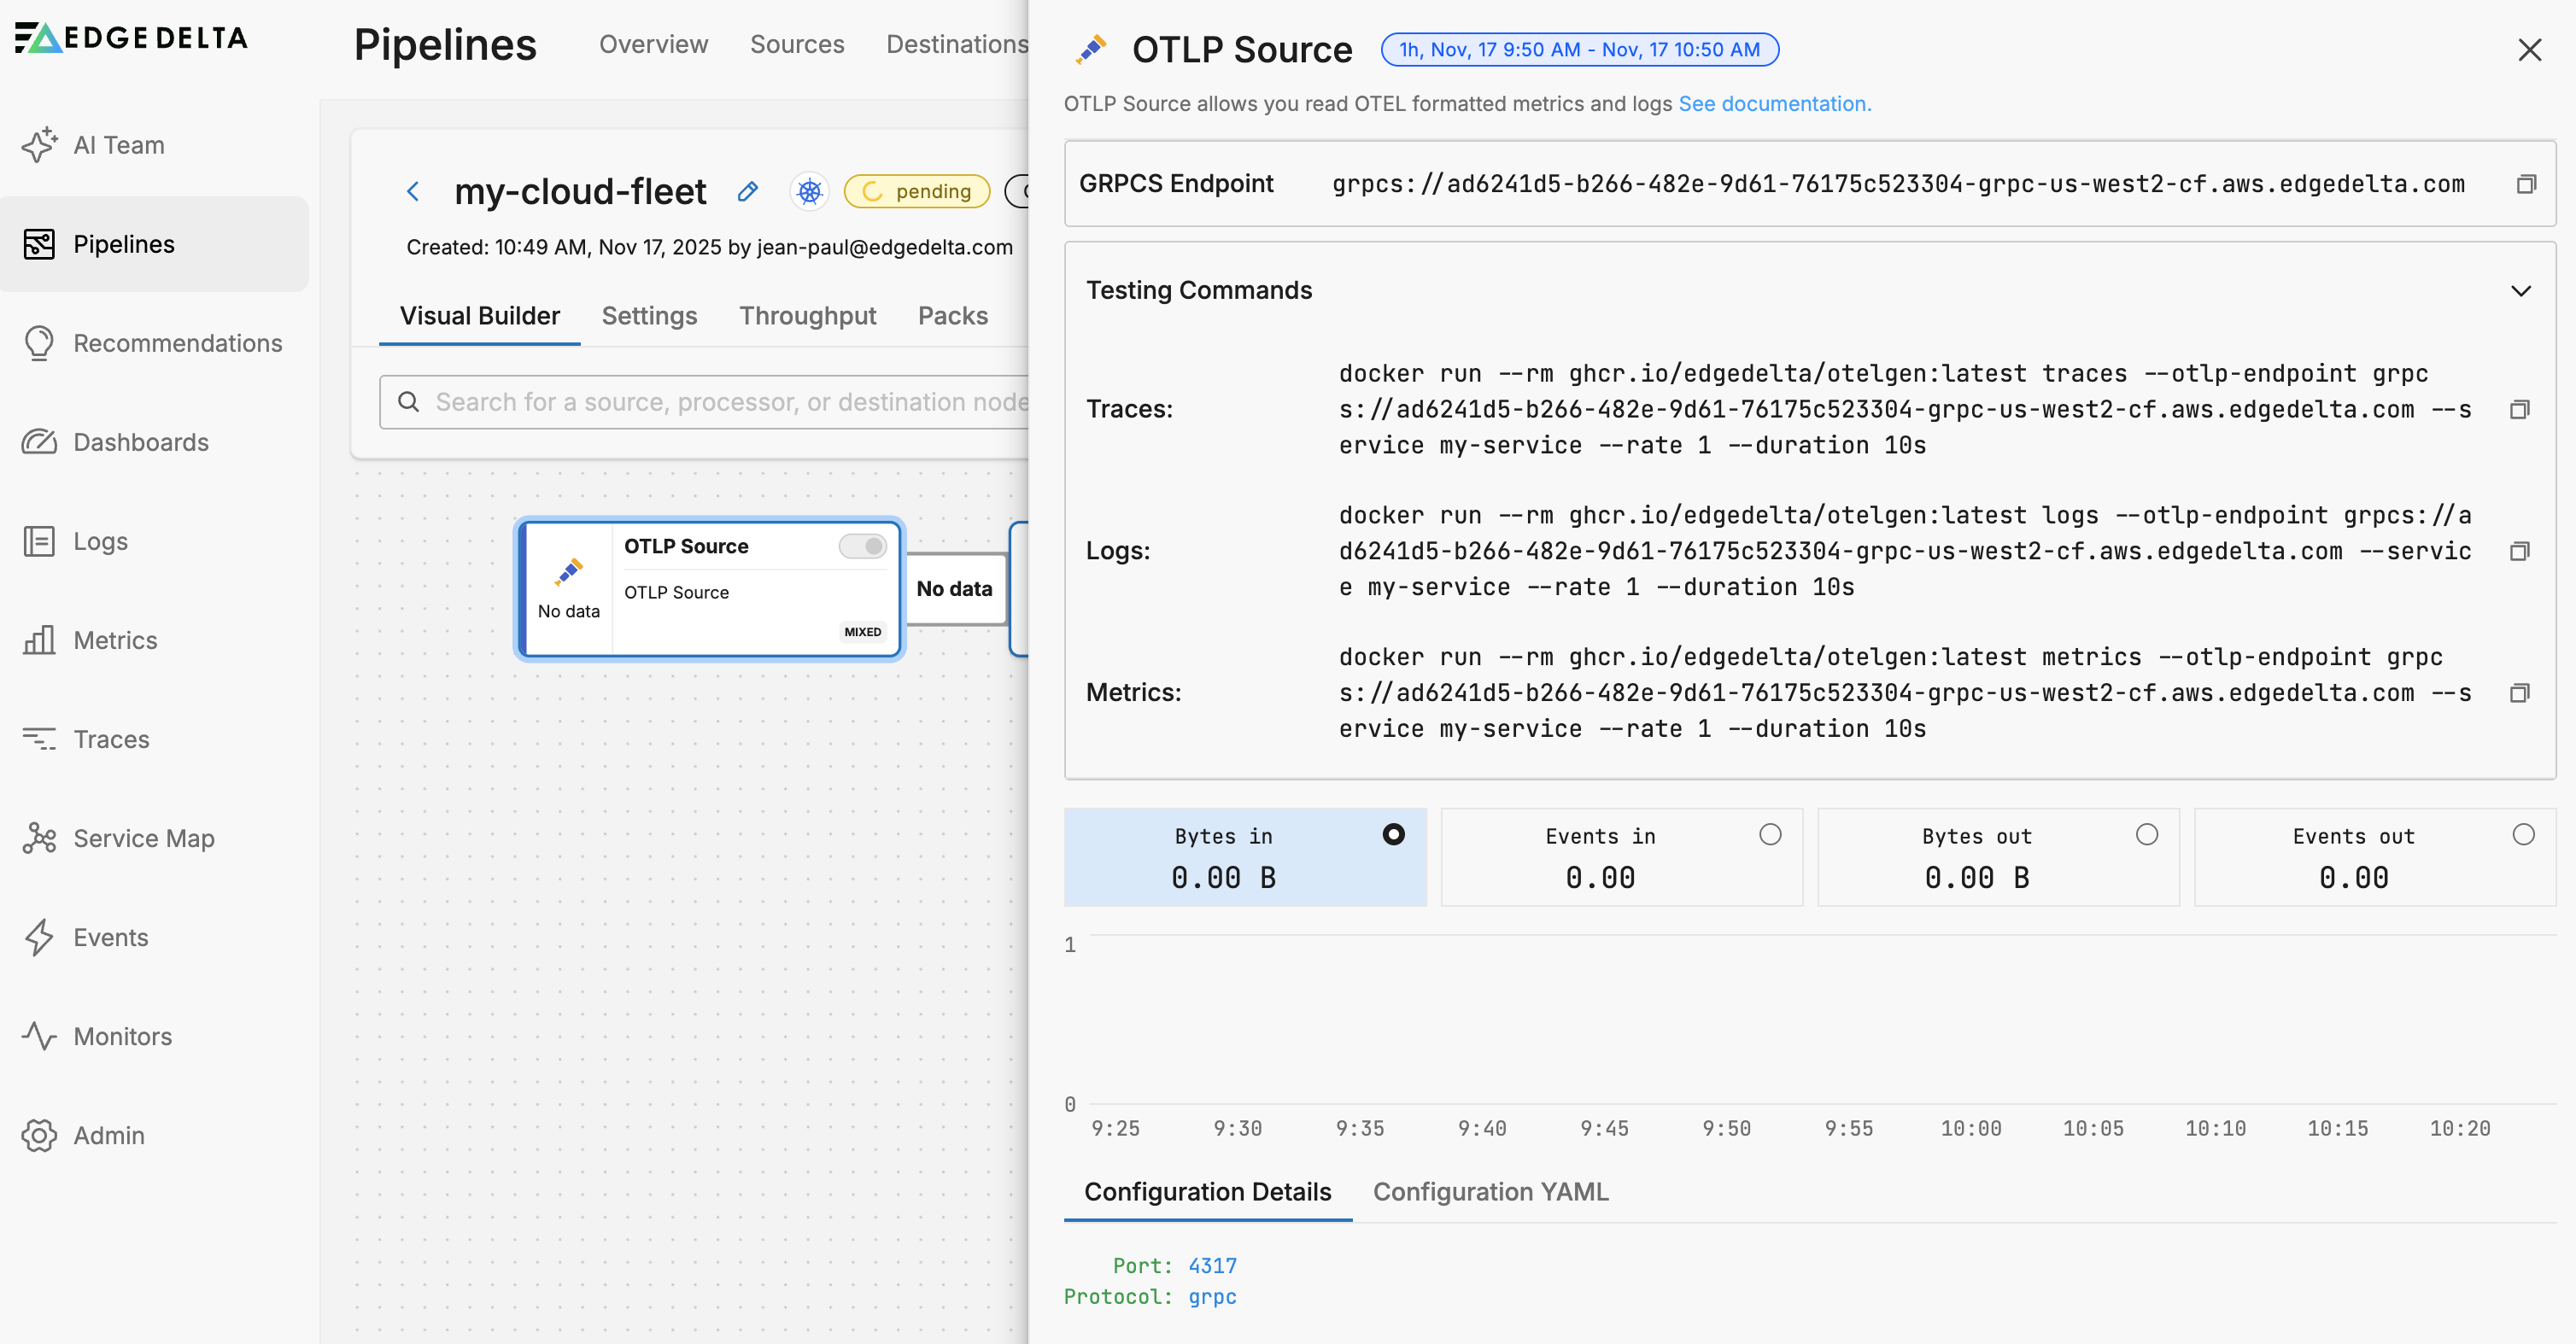
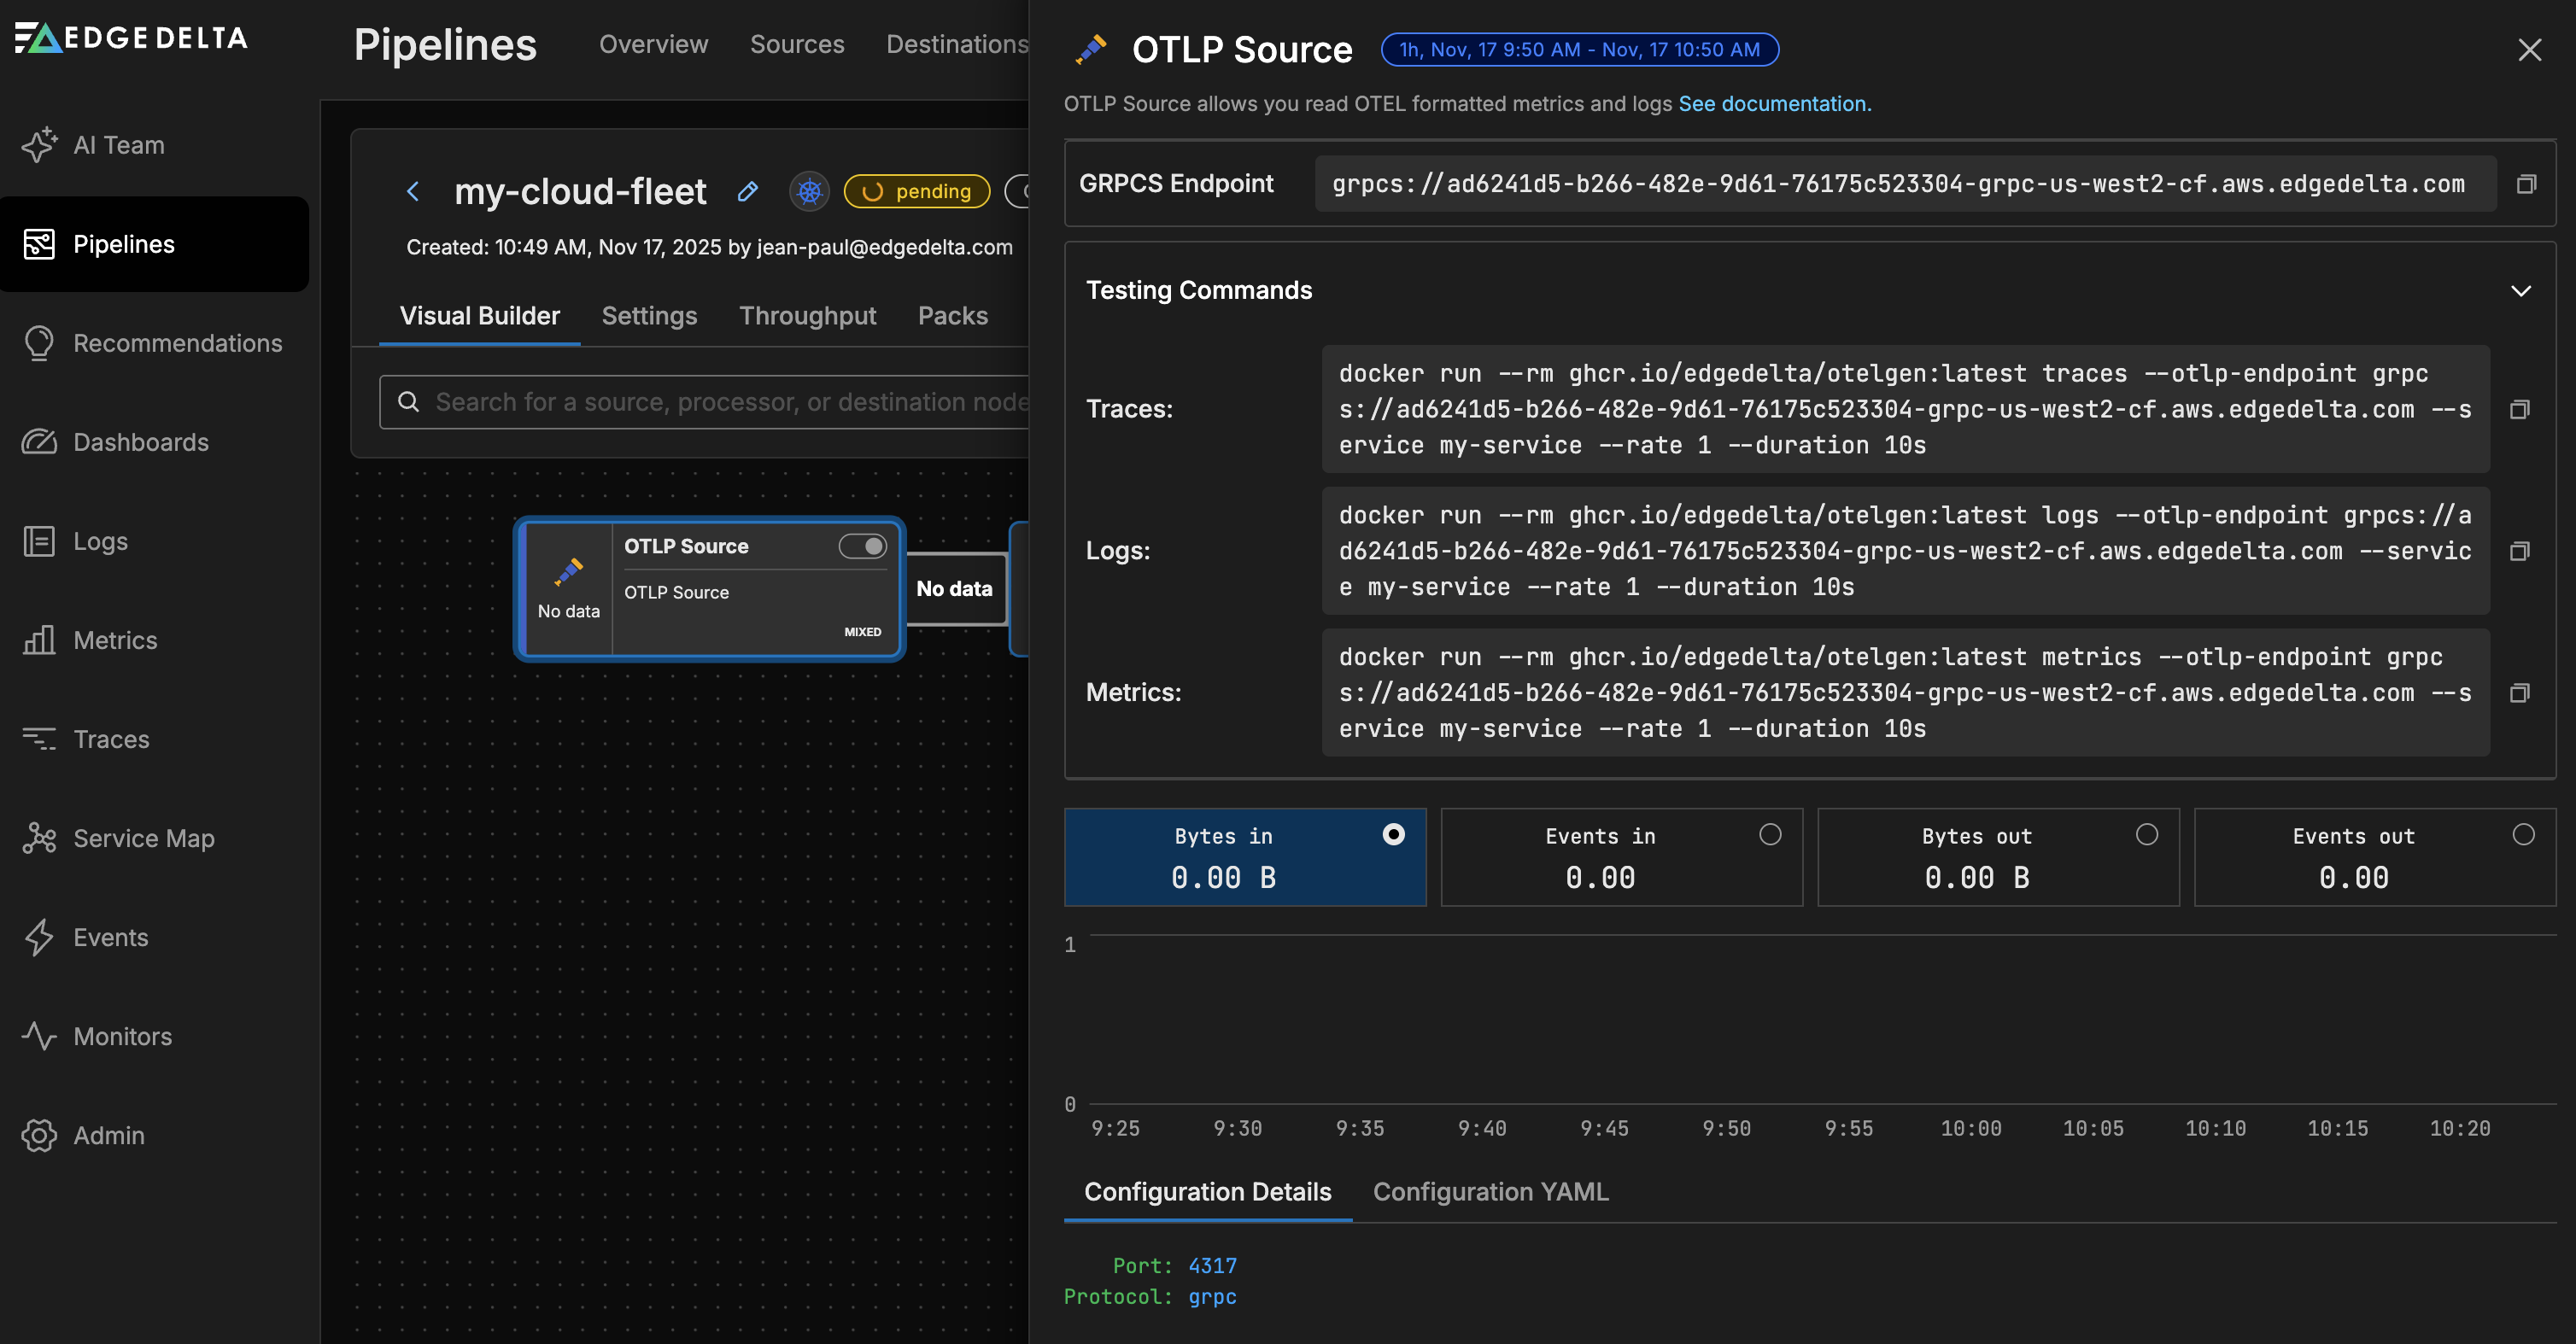
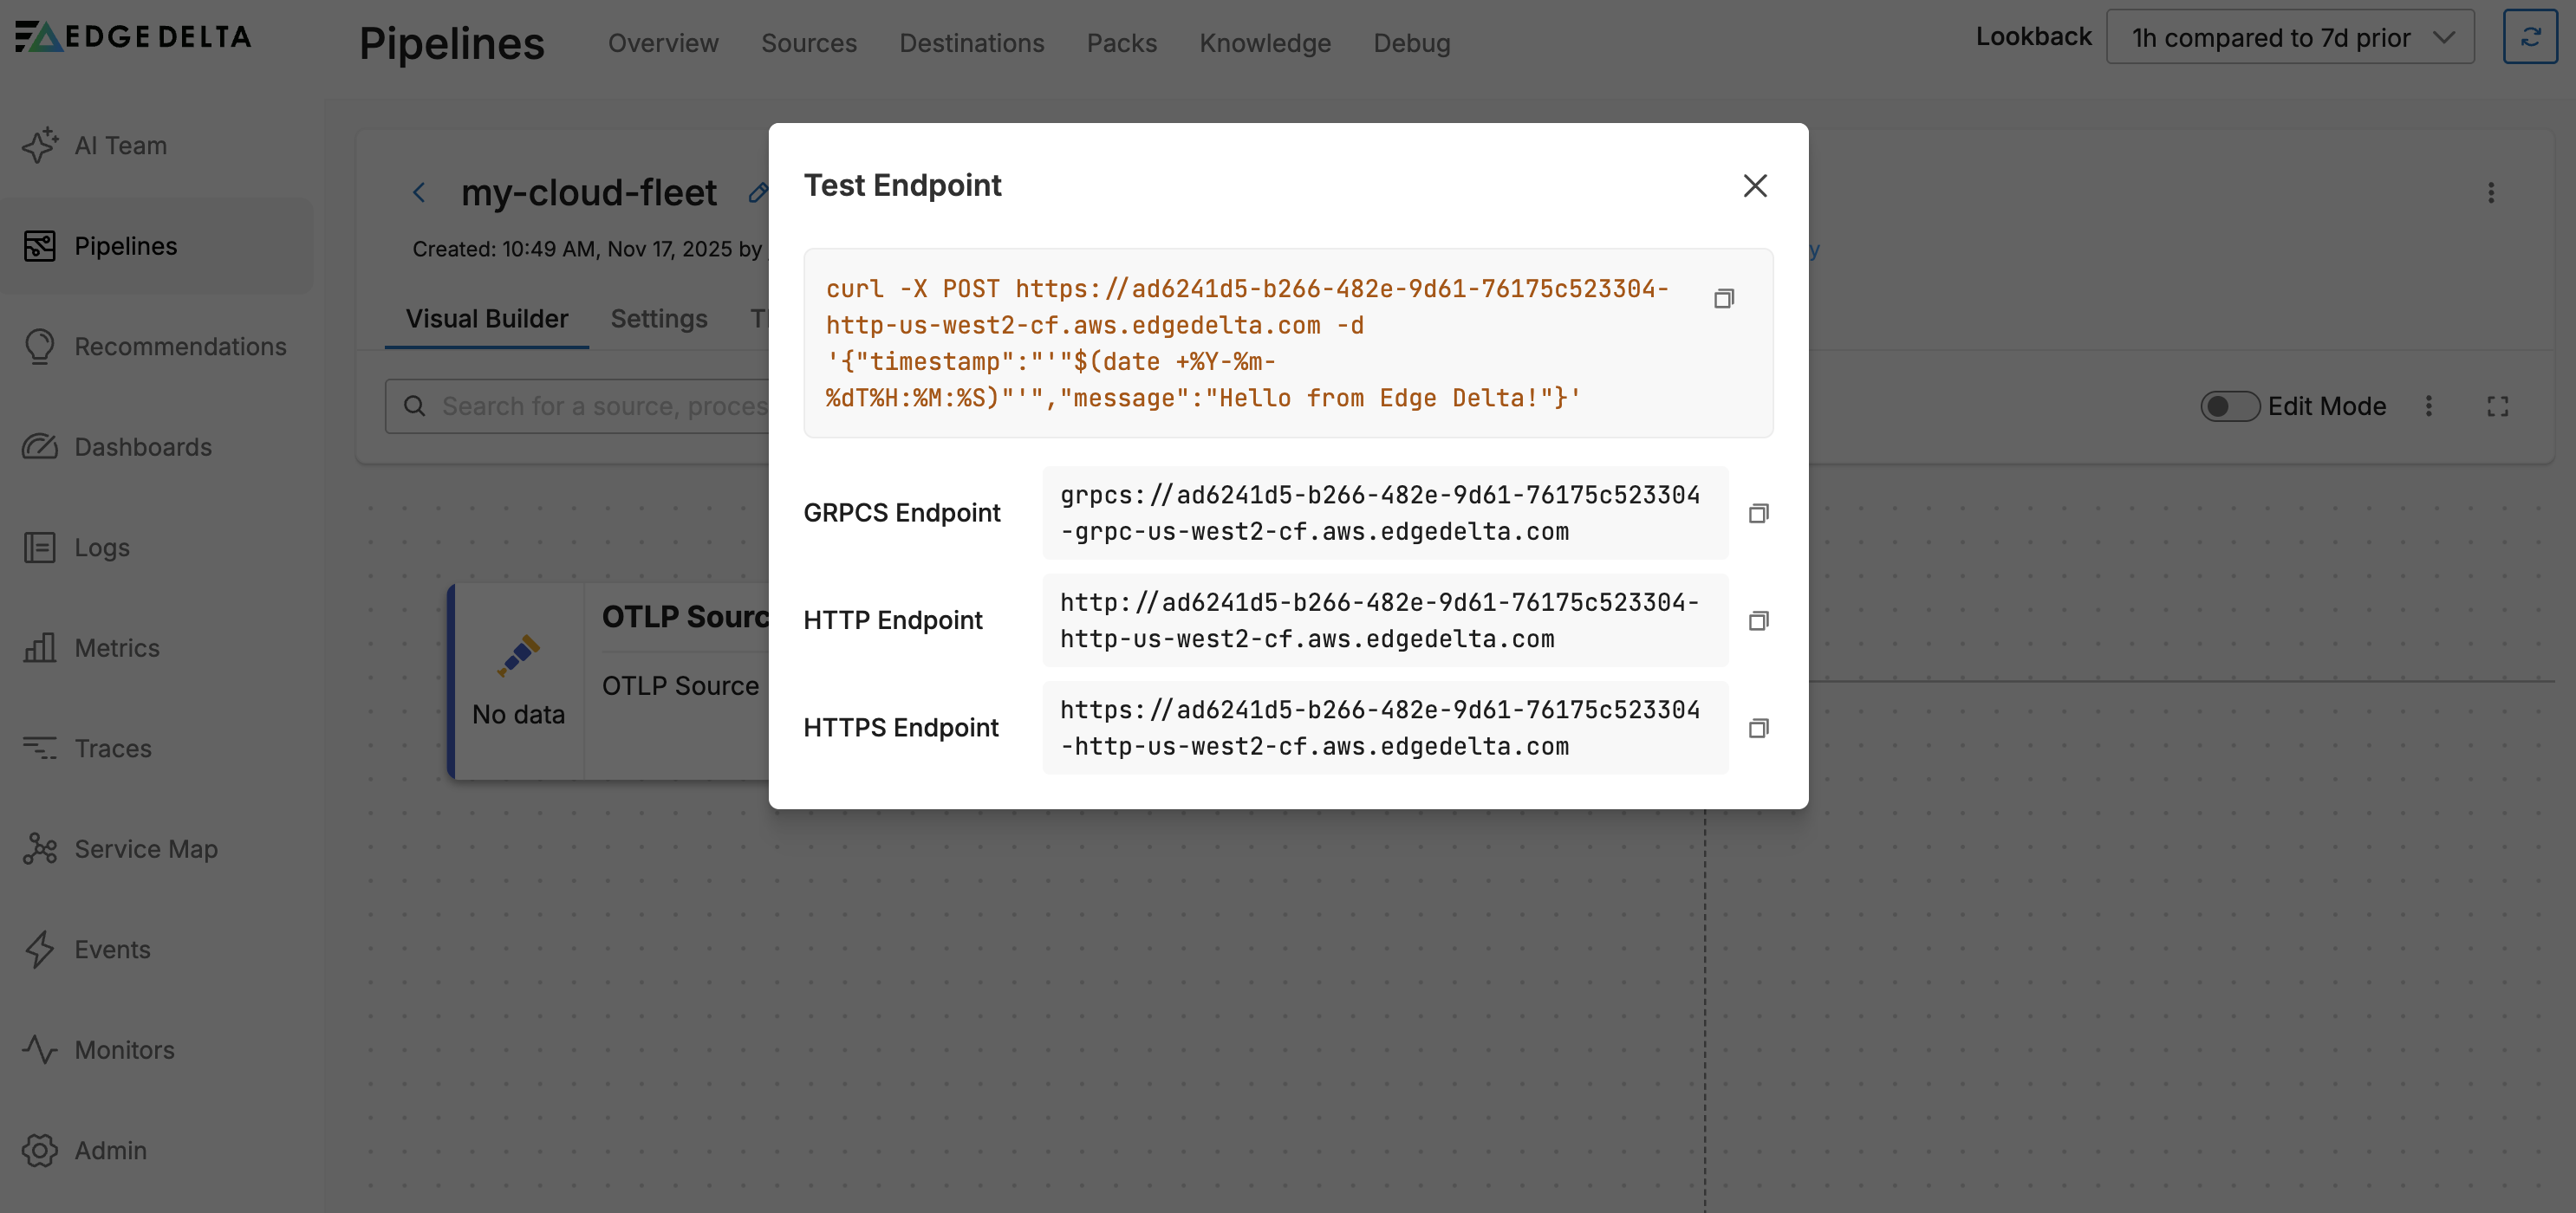
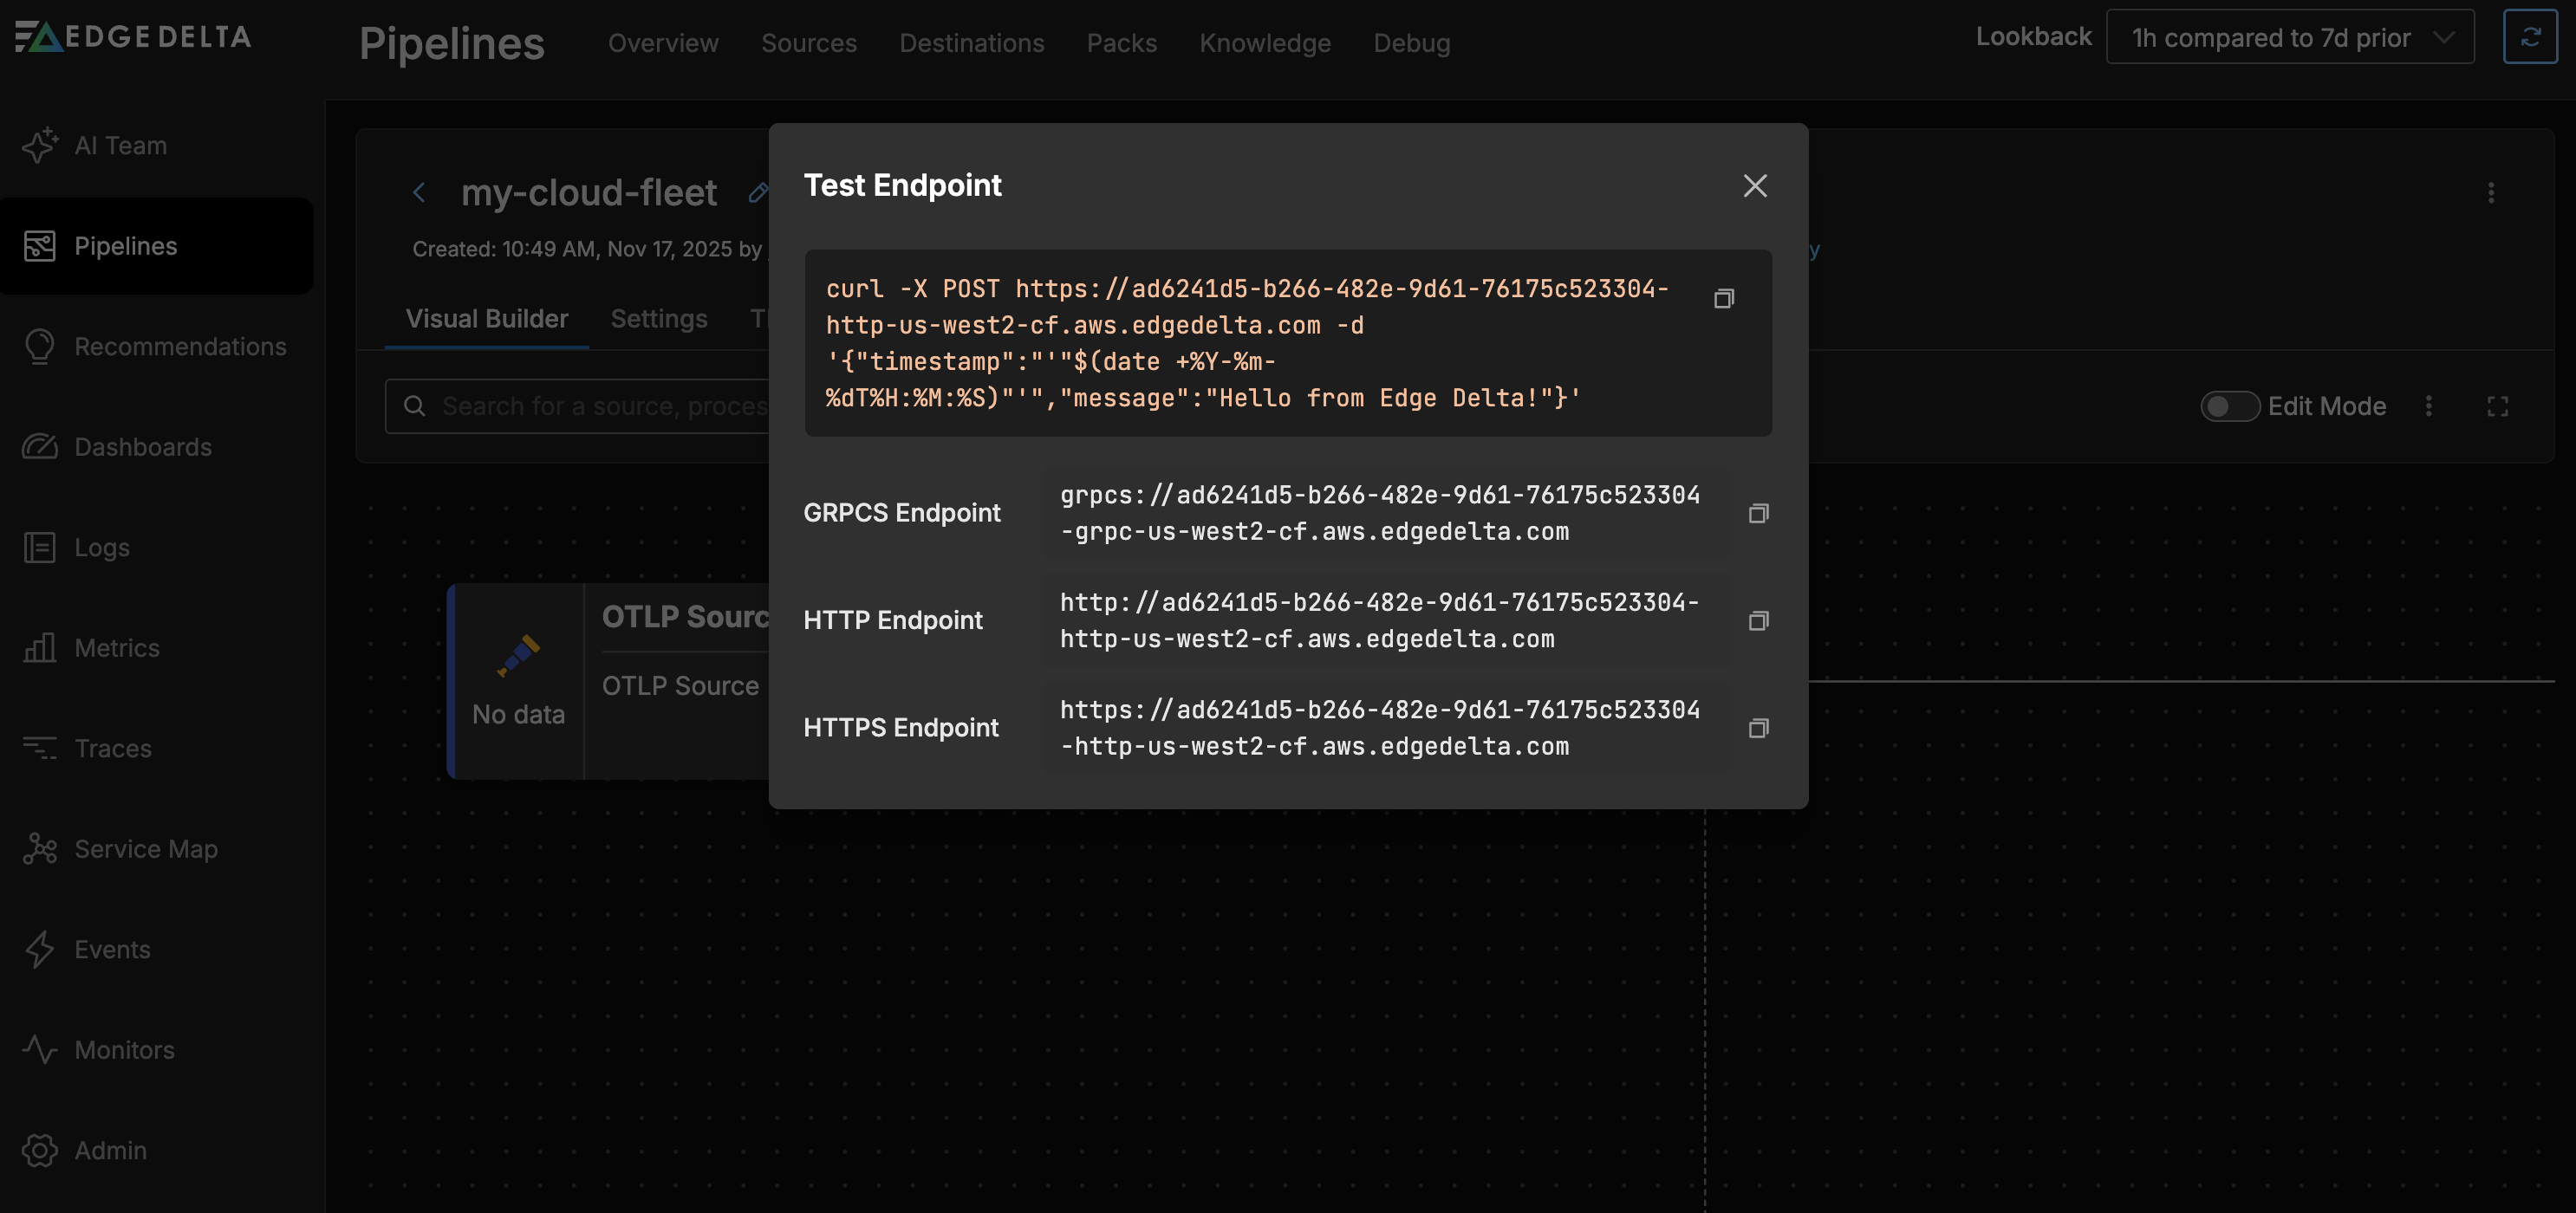
Endpoints: The settings page also displays the pipeline endpoints for data ingestion:
- GRPCS Endpoint: For secure gRPC connections
- HTTP Endpoint: For standard HTTP connections
- HTTPS Endpoint: For secure HTTP connections
You can also see the source specific endpoints in the source node configuration:
Suspend or Delete a Cloud Pipeline
You can suspend a cloud pipeline to pause its resource consumption while saving its configuration. Select the pipeline you want to suspend on the Pipelines page. Click the kebab icon and select Suspend. You can resume a suspended cloud pipeline using the Resume option:
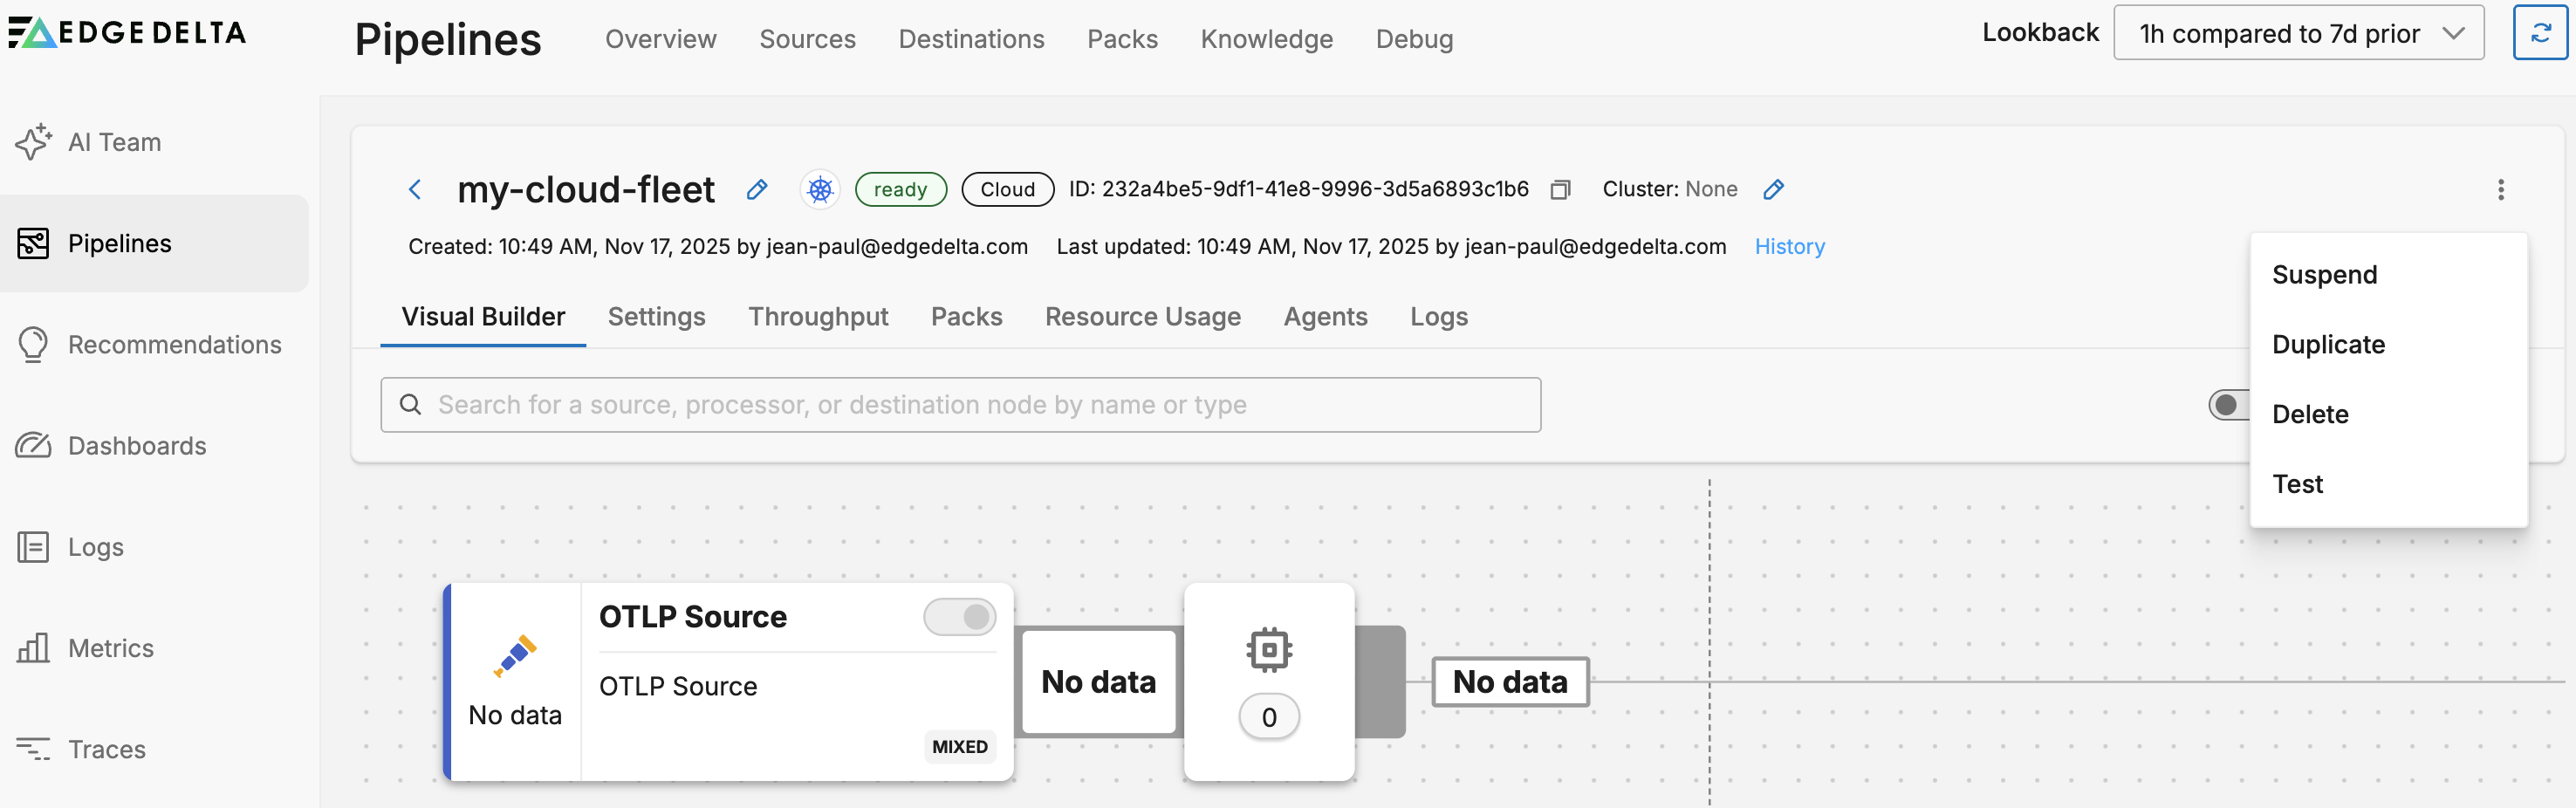
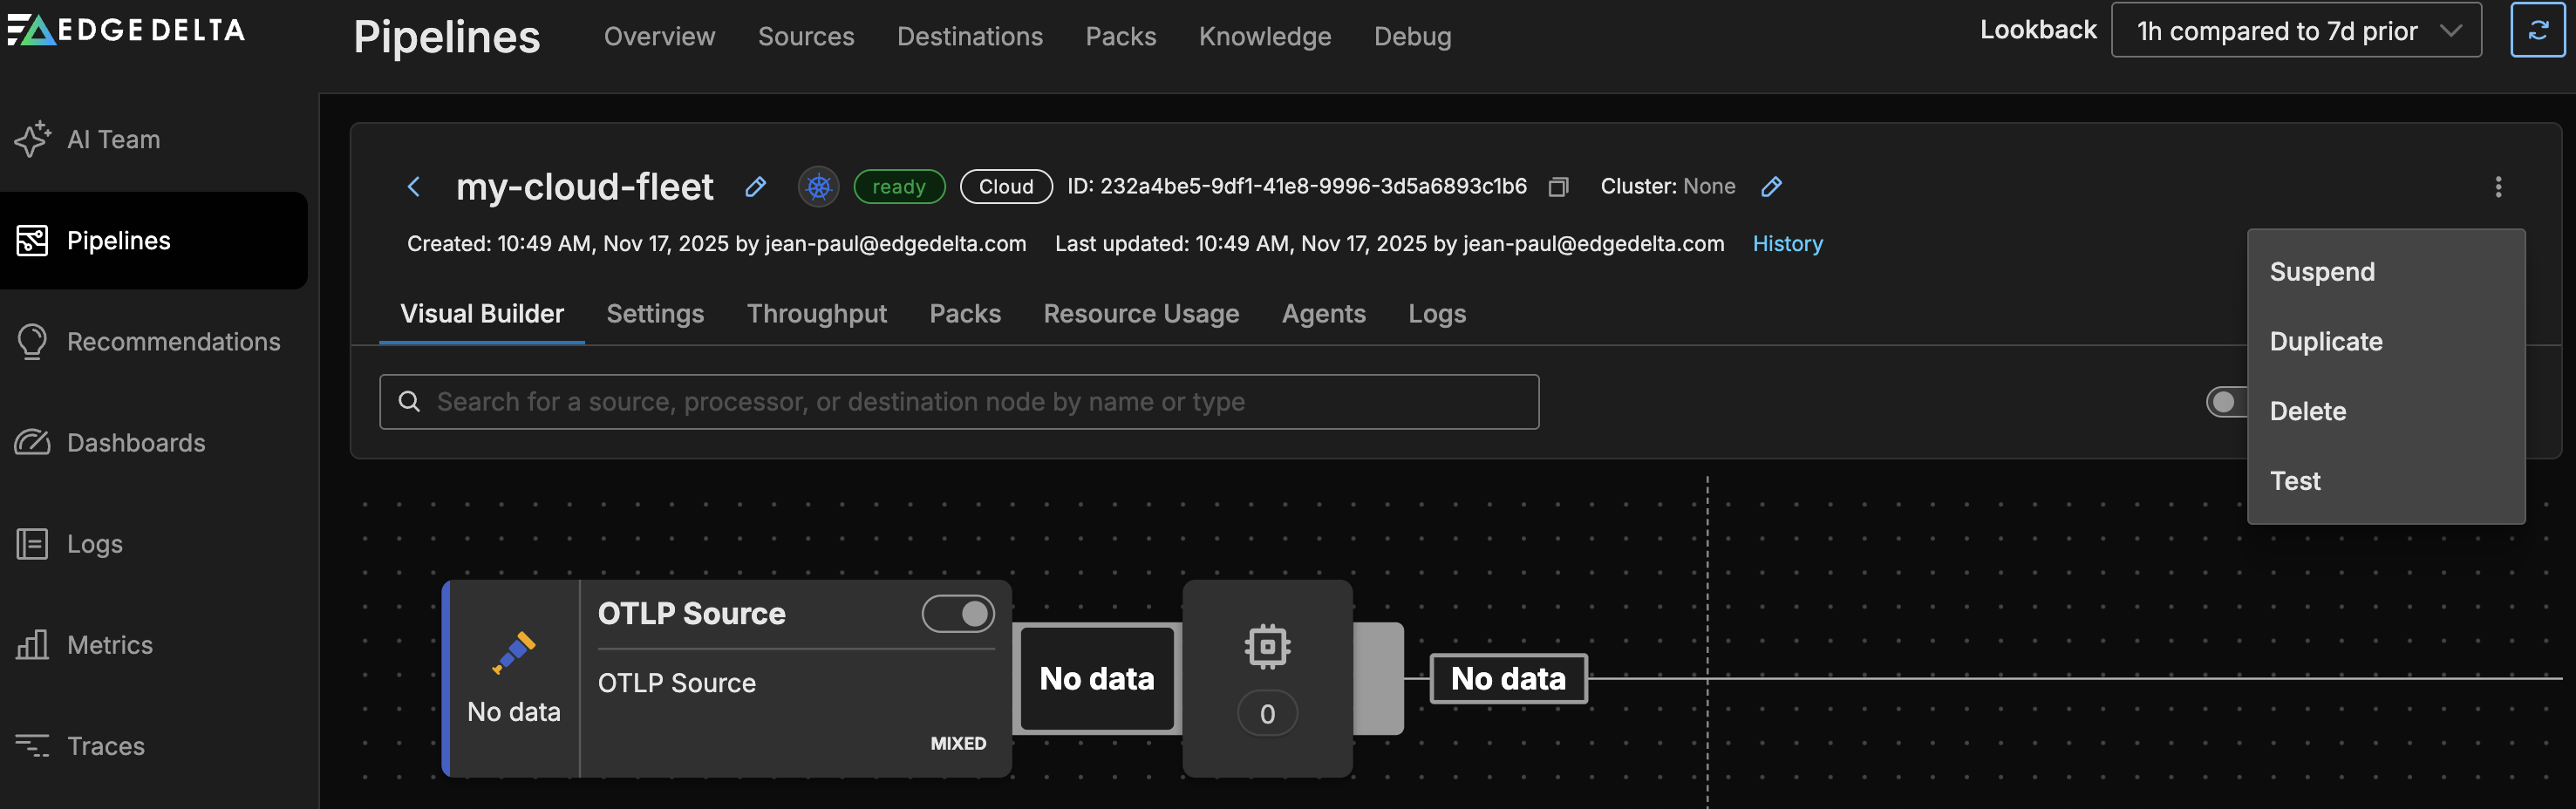
To delete a Cloud pipeline: Select it on the Pipelines page. Click the kebab icon and select Delete.
Click Test to be provided with a curl command to quickly test your endpoints.
Third Party Agents
A cloud pipeline is able to collect data from third party agents. In this scenario you do not need to install an Edge Delta agent in your environment, but rather point your existing agent, such as an OTEL collector, to an Edge Delta cloud pipeline. On the cloud pipeline, you configure an OTLP input node.
OTEL Collector
The OTLP source node consumes data items directly from OTLP configured data sources. The node is configured with the port that the agent should listen on.
Configure OTLP
To configure the OTLP source node, you must obtain the port number from the OTLP configuration:
- Instrumentation Libraries: When using the OpenTelemetry SDKs, the port used to emit OTLP logs is part of the exporter configuration. The endpoint (which includes the host and port) is set when setting up the OpenTelemetry exporter within your application code. See Instrument Code using OpenTelemetry.
- OpenTelemetry Collector: The port number on which the collector should send outgoing OTLP data is specified in the exporter section.
- Zero-Code Instrumentation Agents: Similar to the instrumentation libraries, auto-instrumentation agents are configured to send data to a specified endpoint. This configuration includes the port number to which OTLP logs will be sent. See Instrument Code using OpenTelemetry.
- Sidecars: In a Kubernetes environment, a sidecar that runs an instance of the OpenTelemetry Collector is set up using a configuration file, in which you can find the port for the OTLP receiver and exporter.
- Log Routers and Forwarders: Log routers and forwarders may have plugins or output configurations that support OTLP. Within these configurations,the endpoint is defined, including the port, where the logs should be sent in OTLP format.
HTTP Input Configuration
Cloud pipelines support HTTP input nodes for receiving logs via HTTP POST requests. However, there are specific constraints when using HTTP inputs in Cloud pipelines:
Port Configuration
Cloud pipelines support port 80 for HTTP traffic and port 443 for HTTPS/TLS traffic. Custom ports (e.g., 3421, 8080) cannot be used. When configuring TLS, use port 443; for non-TLS connections, use port 80.
Configuring Multiple HTTP Inputs
When you need multiple HTTP input nodes in the same Cloud pipeline (e.g., to separate data from different sources), you must use path filtering with the included_paths parameter to avoid data duplication. If you only have a single HTTP input node, the included_paths parameter is optional and the node will accept requests from all paths.
Example: Multiple HTTP Inputs with Path Filtering
This example shows three HTTP input nodes configured to receive different types of data. Each node uses the same port (80 for HTTP in this example, but could be 443 for HTTPS) and filters incoming requests based on the URL path. The first node accepts application logs via paths starting with /app/logs/, the second receives infrastructure metrics through /infrastructure/metrics/ paths, and the third handles security events at /security/events/ paths.
nodes:
- name: app_logs_input
  type: http_input
  port: 80
  included_paths:
    - /app/logs/.*

- name: infra_metrics_input
  type: http_input
  port: 80
  included_paths:
    - /infrastructure/metrics/.*

- name: security_events_input
  type: http_input
  port: 80
  included_paths:
    - /security/events/.*
Important Considerations
- Path filtering is mandatory for multiple HTTP inputs to prevent data duplication
- Each HTTP input node must have unique, non-overlapping path patterns
- Path patterns use regular expressions (e.g.,
/v1/.*matches/v1/logs,/v1/metrics) - If
included_pathsis not specified, the node accepts all paths - When
included_pathsis specified, only matching requests are accepted
Testing HTTP Endpoints
When sending data to your Cloud pipeline’s HTTP endpoints, include the appropriate path:
curl -X POST -d '{"level":"info","message":"Application started"}' \
  https://your-pipeline-id-http-us-west2-cf.aws.edgedelta.com/app/logs/server1

curl -X POST -d '{"cpu_usage":75,"memory_usage":60}' \
  https://your-pipeline-id-http-us-west2-cf.aws.edgedelta.com/infrastructure/metrics/host1

curl -X POST -d '{"event":"login_attempt","user":"john.doe","status":"success"}' \
  https://your-pipeline-id-http-us-west2-cf.aws.edgedelta.com/security/events/auth
The first command sends application logs to the /app/logs/server1 path, the second sends infrastructure metrics to /infrastructure/metrics/host1, and the third sends security events to /security/events/auth.
For more details on HTTP input configuration options, see the HTTP Source documentation.
Example Collector Configuration (Cloud Pipeline)
gRPC (Cloud Pipeline)
If you are sending OTEL telemetry from the collector to a cloud pipeline, you update the Collector configuration with exporters pointing to the cloud pipeline endpoints. You use secure TLS and port 443:
    exporters:
      otlp/ed-data-supply_trace:
        endpoint: '12345678-1a2b-3c4d-5e6f-7890ghijklmn-grpc-us-west2-cf.aws.edgedelta.com:443'
        tls:
          insecure: false
      otlp/ed-data-supply_metric:
        endpoint: '12345678-1a2b-3c4d-5e6f-7890ghijklmn-grpc-us-west2-cf.aws.edgedelta.com:443'
        tls:
          insecure: false
      otlp/ed-data-supply_log:
        endpoint: '12345678-1a2b-3c4d-5e6f-7890ghijklmn-grpc-us-west2-cf.aws.edgedelta.com:443'
        tls:
          insecure: false
Replace the endpoint with one provided in your Cloud pipeline settings. Include the port number but no route is required. Do not include
grpcs://.
And you update the Collector’s Pipeline to use the new exporters:
    service:
      extensions:
      - health_check
      pipelines:
        logs:
          exporters:
          ...
          - otlp/ed-data-supply_log
          ...
        metrics:
          exporters:
          ...
          - otlp/ed-data-supply_metric
          ...
        traces:
          exporters:
          ...
          - otlp/ed-data-supply_trace
          ...
The Cloud pipeline contains an OTLP input node by default, which does not need to be adjusted for this gRPC configuration:
- name: otlp_input
  type: otlp_input
  port: 4317
  protocol: grpc
HTTP (Cloud Pipeline)
To send OTLP telemetry to an Edge Delta Cloud pipeline you configure otlphttp exporters and disable compression. You use secure TLS and port 443 for HTTPS:
    exporters:
      otlphttp/ed-data-supply_trace:
        endpoint: 'https://12345678-1a2b-3c4d-5e6f-7890ghijklmn-http-us-west2-cf.aws.edgedelta.com:443'
        encoding: proto
        compression: none
        tls:
          insecure: false
      otlphttp/ed-data-supply_metric:
        endpoint: 'https://12345678-1a2b-3c4d-5e6f-7890ghijklmn-http-us-west2-cf.aws.edgedelta.com:443'
        encoding: proto
        compression: none
        tls:
          insecure: false
      otlphttp/ed-data-supply_log:
        endpoint: 'https://12345678-1a2b-3c4d-5e6f-7890ghijklmn-http-us-west2-cf.aws.edgedelta.com:443'
        encoding: proto
        compression: none
        tls:
          insecure: false
Replace the endpoint with one provided in your Cloud pipeline settings. You include the port number at the end but no route is required. Unlike gRPC you include
https://.
Important Configuration Notes:
- Compression: Set
compression: none- this is required for Cloud Pipelines. Recent OTLP collector versions may enable compression by default, which can cause connection issues. - Encoding: Use
encoding: proto(protobuf) for optimal performance. Whileencoding: jsonis supported, there is a known regression in OpenTelemetry Collector version 2.6.0 affecting JSON encoding. If you must use JSON encoding, avoid version 2.6.0.
And you update the Collector’s Pipeline to use the new exporters:
    service:
      extensions:
      - health_check
      pipelines:
        logs:
          exporters:
          ...
          - otlphttp/ed-data-supply_log
          ...
        metrics:
          exporters:
          ...
          - otlphttp/ed-data-supply_metric
          ...
        traces:
          exporters:
          ...
          - otlphttp/ed-data-supply_trace
          ...
The Cloud pipeline contains an HTTP input node by default, which you need to delete. Replace it with an OTLP input node listening on port 80 for HTTP traffic:
- name: otlp_input_80
  type: otlp_input
  port: 80
  protocol: http
- name: otlp_input
  type: otlp_input
  port: 4317
  protocol: grpc
Note: You may also need to include an unused gRPC OTLP node to pass configuration validation.
Troubleshooting
If you encounter issues with your Cloud Pipeline configuration or connectivity, see the Cloud Pipelines Troubleshooting Guide for common problems and solutions.
Supported Node Types
Cloud Pipelines support the same source, processor, and destination nodes as Edge Pipelines.
Sources
- Azure Event Hub Source
- CrowdStrike FDR Source
- Datadog Agent Source
- Filebeat
- HTTP Pull Input Source
- HTTP Source
- HTTP Workflow Input Source (beta)
- Kafka Source
- OTLP Source
- Pub/Sub Source
- S3 Source
- Telemetry Generator Source
Processors
- Add Field
- Aggregate Metric Processor
- Base64 Decoder
- Code
- Comment (beta)
- Conditional Group
- Context Filter
- Copy Field
- Cumulative To Delta Processor
- Dedup Processor
- Delete Empty Values
- Delete Field
- Deotel
- Extract Metric Processor
- Filter
- JSON Unroll Processor
- Log to Pattern
- Lookup Processor
- Mask
- Multi Processor
- OTTL Transform
- Pack
- Parse CSV
- Parse Grok
- Parse JSON
- Parse Key Value
- Parse Regex
- Parse Severity Fields
- Parse Timestamp
- Parse XML
- Redis Enrichment
- Rollup Metric
- Route
- Sample Processor
- Stateful Alert
- Tail Sampling
- Threshold
Destinations
Streaming
- Apache Kudu Destination (beta)
- AWS Cloudwatch Destination
- Azure Log Analytics Destination
- Azure Sentinel Destination
- ClickHouse Destination (beta)
- CrowdStrike Falcon LogScale Destination
- Datadog Destination
- Dynatrace Destination
- Elastic Destination
- Exabeam Destination
- FluentD Destination
- Google Cloud Logging Destination
- Google SecOps (Chronicle) Destination (beta)
- HTTP Destination
- IBM QRadar Destination
- Kafka Destination
- Loki Destination
- New Relic Destination
- OpenMetrics Destination
- OTLP Destination
- Prometheus Exporter Destination
- Prometheus Remote Write Destination
- Securonix Destination
- Splunk Destination
- Splunk Load Balanced Destination (beta)
- Splunk TCP Destination
- SumoLogic Destination
- TCP Destination
Storage
- Azure Blob Destination
- DigitalOcean Spaces Destination
- GCS Destination
- Google Cloud Big Query Destination
- IBM Object Storage Destination
- Local Storage Destination
- Minio Destination
- S3 Destination
- Zenko Destination
Edge Delta
- ED Debug Destination
- ED Log Destination
- ED Metric Destination
- ED Pattern Destination
- ED Trace Destination
- Edge Delta Destination