Configure a Processor
7 minute read
Processors in Edge Delta are modular components that operate on telemetry data—logs, metrics, traces, and events—as it flows through your pipeline. Each processor performs a specific function such as parsing, masking, filtering, metric extraction, or aggregation. By combining processors, you can create dynamic, efficient pipelines tailored to your team’s observability, security, and cost goals.
If you’re new to pipelines, start with the Pipeline Quickstart Overview or learn how to Configure a Pipeline.
Legacy processor nodes are being deprecated in favor of these stacked sequence processors.
Processors can consume and emit all data types:
- incoming_data_types: archive, cluster_pattern_and_sample, custom, datadog_payload, diagnostic, health, heartbeat, log, metric, signal, source, source_samples, splunk_payload, trace
- outgoing_data_types: archive, cluster_pattern_and_sample, custom, datadog_payload, diagnostic, health, heartbeat, log, metric, signal, source, source_samples, splunk_payload, trace
Note: There is no need to decode the body before operating on it, despite many processors using OTTL under the hood. Similarly, patterns are automatically escaped for you.
Create a Processor
When you add a source or destination, a processor is added automatically.
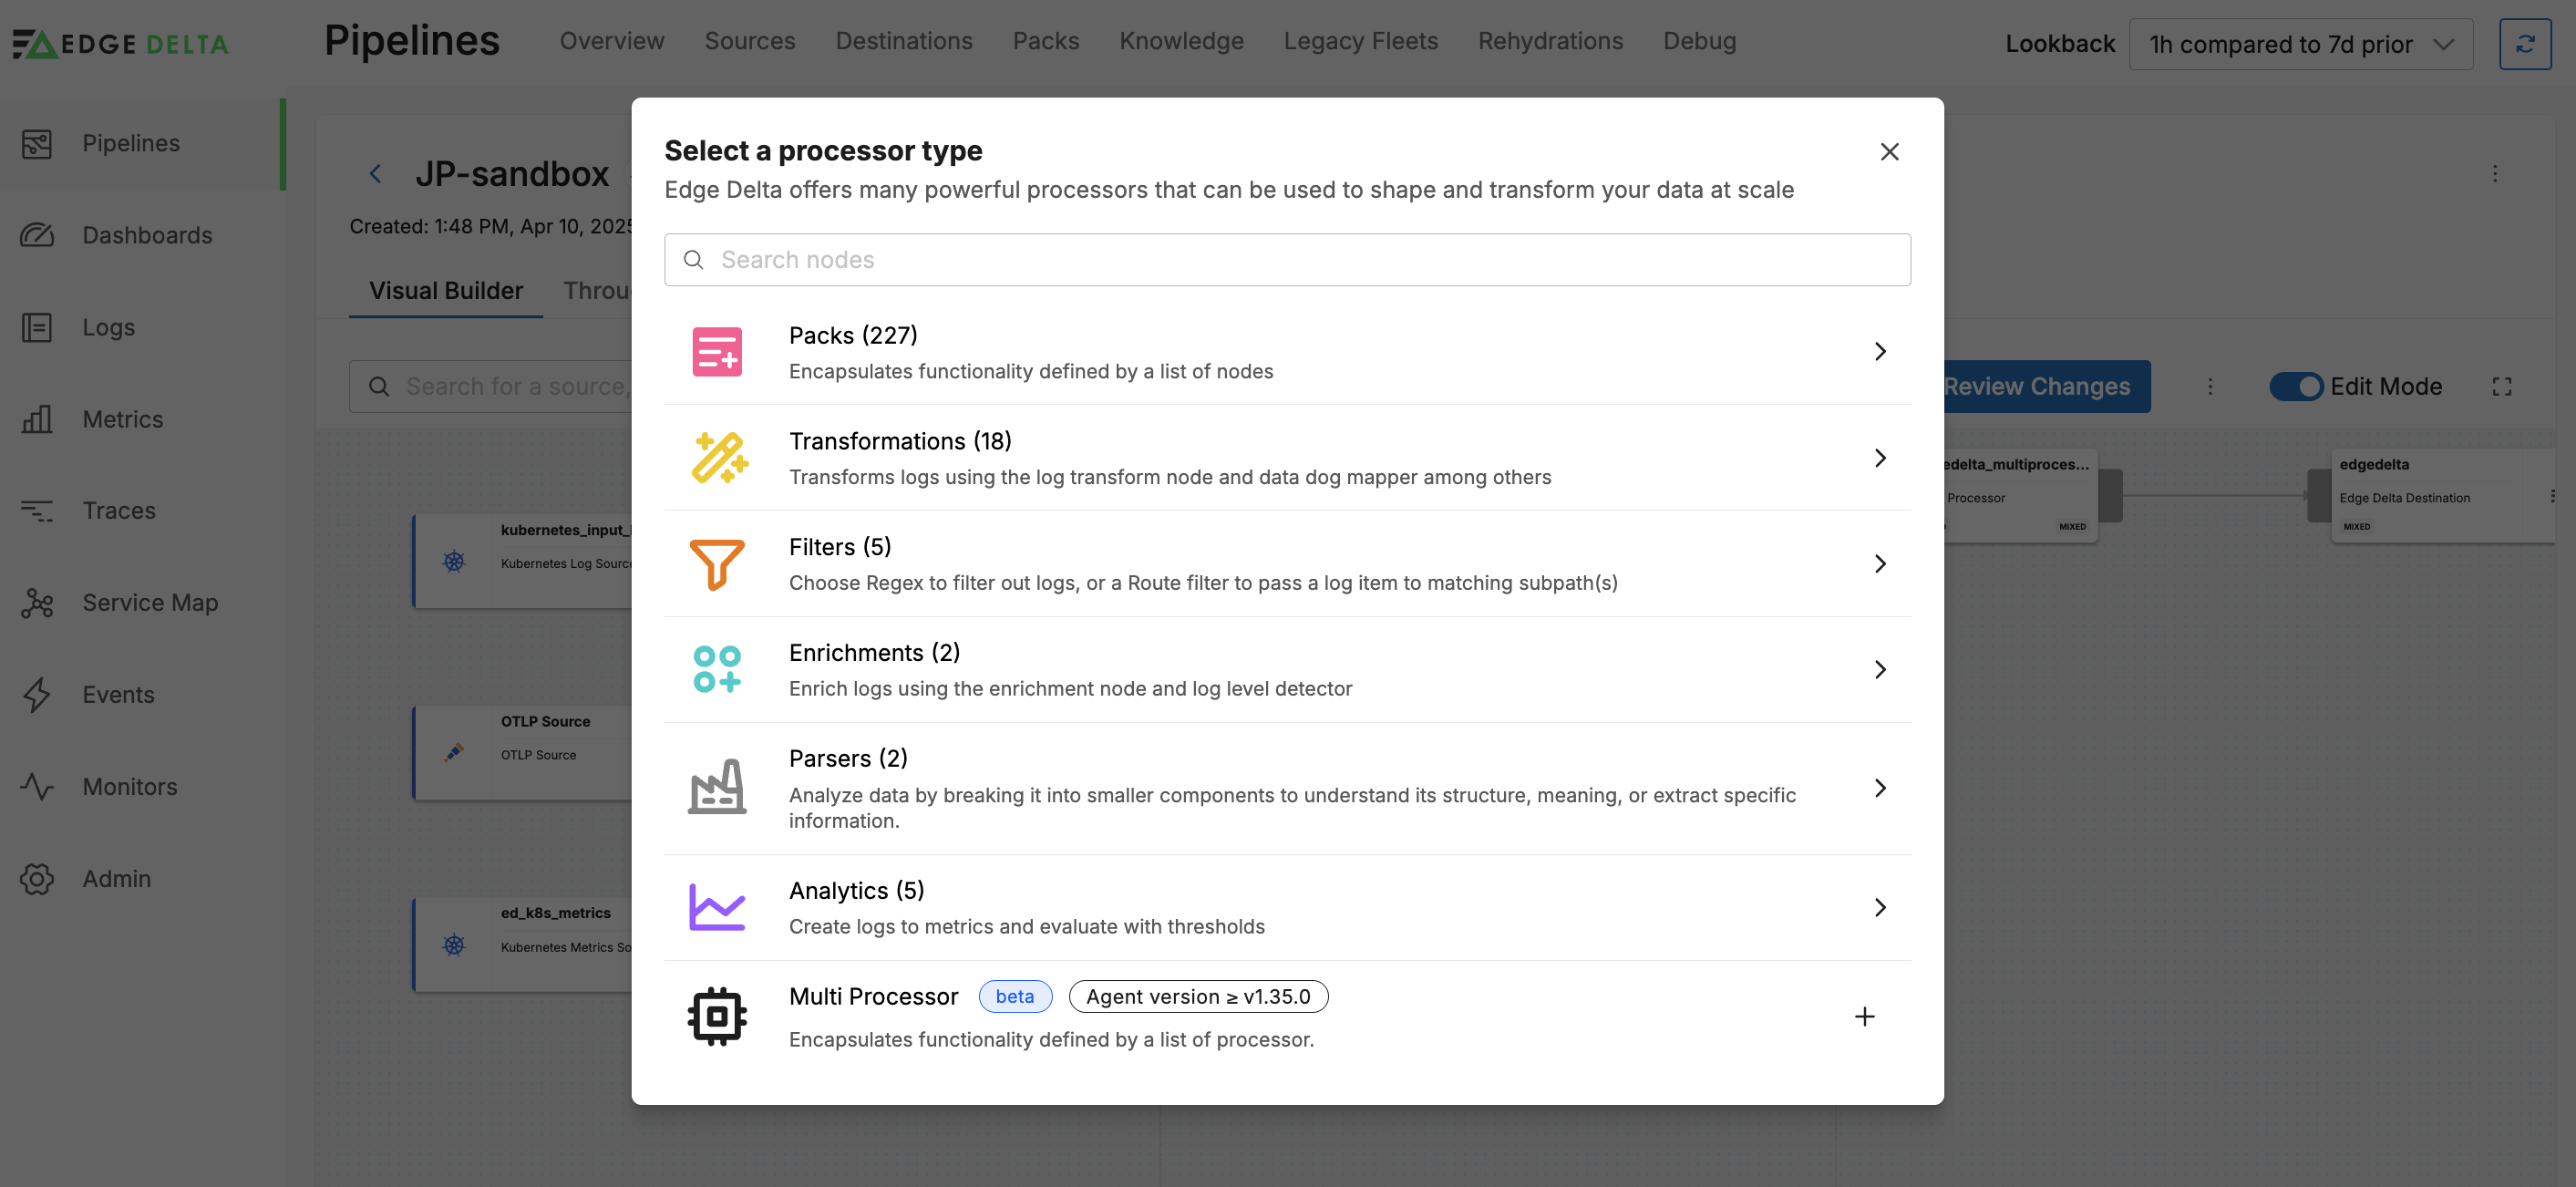
Alternatively, in pipeline Edit Mode, click Add Node and select Multi Processor.
Add Processor Based on Context
You can add and automatically configure a processor using fields in the output pane. To do this you must be in the Pretty View.
You select a field that is the subject of a processor you need. The context menu shows options for processors that can be automatically added and configured:
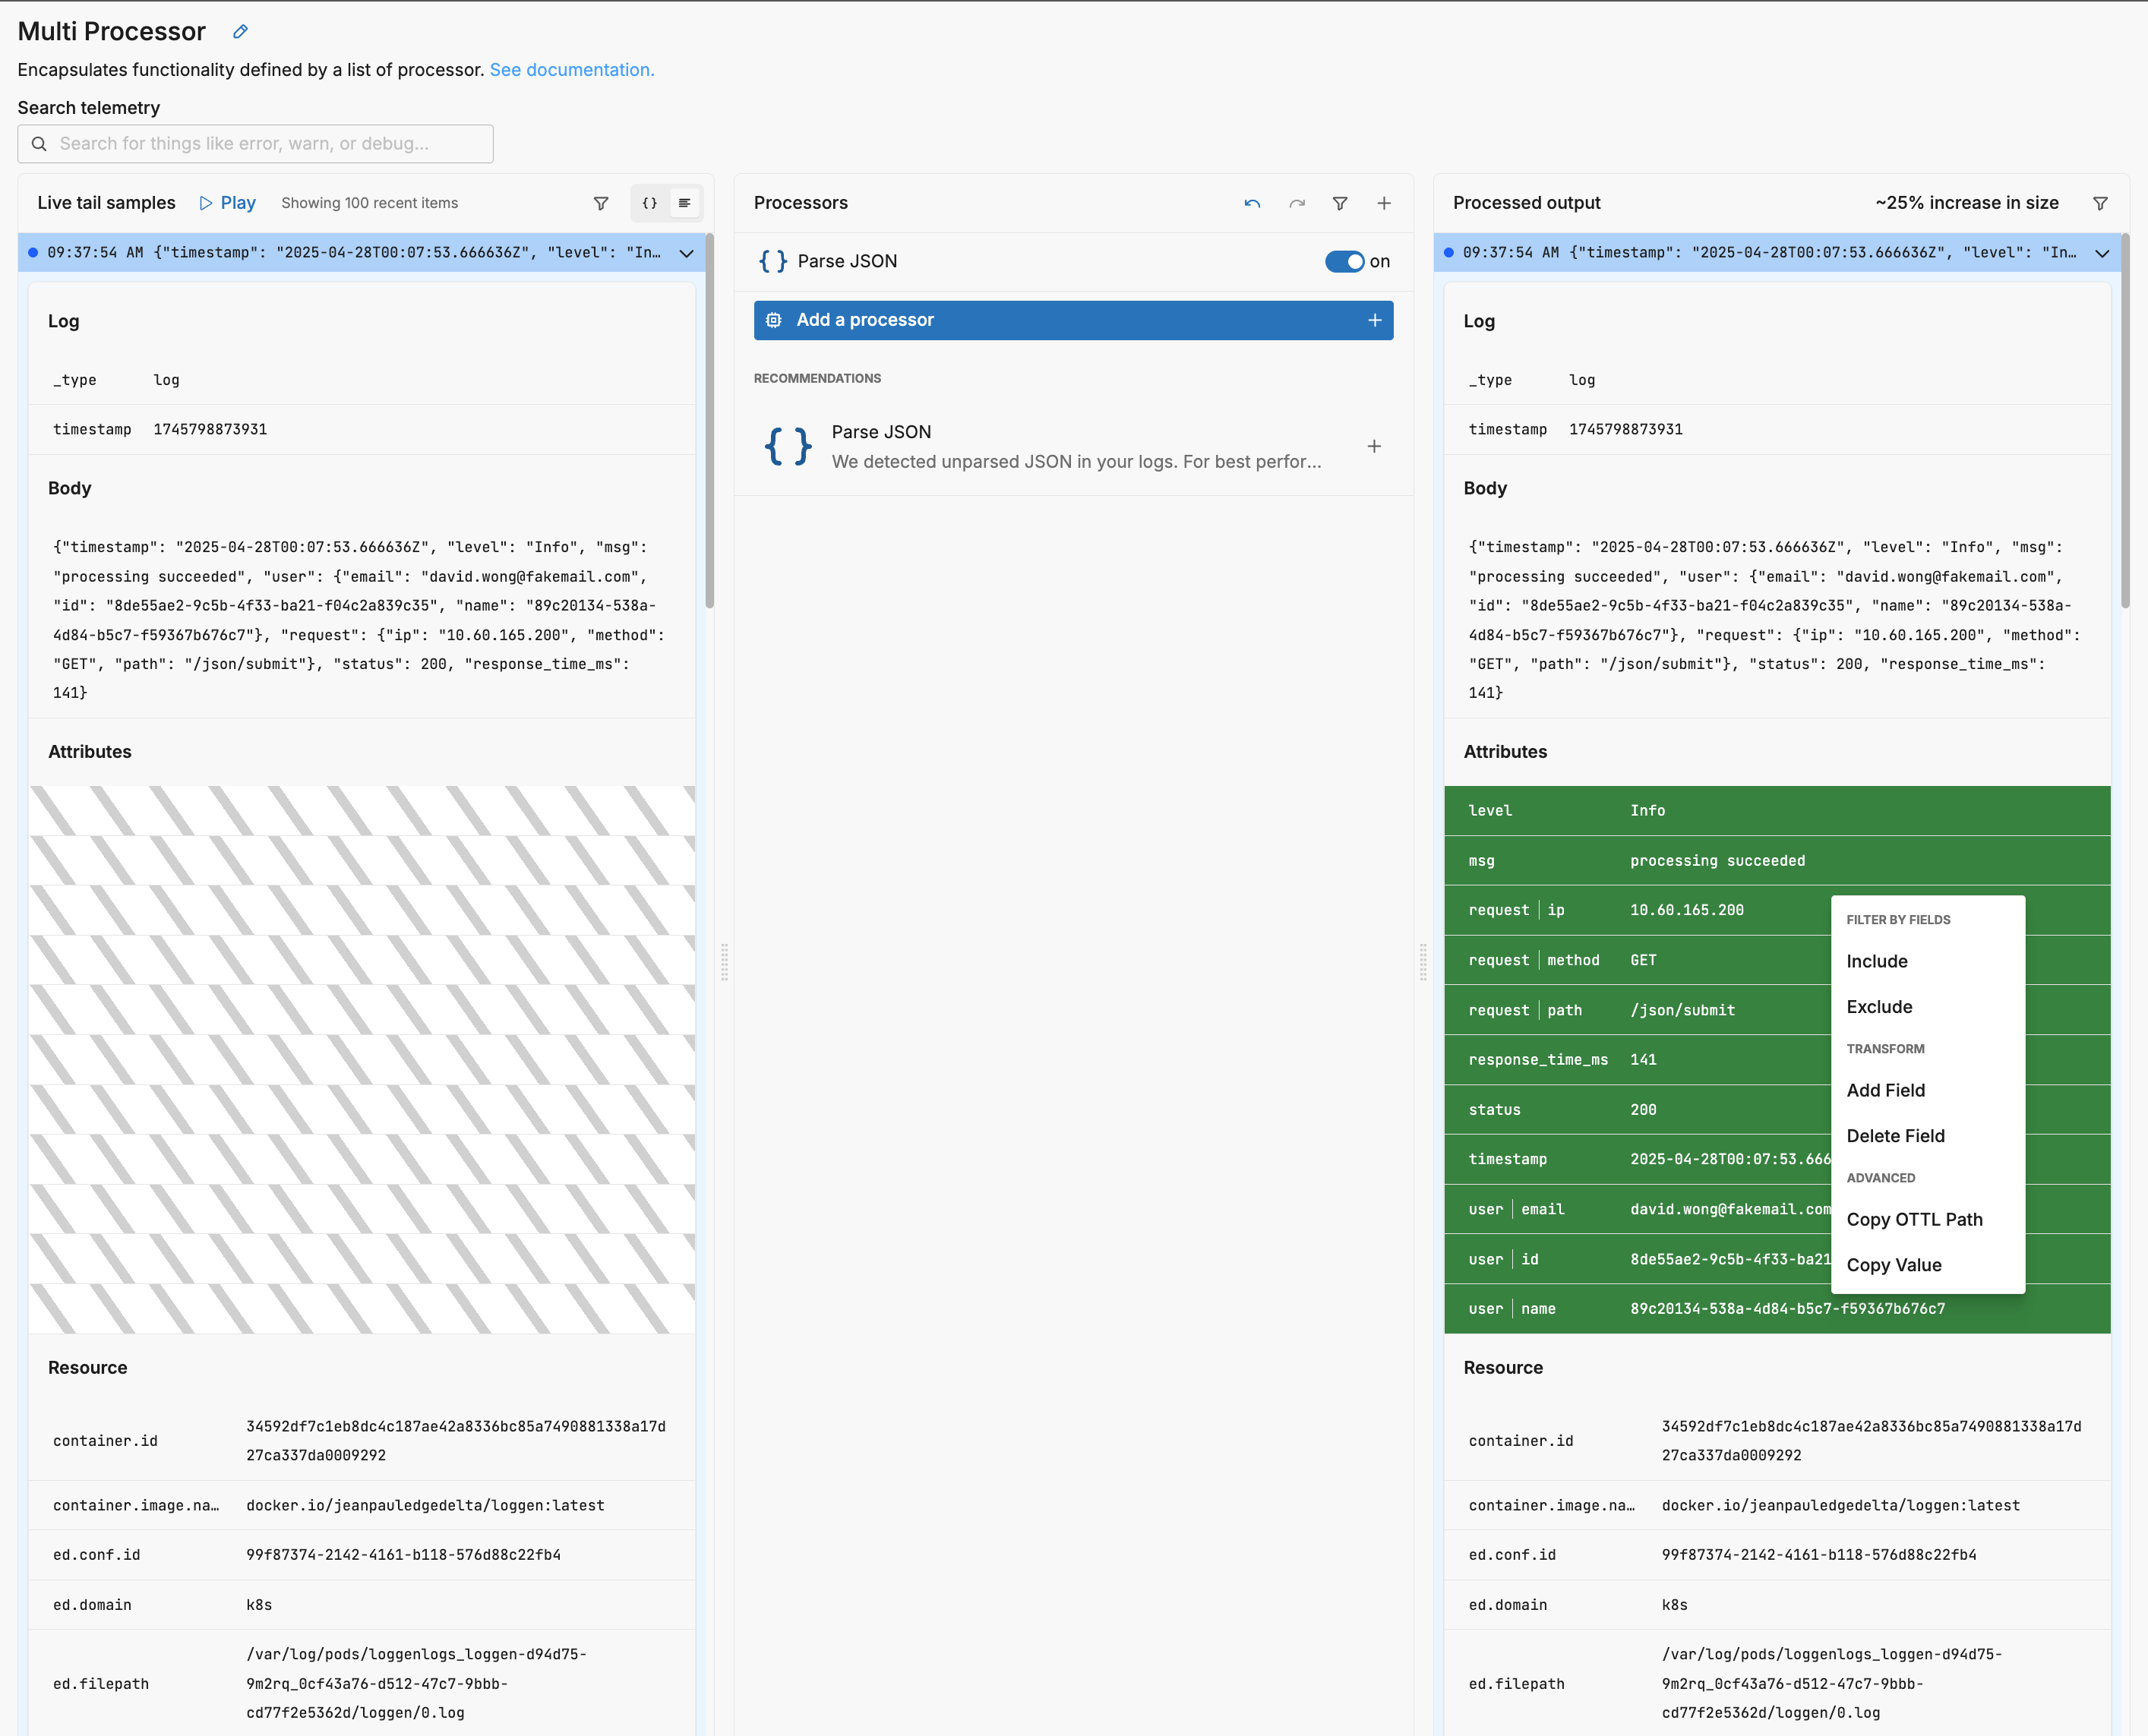
In this example processing succeeded was clicked. Suppose you want to exclude logs containing this value in this field. You click Exclude:
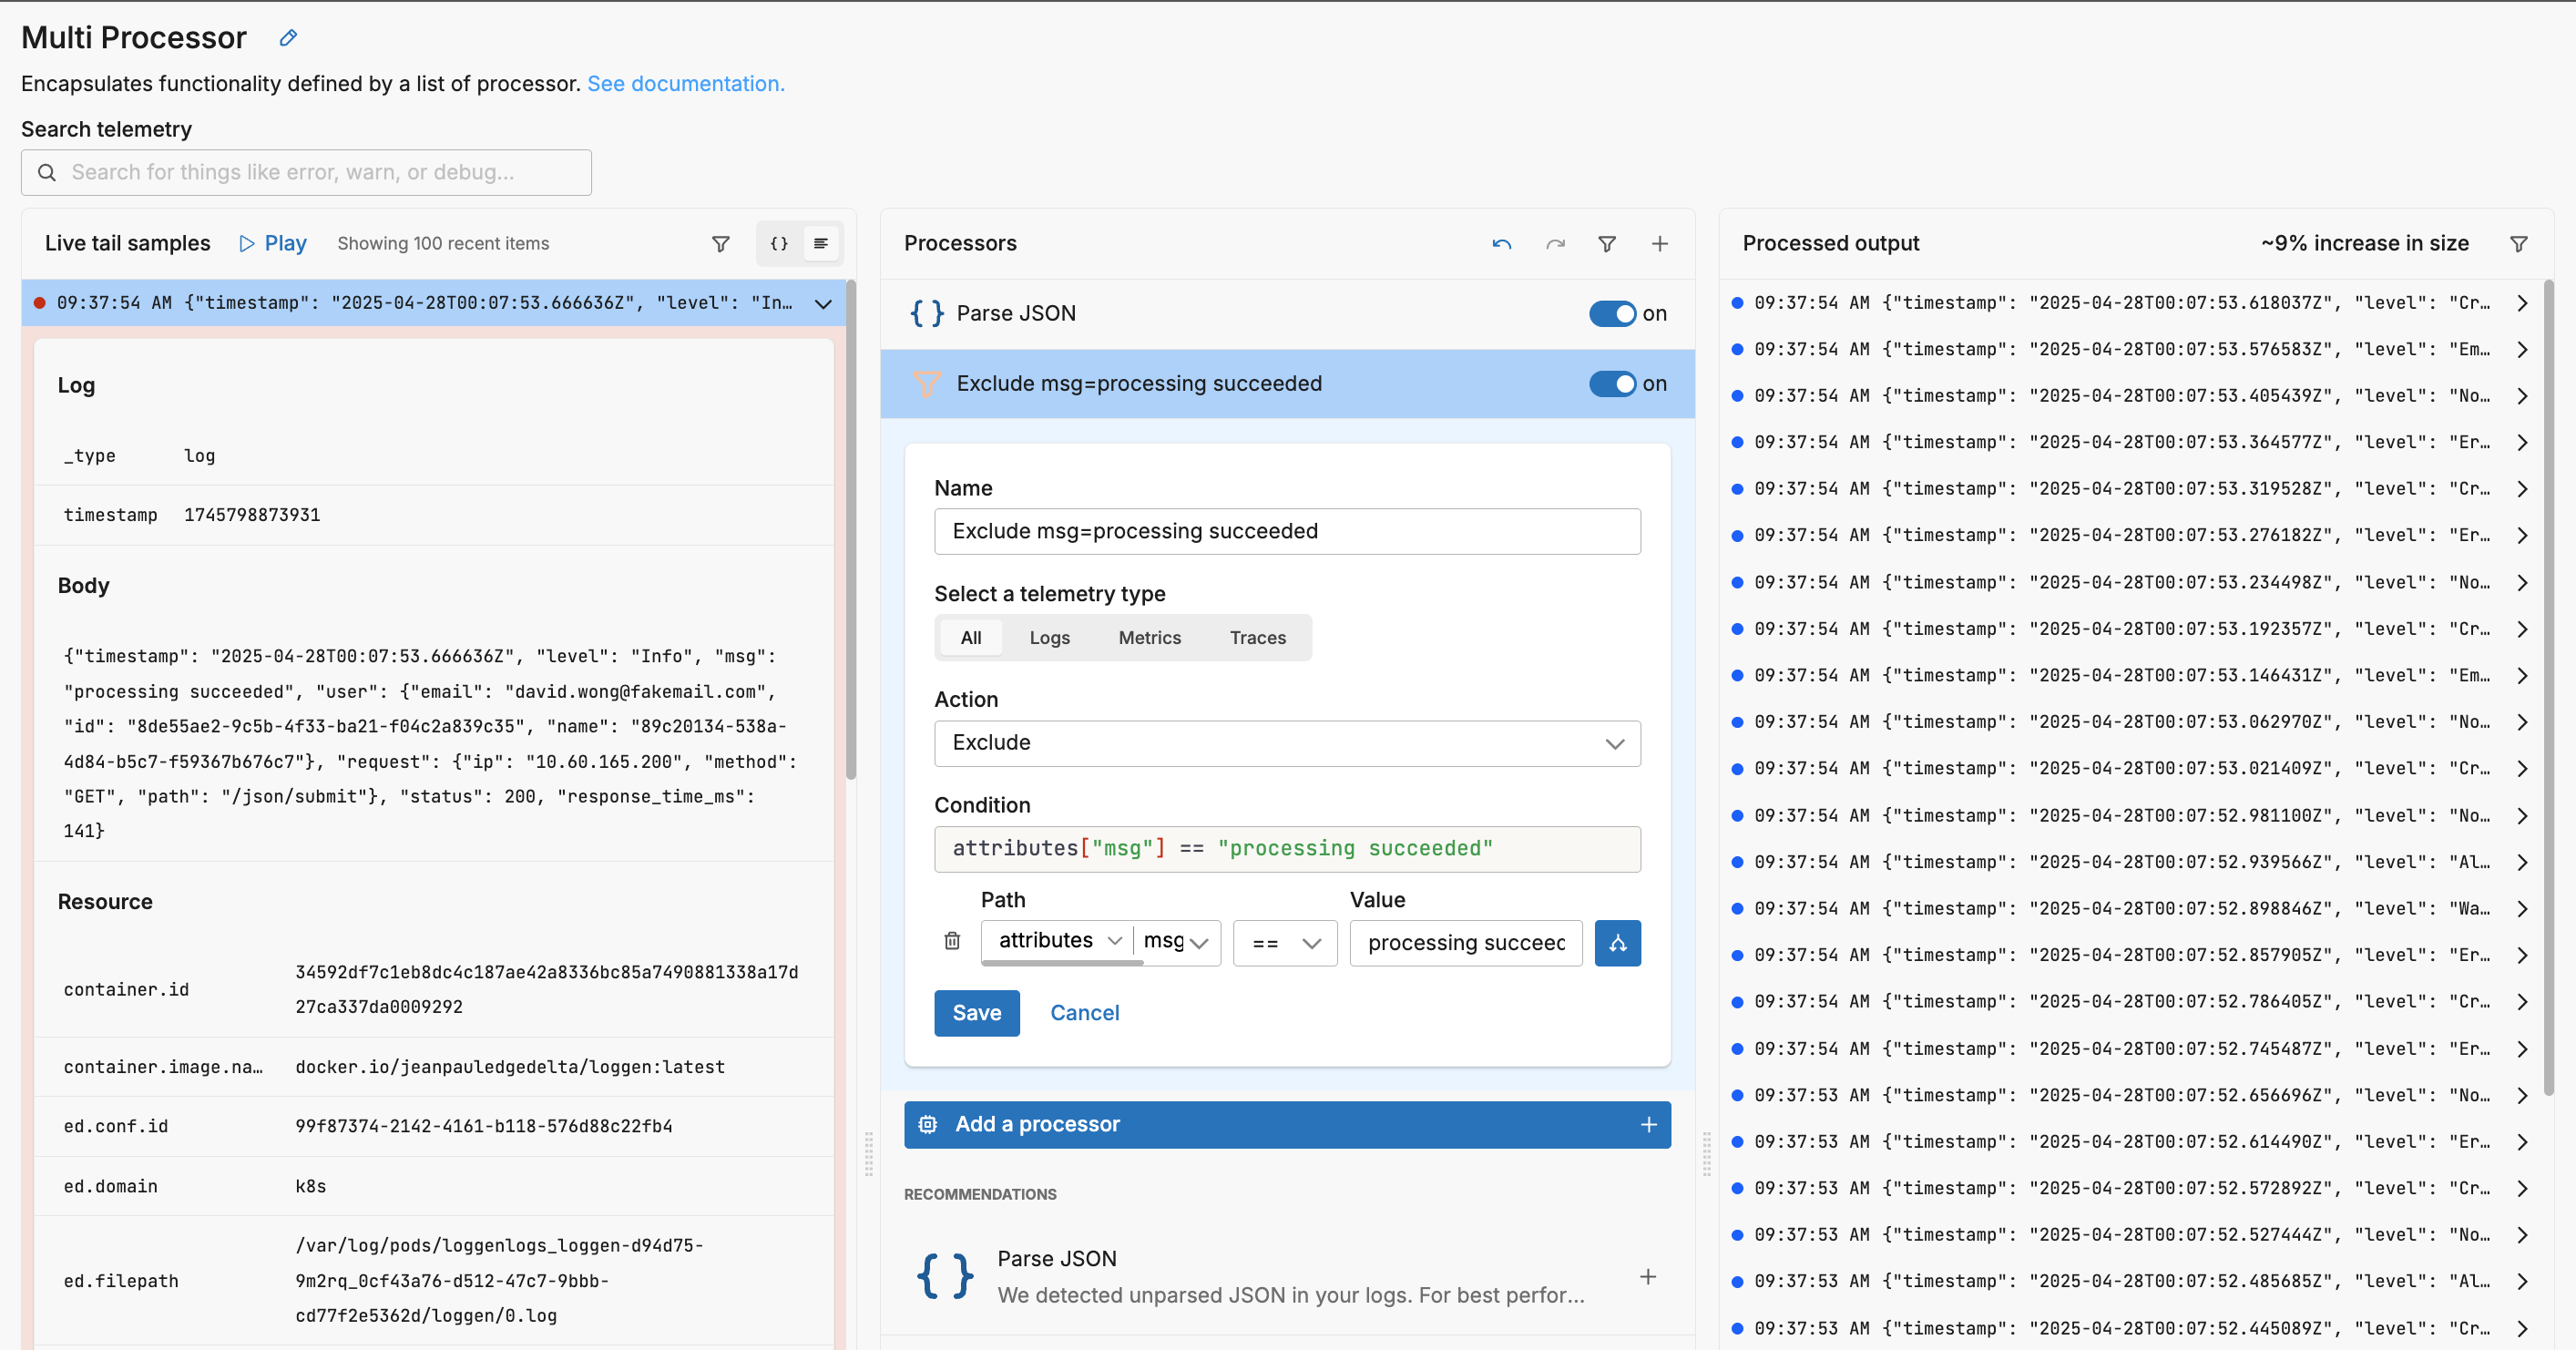
A filter processor has been added to the processor stack and it has been automatically configured appropriately to drop any logs where attributes["msg"] == "processing succeeded". You can tweak the configuration or leave it as is and click Save.
AI-Powered Processor Recommendations
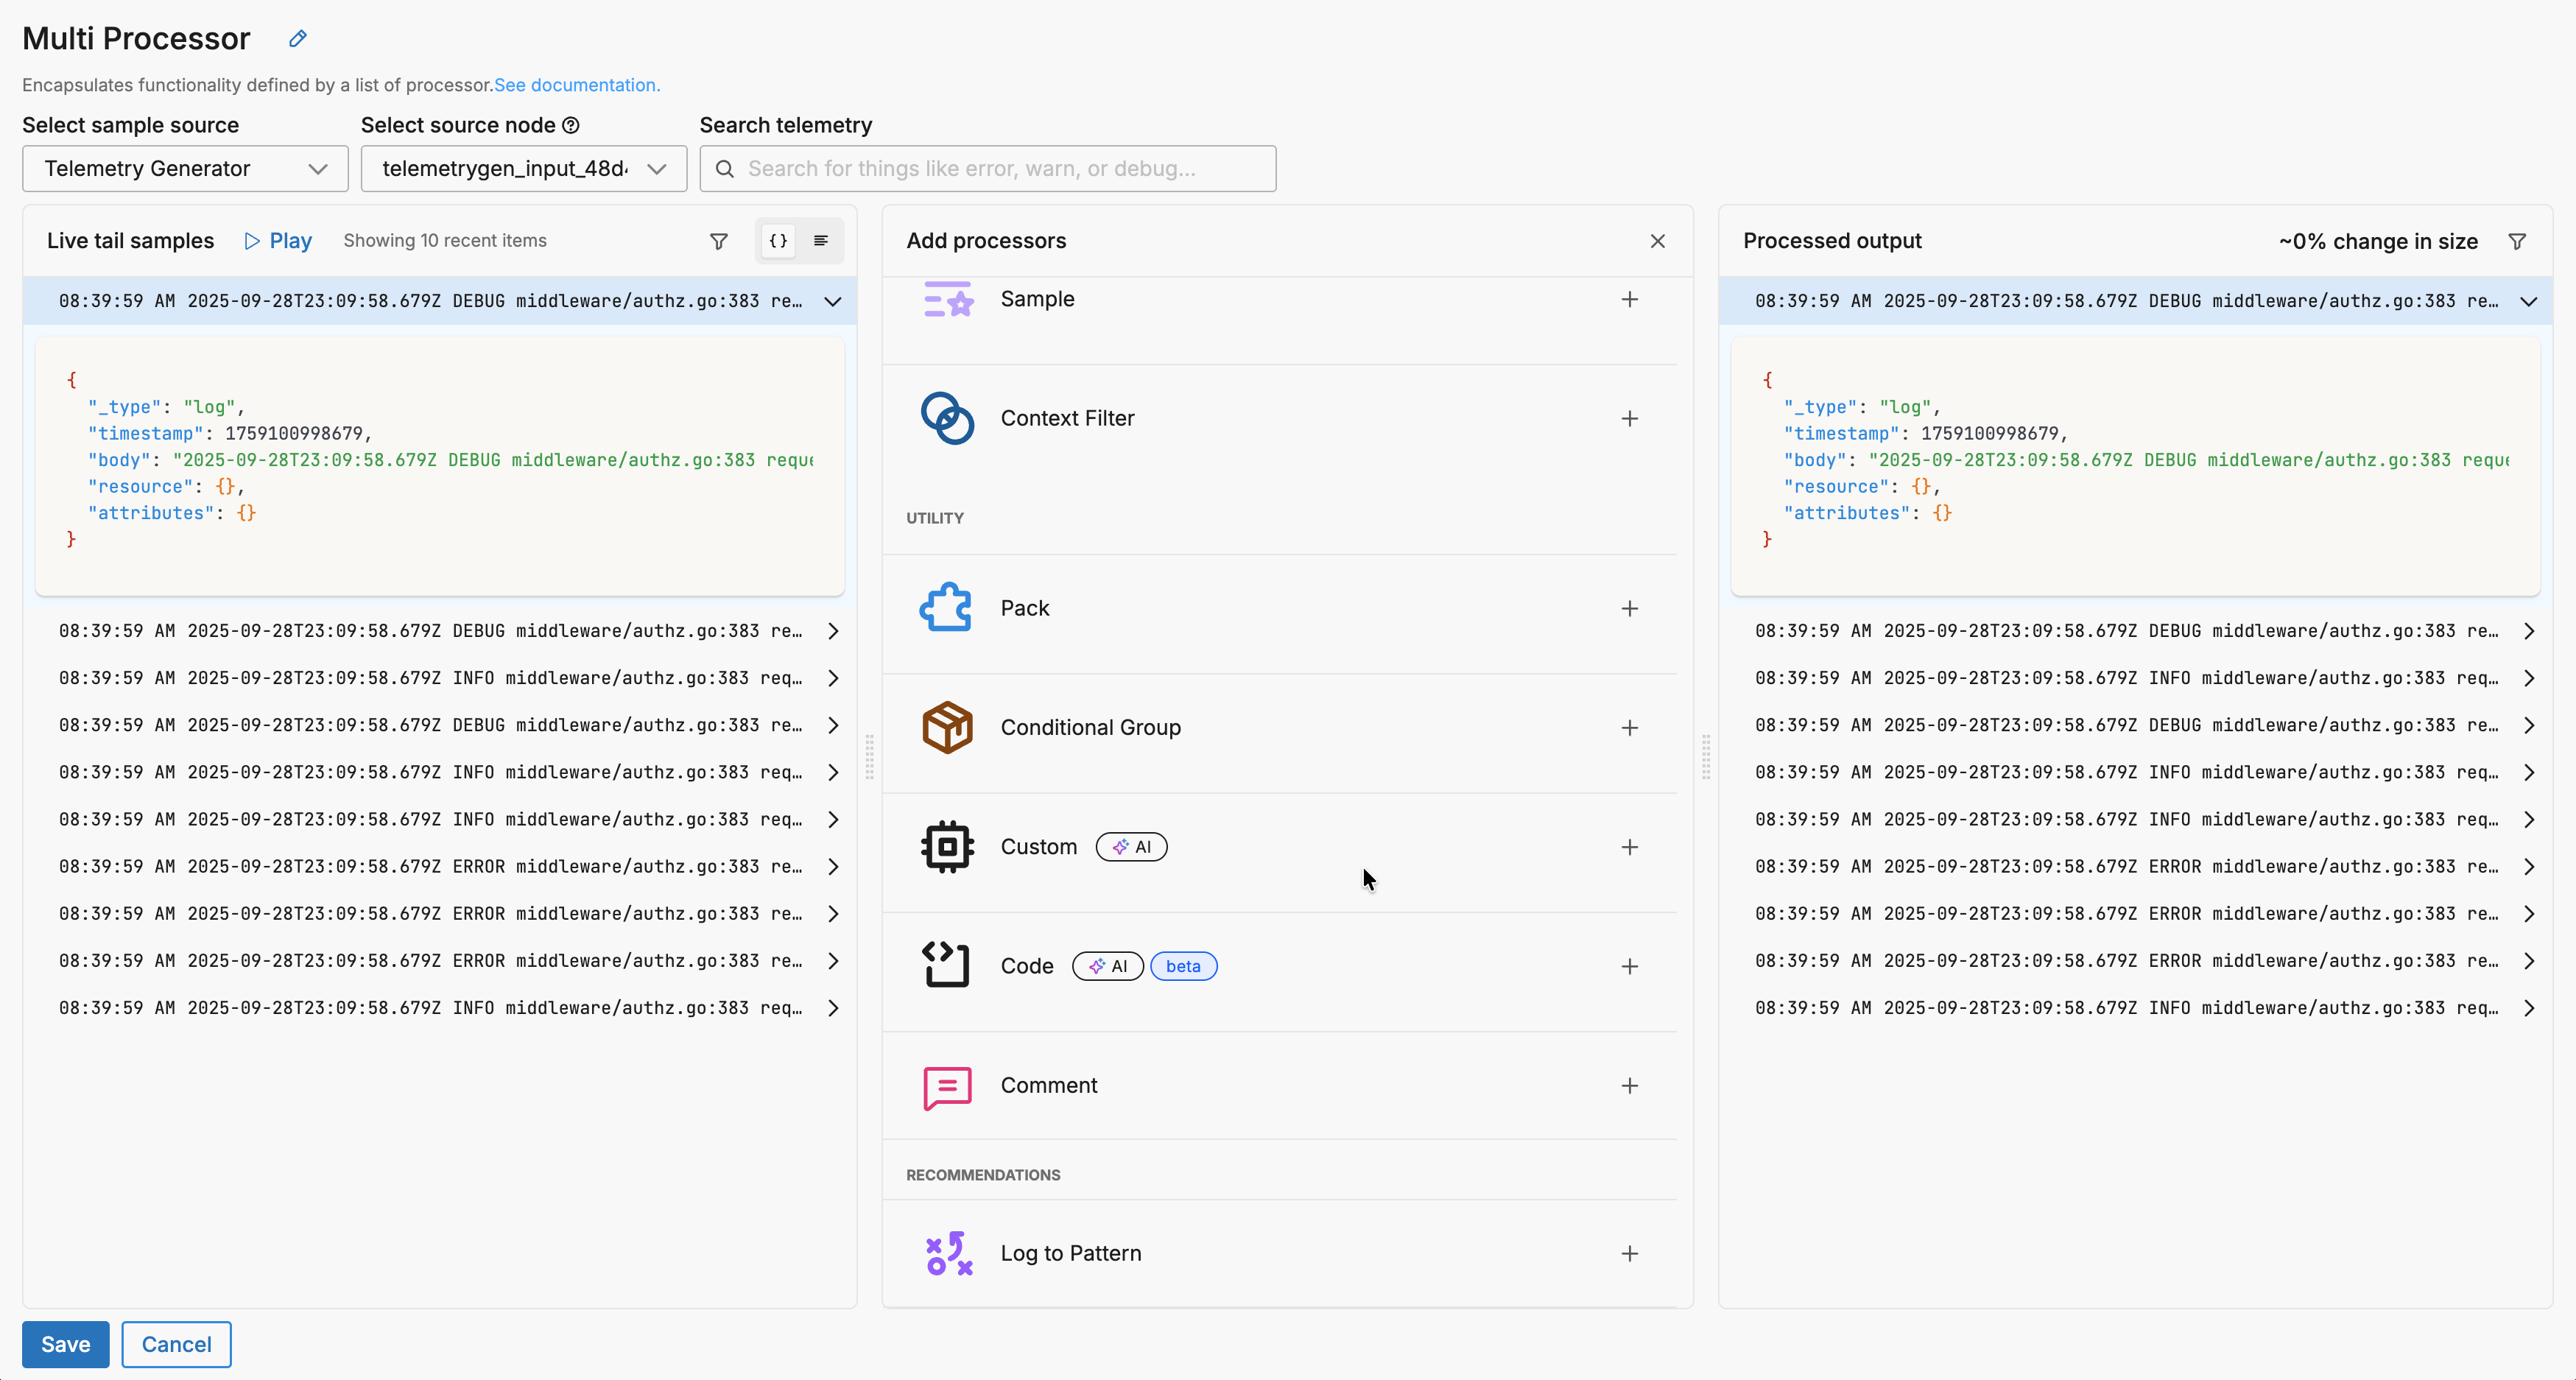
Edge Delta’s Recommendations feature provides intelligent suggestions for processors based on your data patterns. When working in the multiprocessor view, you’ll see recommended processors in the center pane that are specifically tailored to your data characteristics. These AI-powered recommendations analyze your log patterns to suggest actions like:
- Filtering low-value, repetitive logs to reduce volume
- Sampling high-volume patterns that don’t require full retention
- Masking sensitive data for privacy compliance
- Parsing structured data like JSON or XML for better analysis
You can also access the full Recommendations feed from the main navigation, where recommendations are organized by value and category (Cost Saving, Data Hygiene, Best Practice, Privacy). Each recommendation includes a preview of its impact, allowing you to make informed decisions before implementation.
Configure a Processor
A multiprocessor node is configured using Live Capture data. To start, it recommends a particular processor based on the detected input traffic. In this instance, the logs are JSON formatted so it recommends a Parse JSON processor:
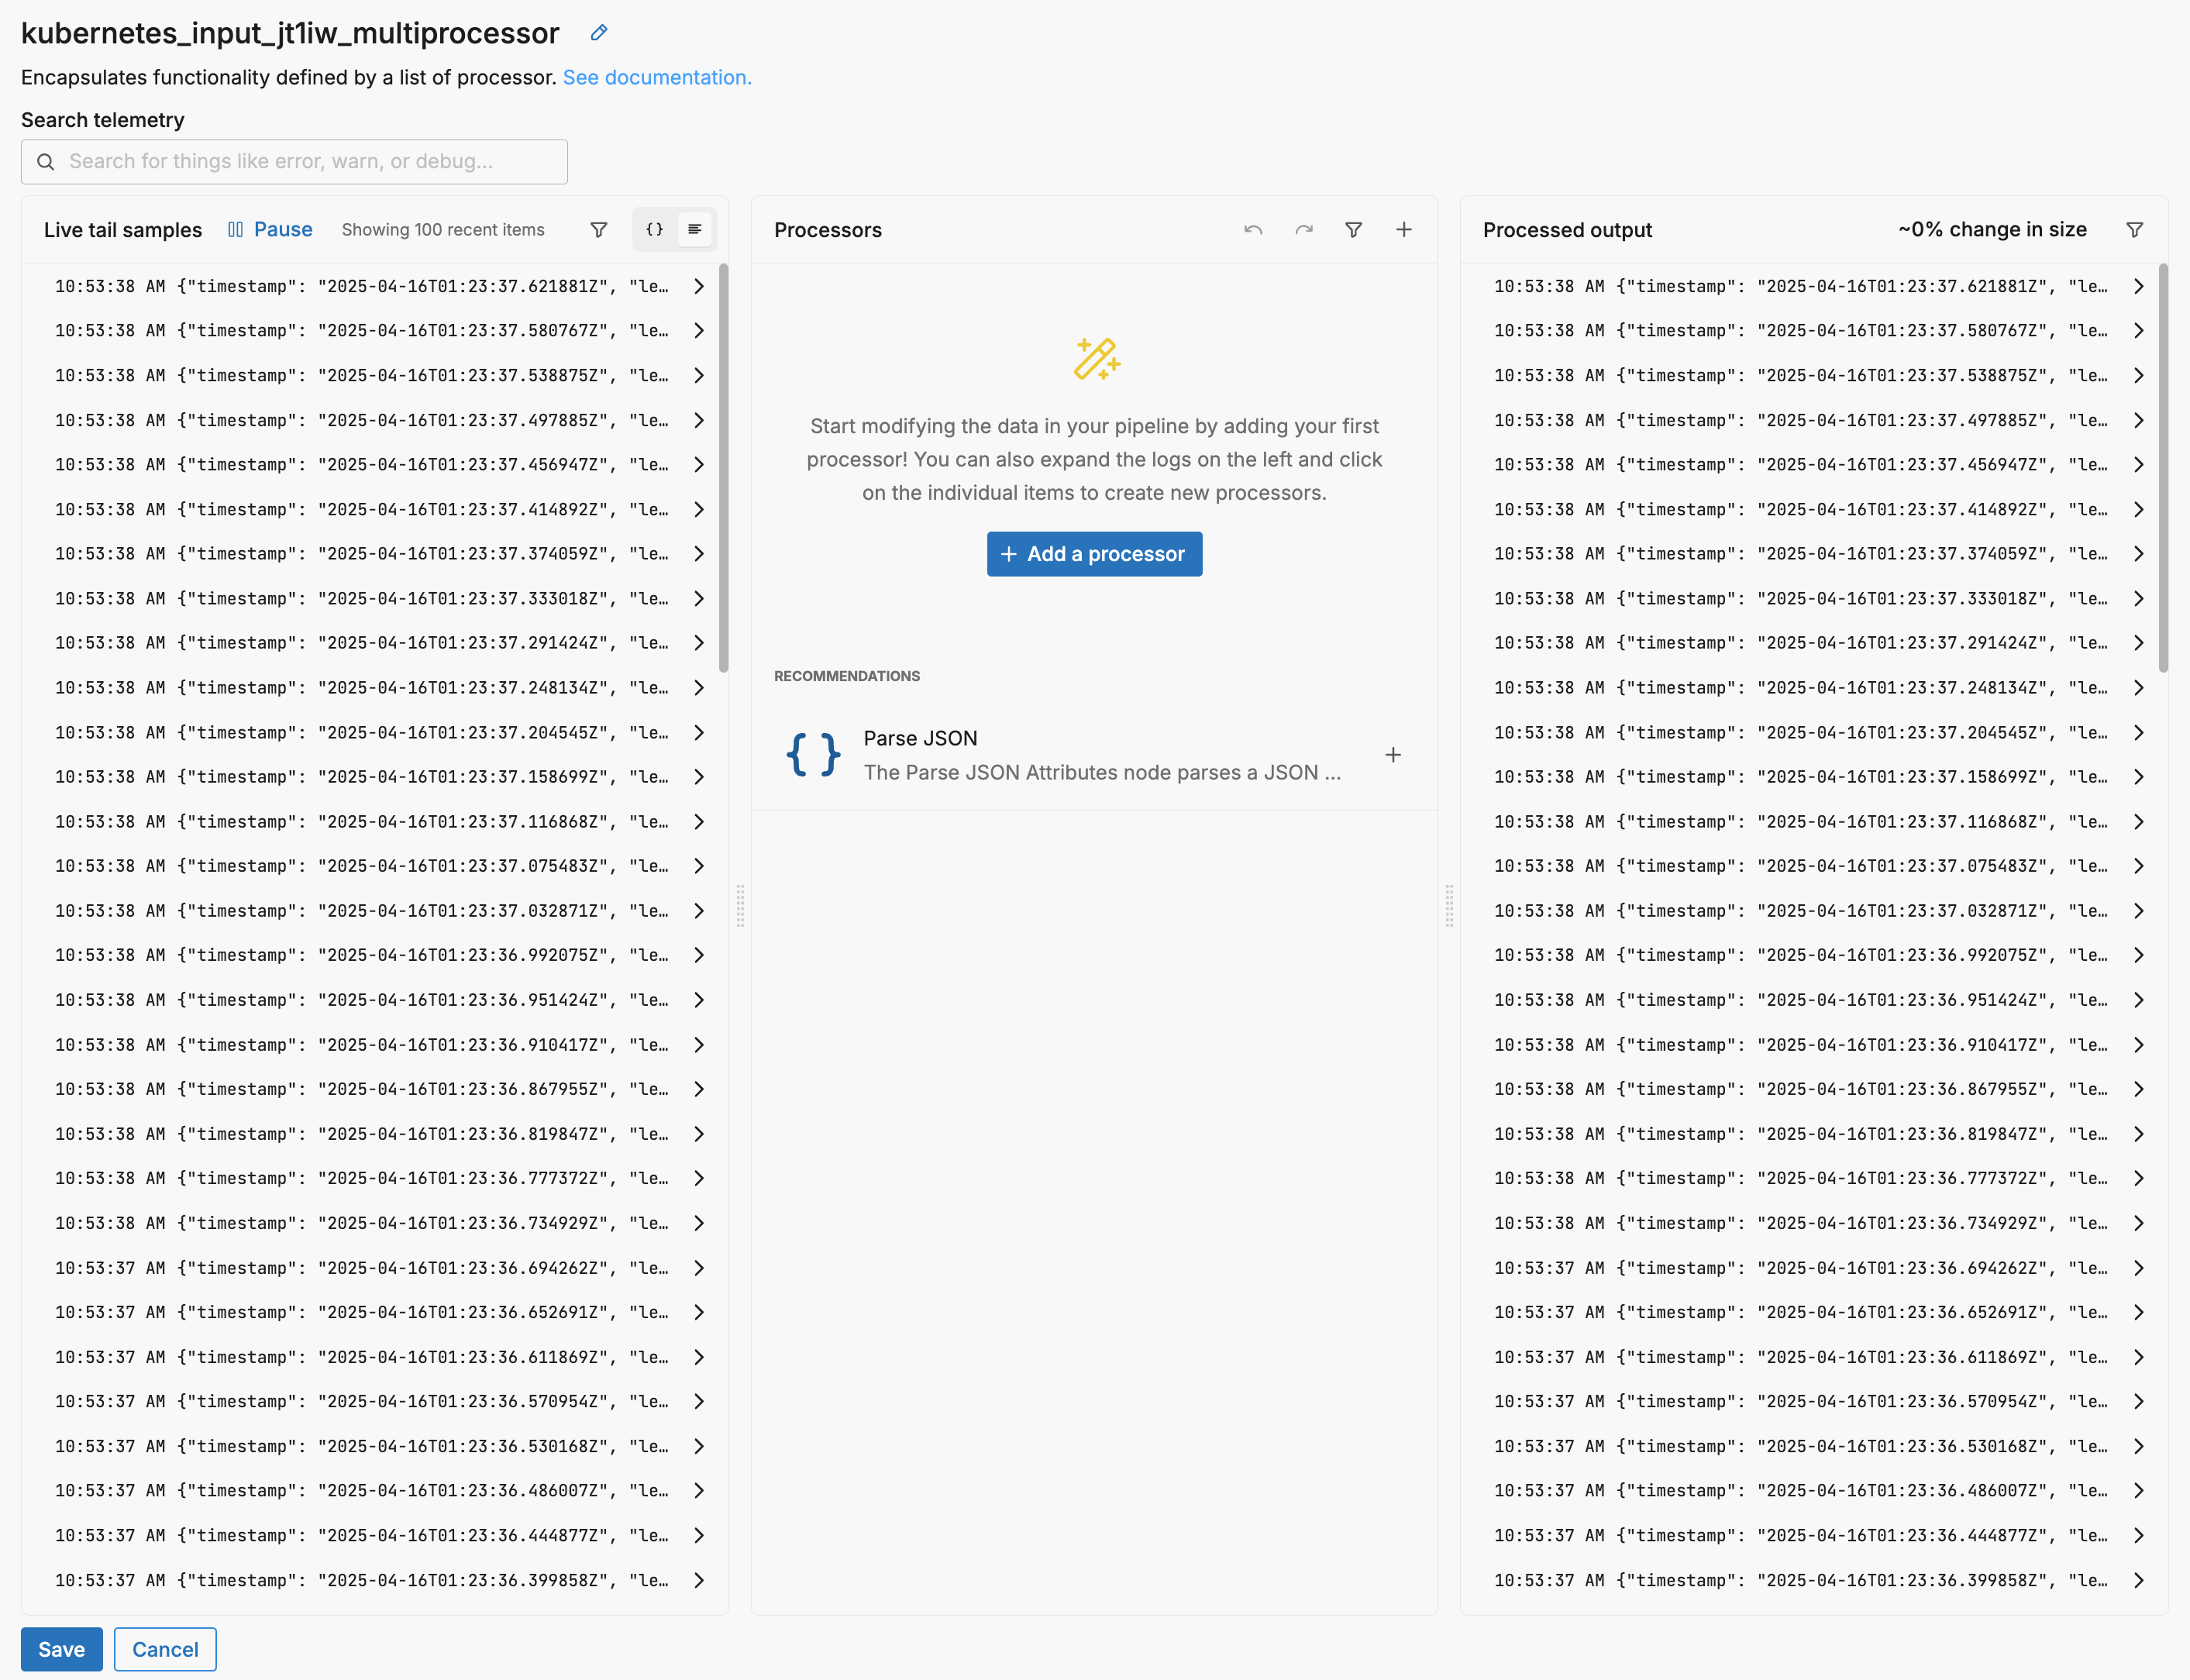
Click the + icon to add the recommended processor or click + Add a processor to add a different processor.
In this example the Parse JSON processor is added to the multiprocessor.
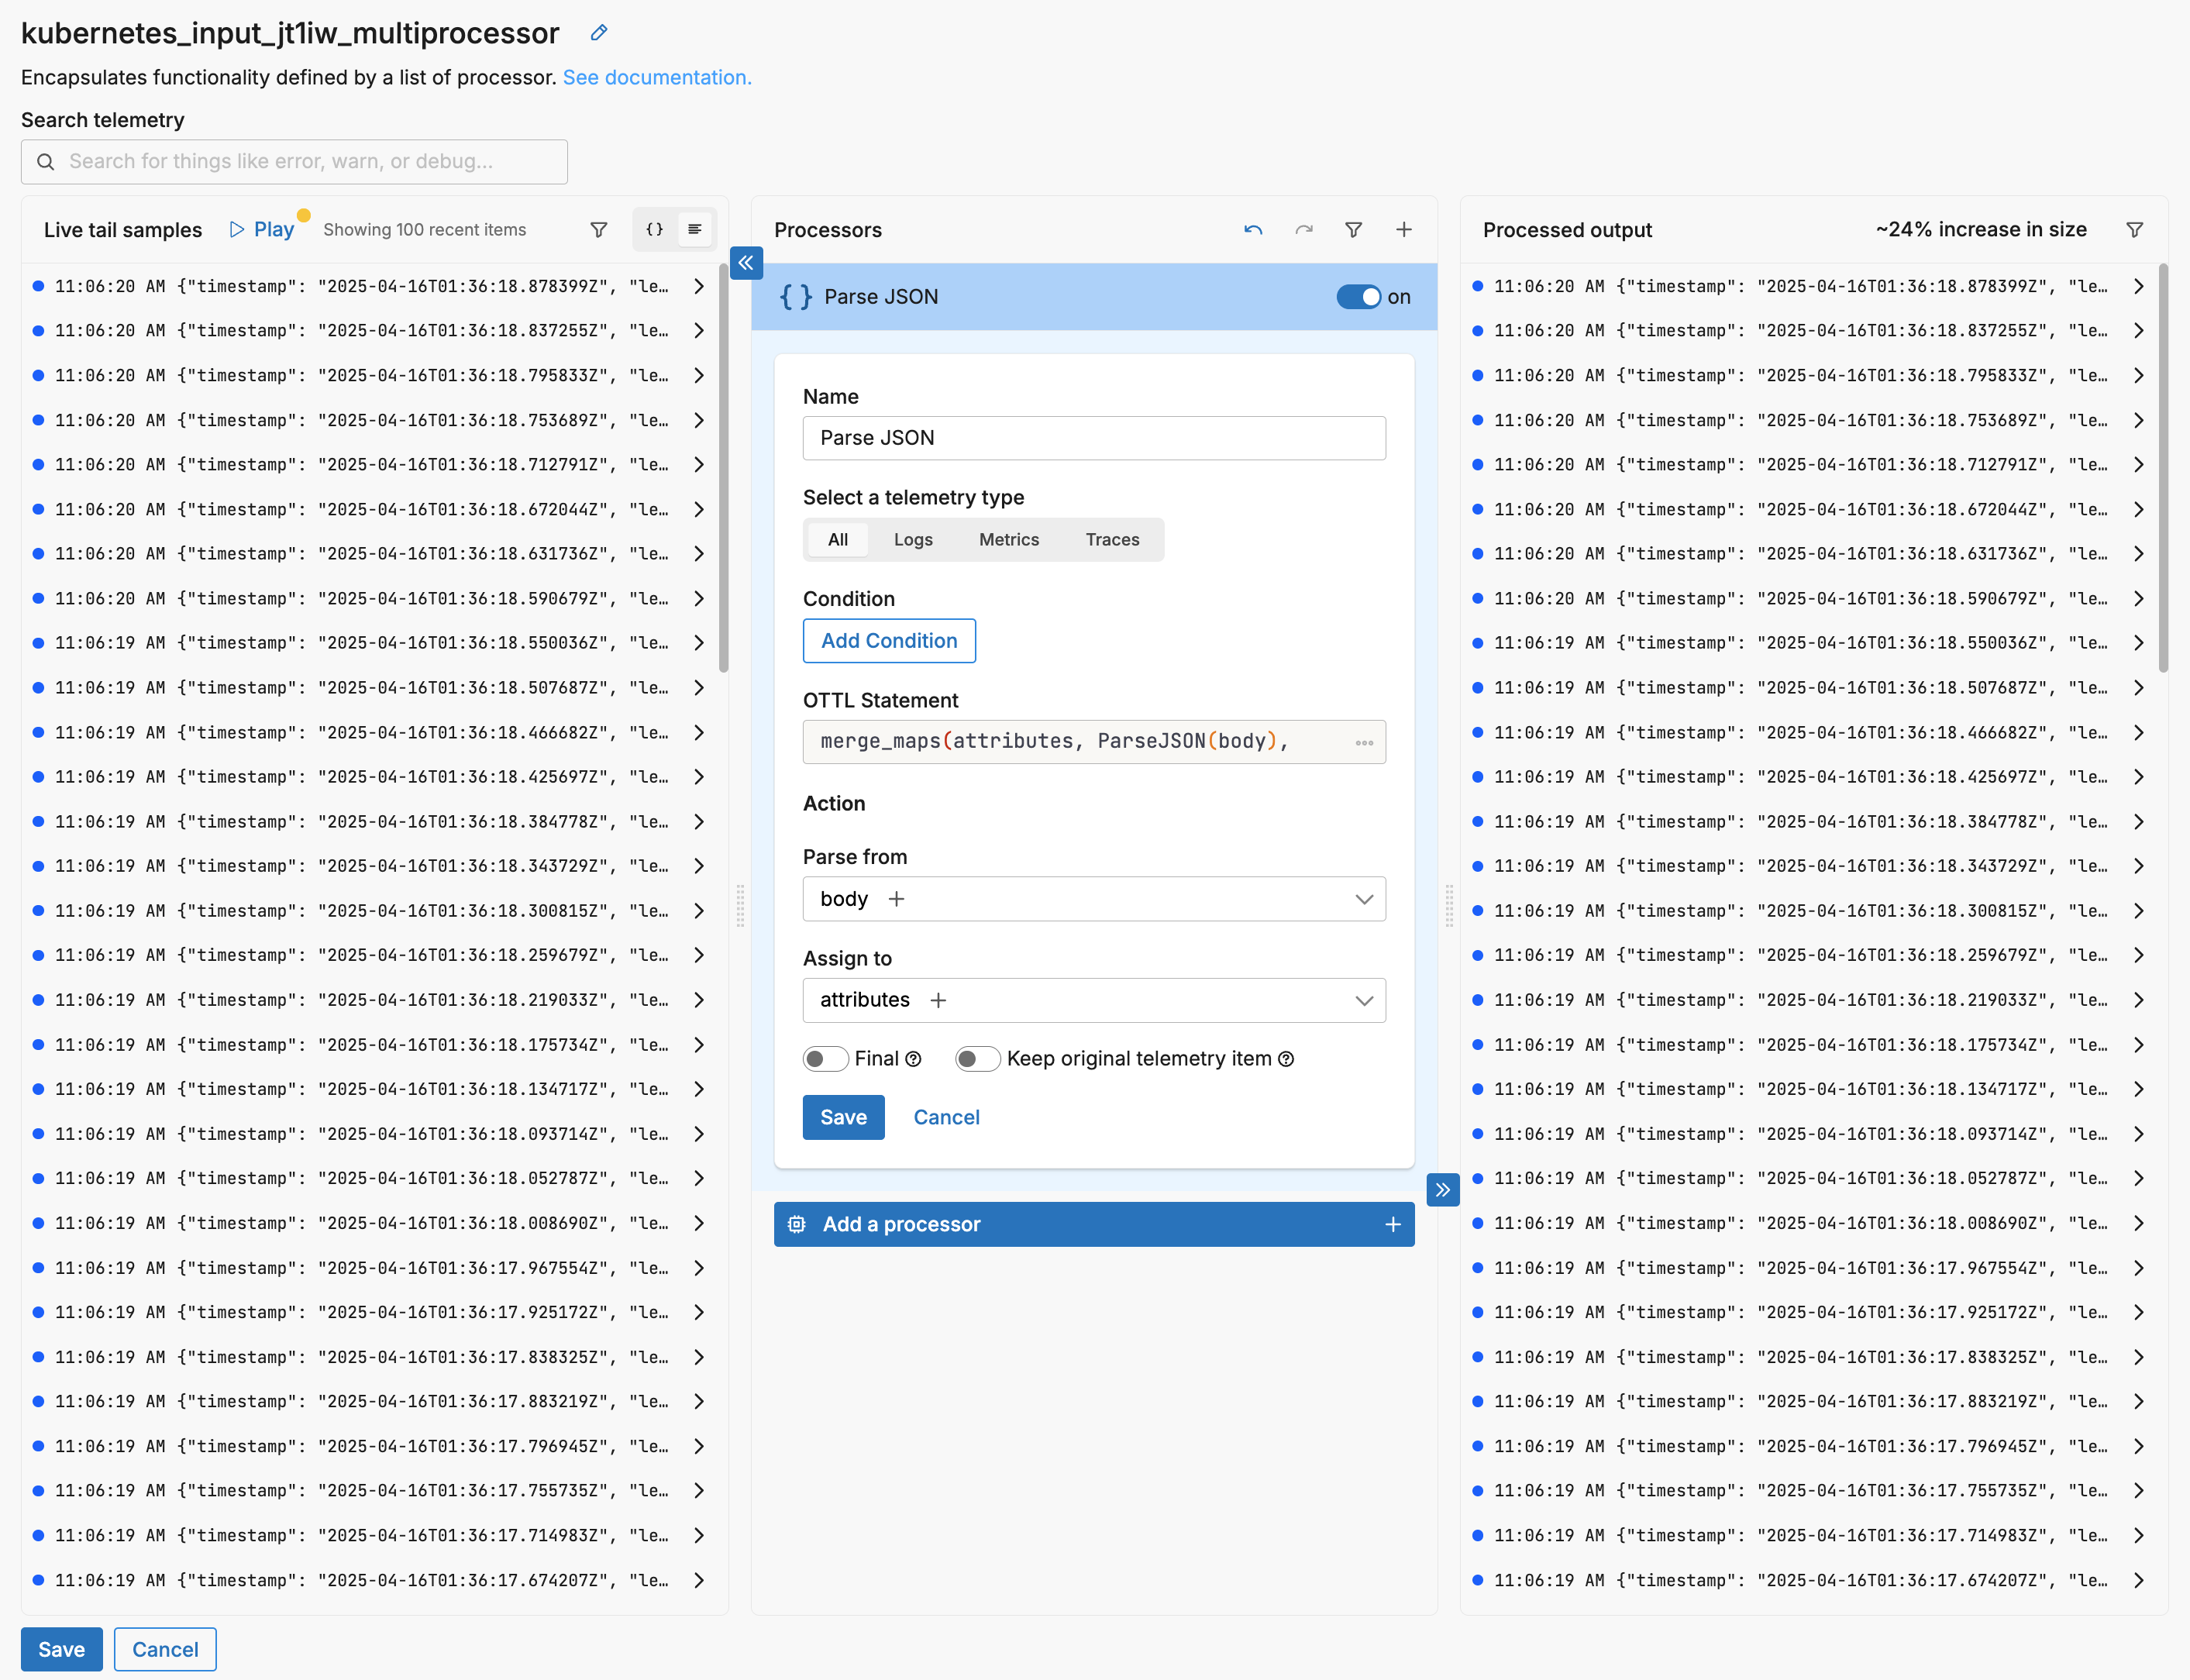
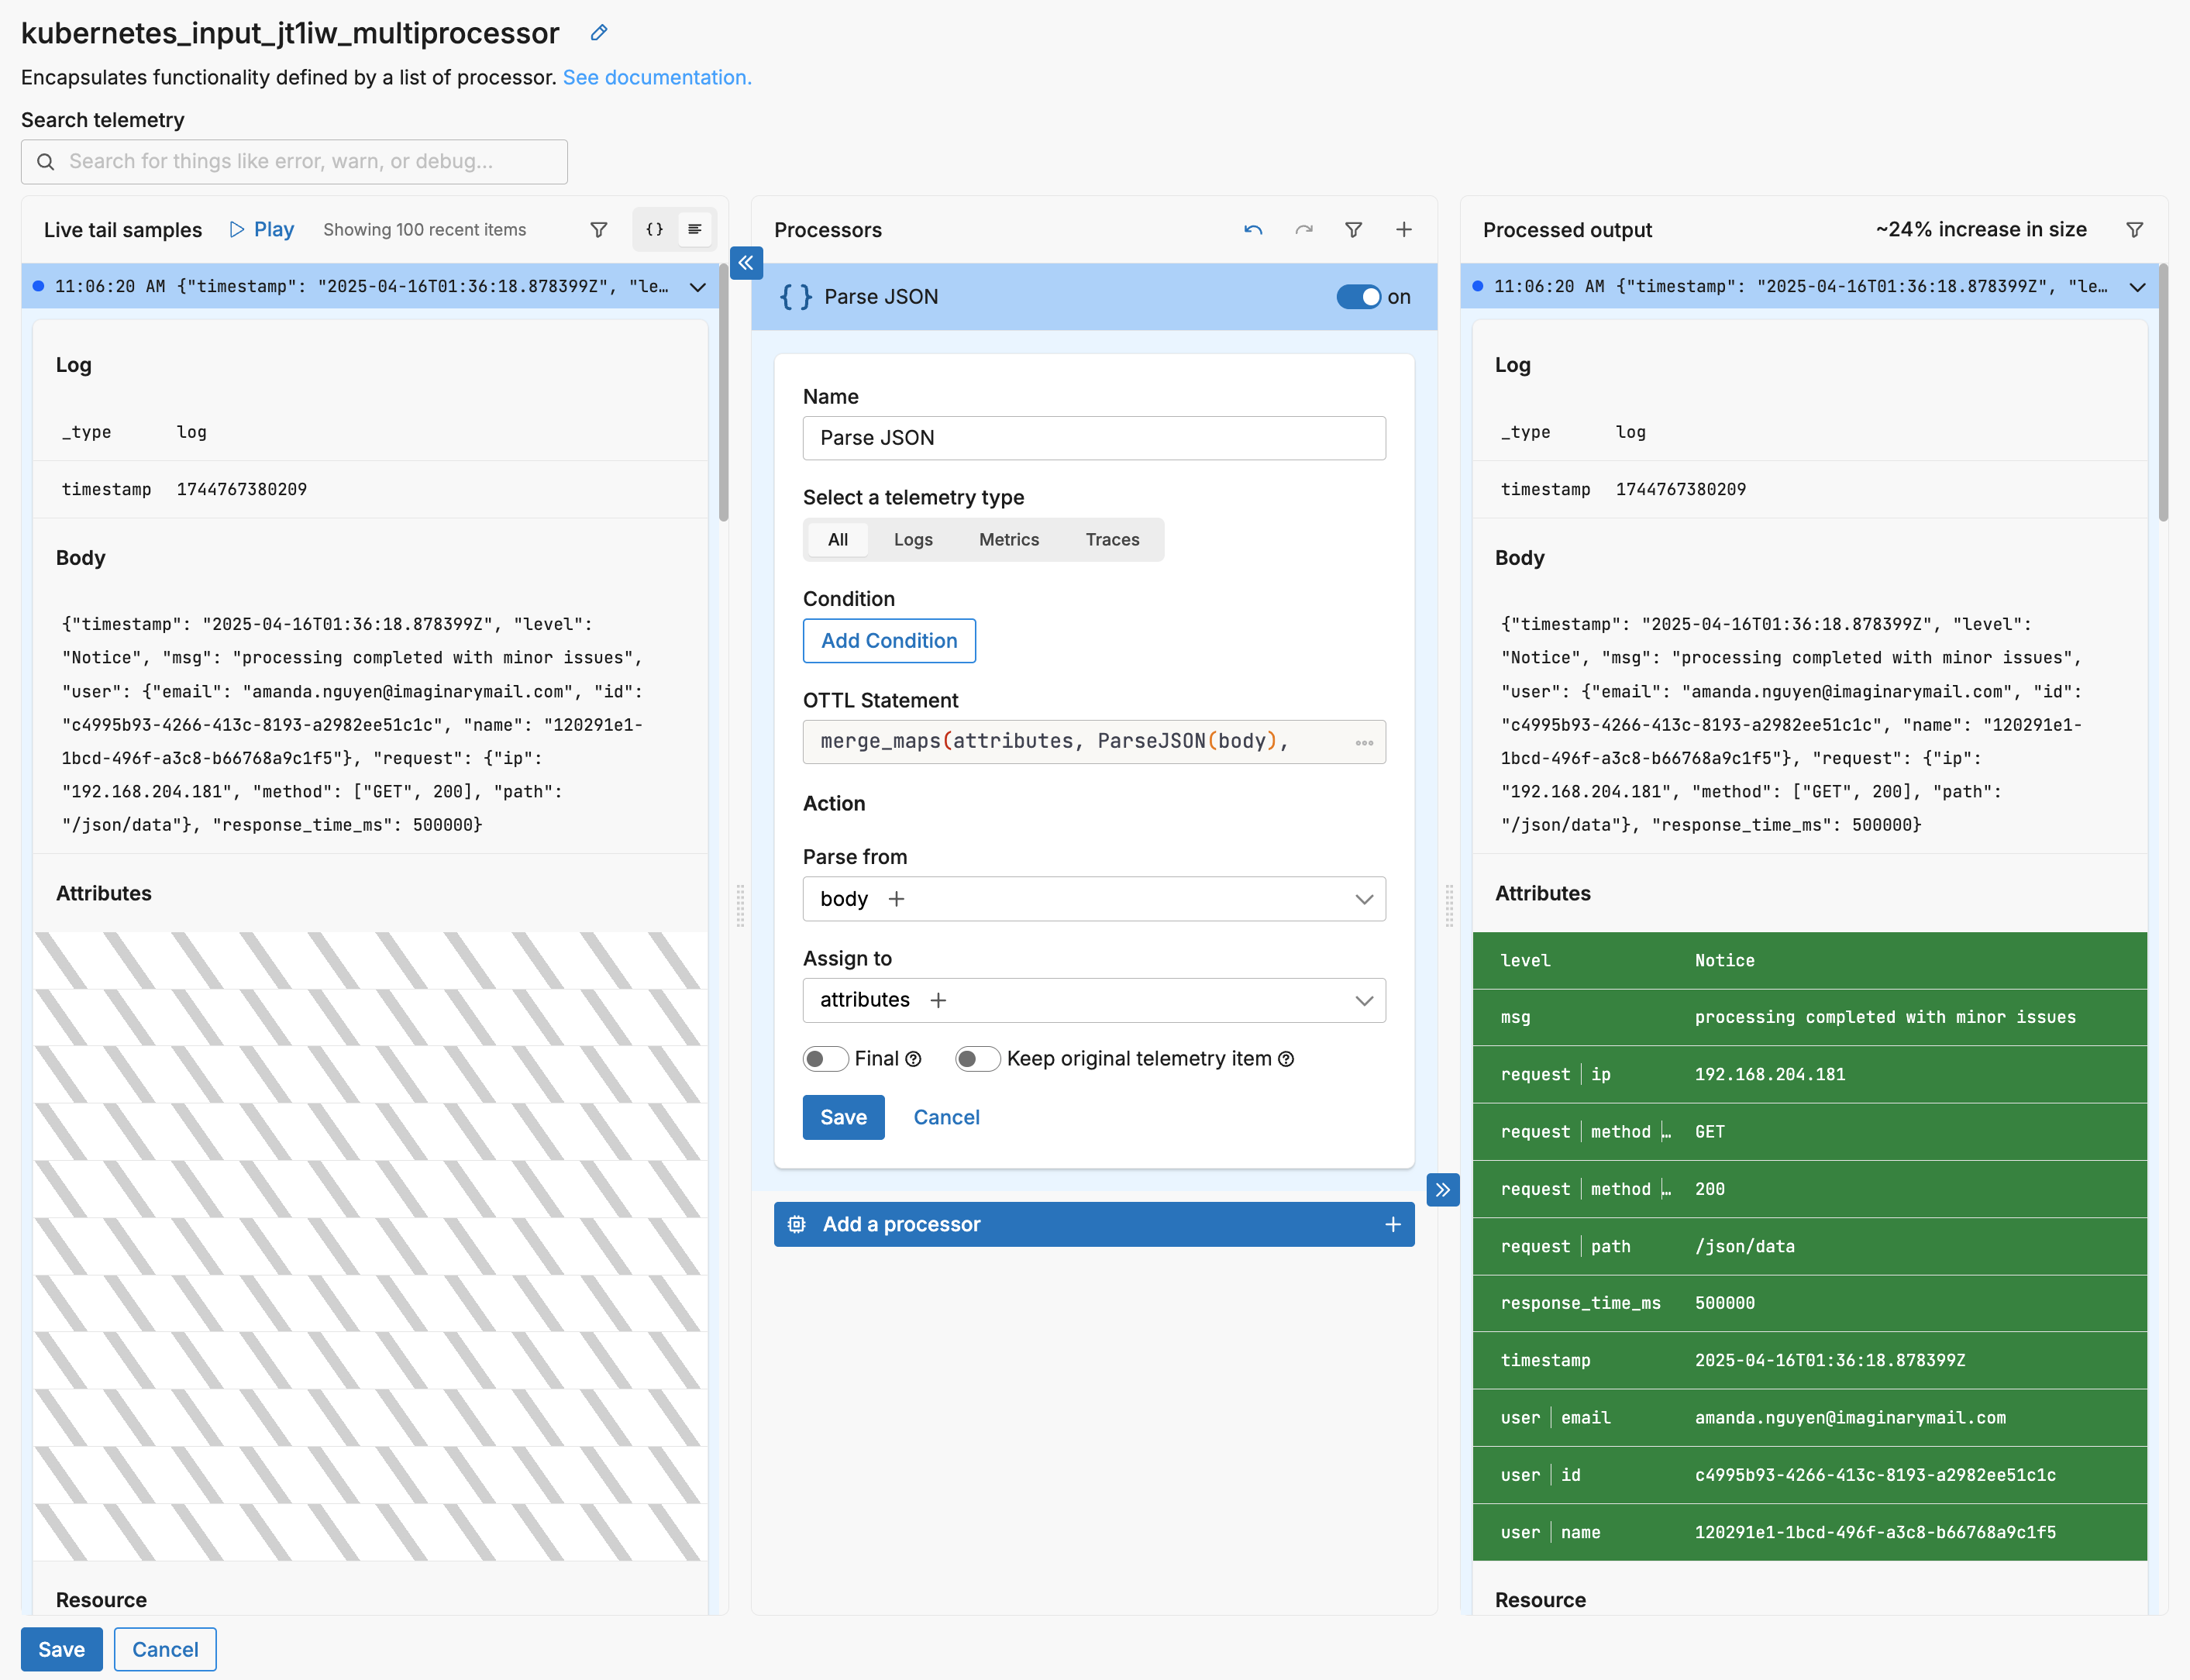
If you select a log in the input pane, the resulting log is shown in the output. Note the green diff block showing the parsed attributes, as well as the 24% increase in data item size:
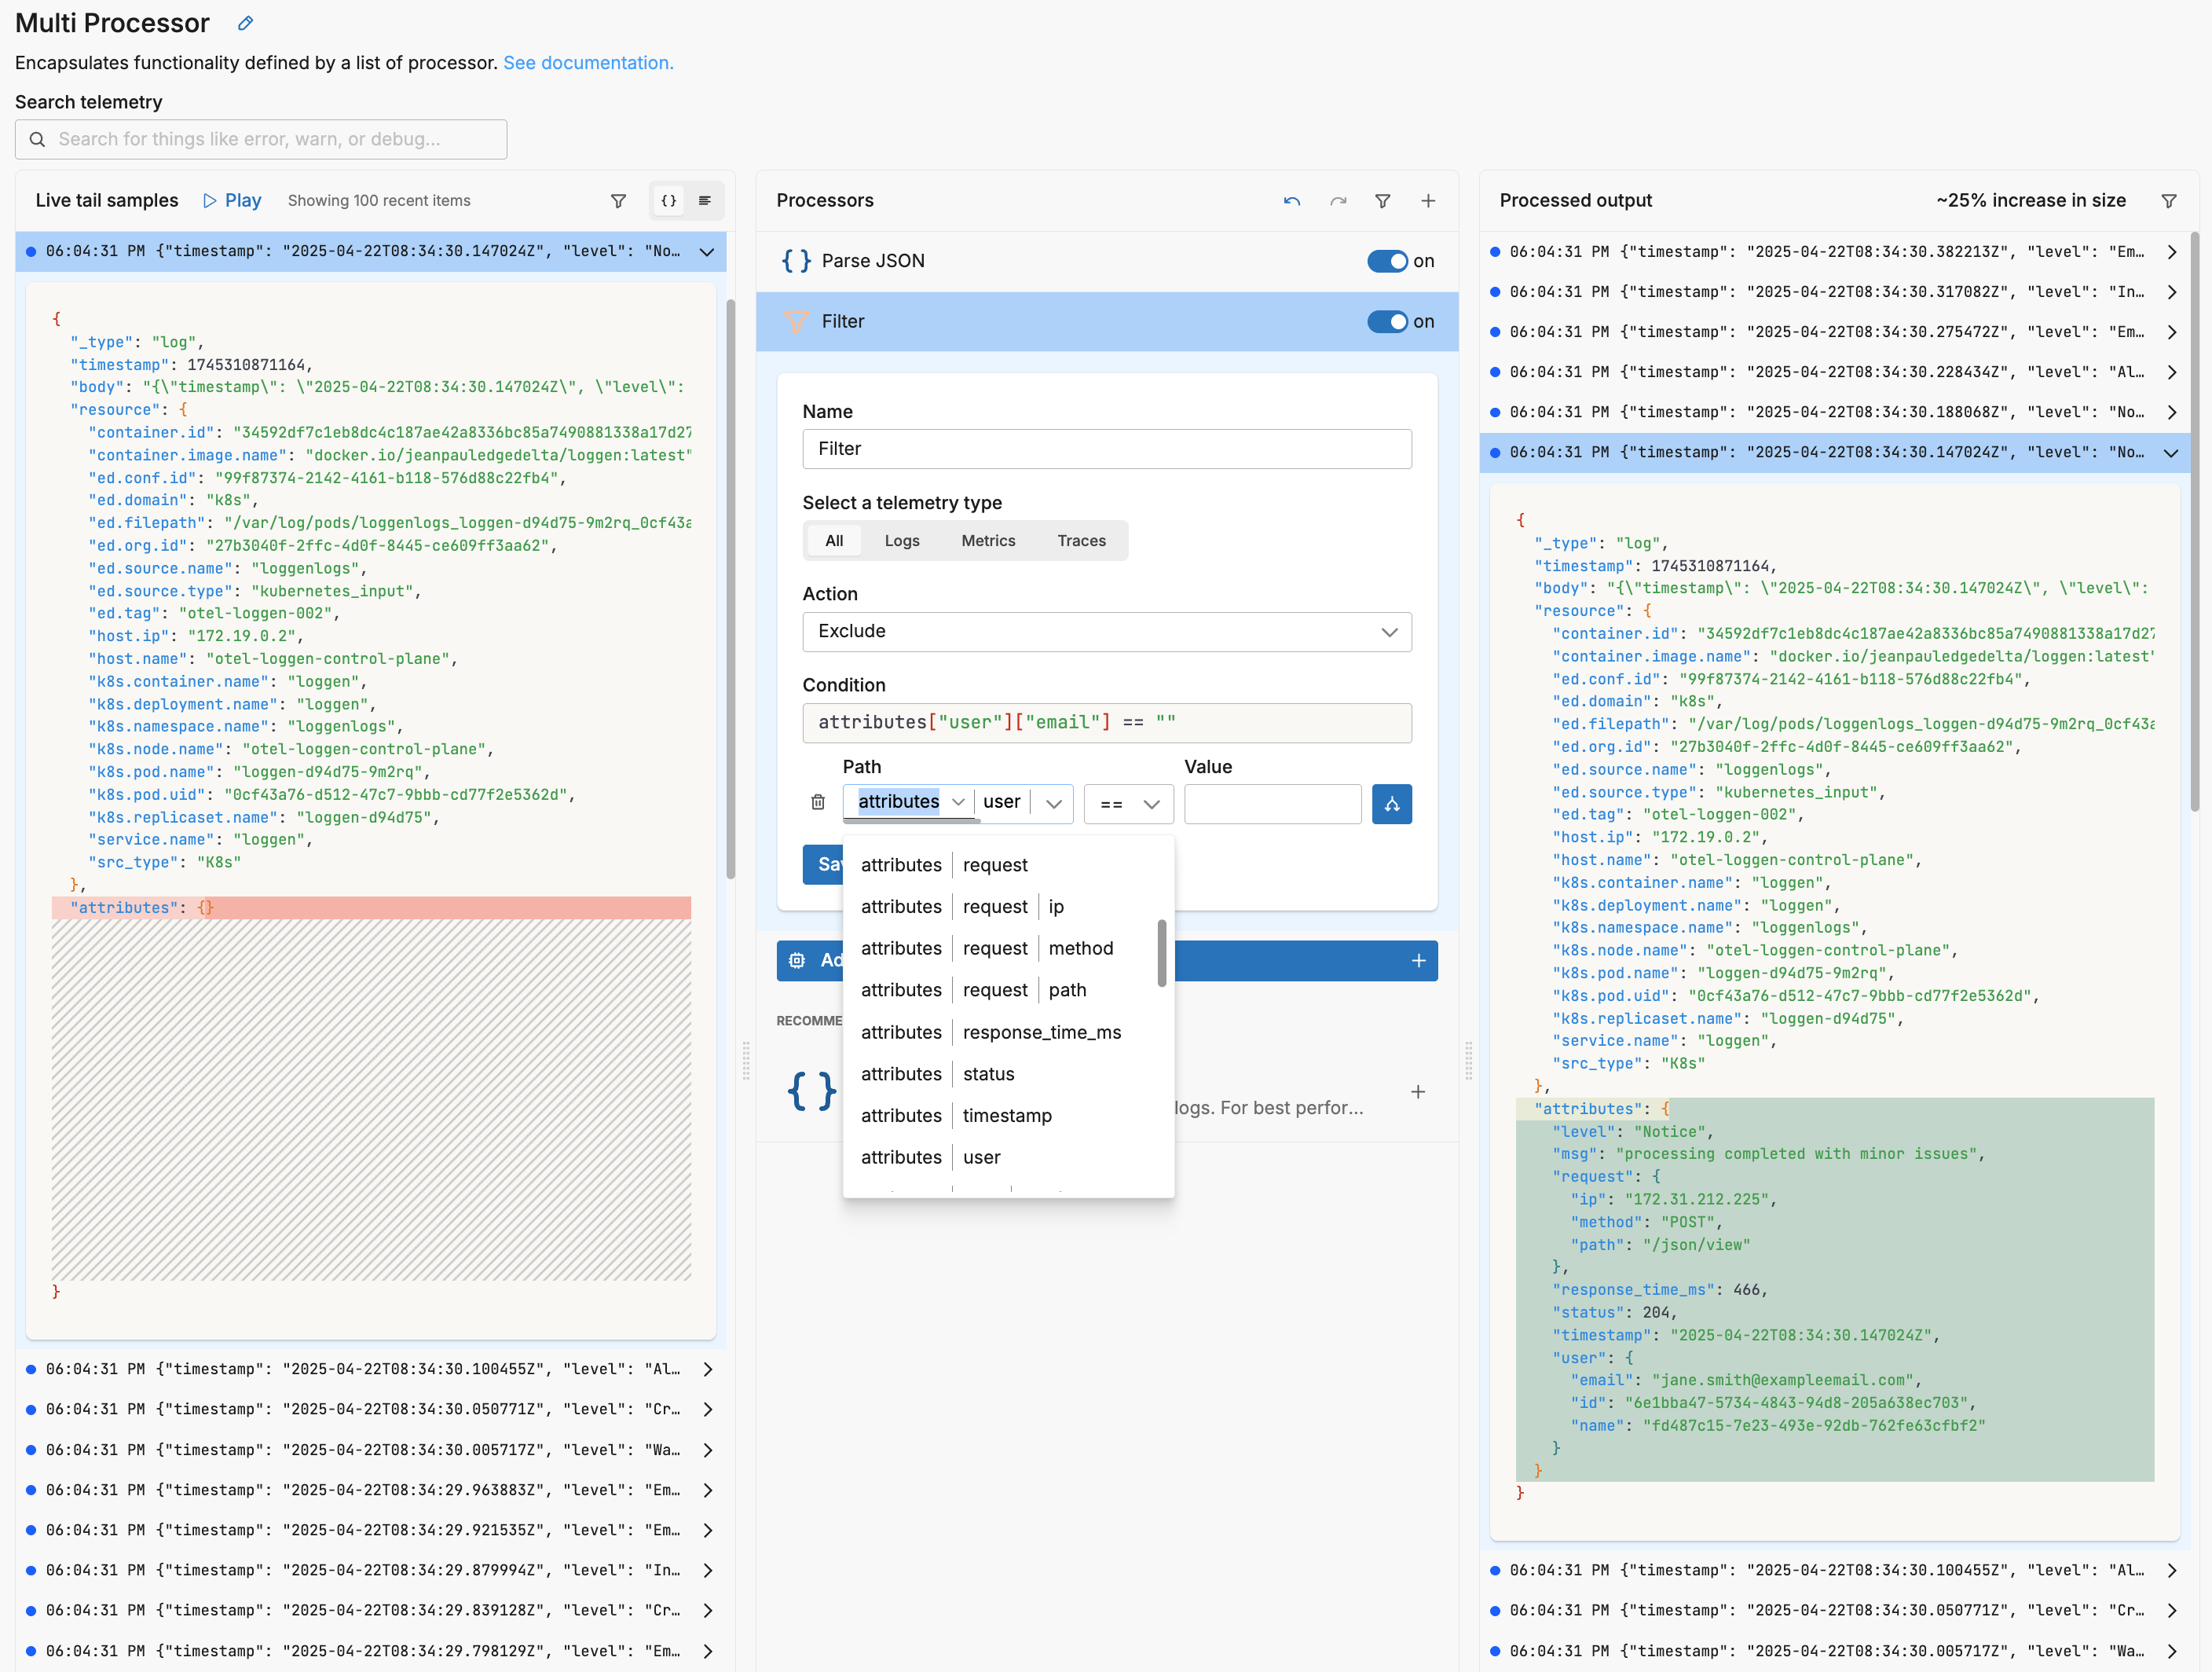
Autocomplete
As you specify fields, the fields detected in the live capture sample are offered by autocomplete:
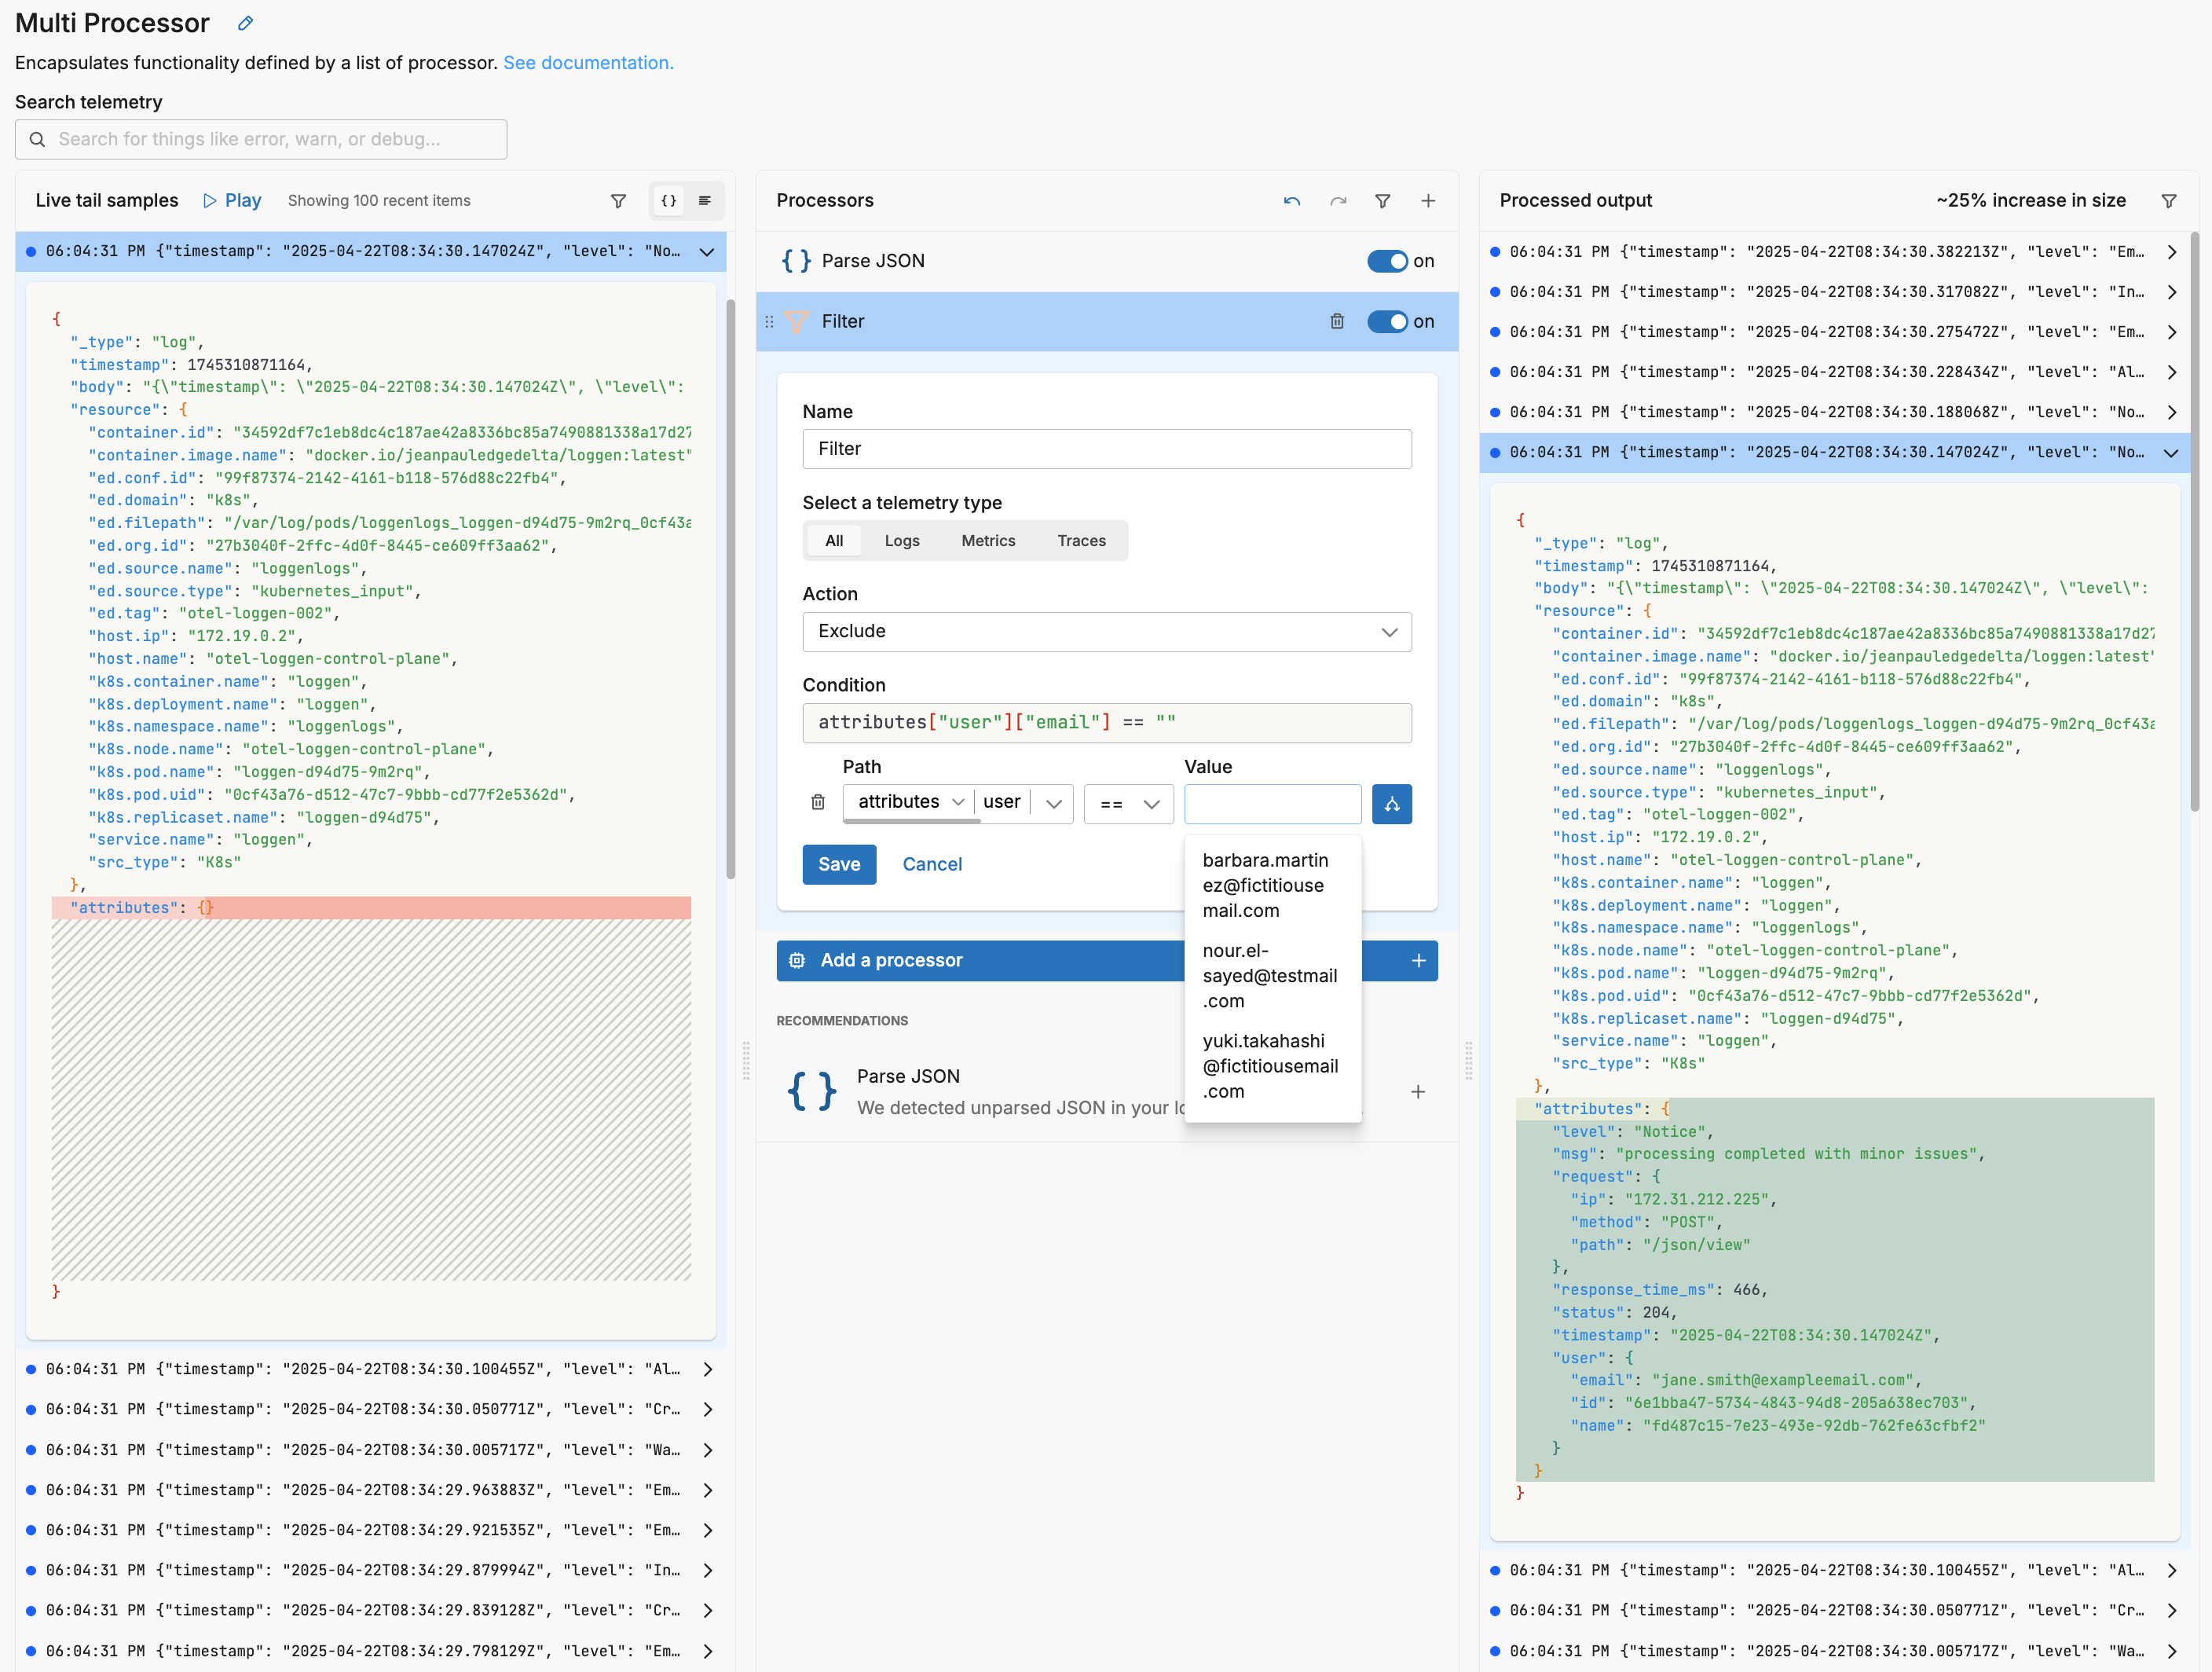
Similarly, as you specify values, autocomplete offers samples based on the live capture sample.
Configure with Natural Language
Edge Delta’s AI-powered natural language configuration enables you to create complex OTTL (OpenTelemetry Transformation Language) statements by simply describing what you want to achieve in plain English. This feature eliminates the need to learn OTTL syntax while still leveraging its powerful transformation capabilities.
How It Works
The AI assistant analyzes your natural language description and generates precise OTTL statements that transform your telemetry data, working with all OTTL field contexts including attributes, resource, body, and timestamp fields.
Step-by-Step Configuration
- Add a Custom Processor: In your multiprocessor node, click + Add a processor and select Custom.
- Configure Basic Settings (Optional): You can select a telemetry type filter to process specific data types, specify conditions using the GUI condition builder, and enable the Final option if processed items should exit the node immediately.
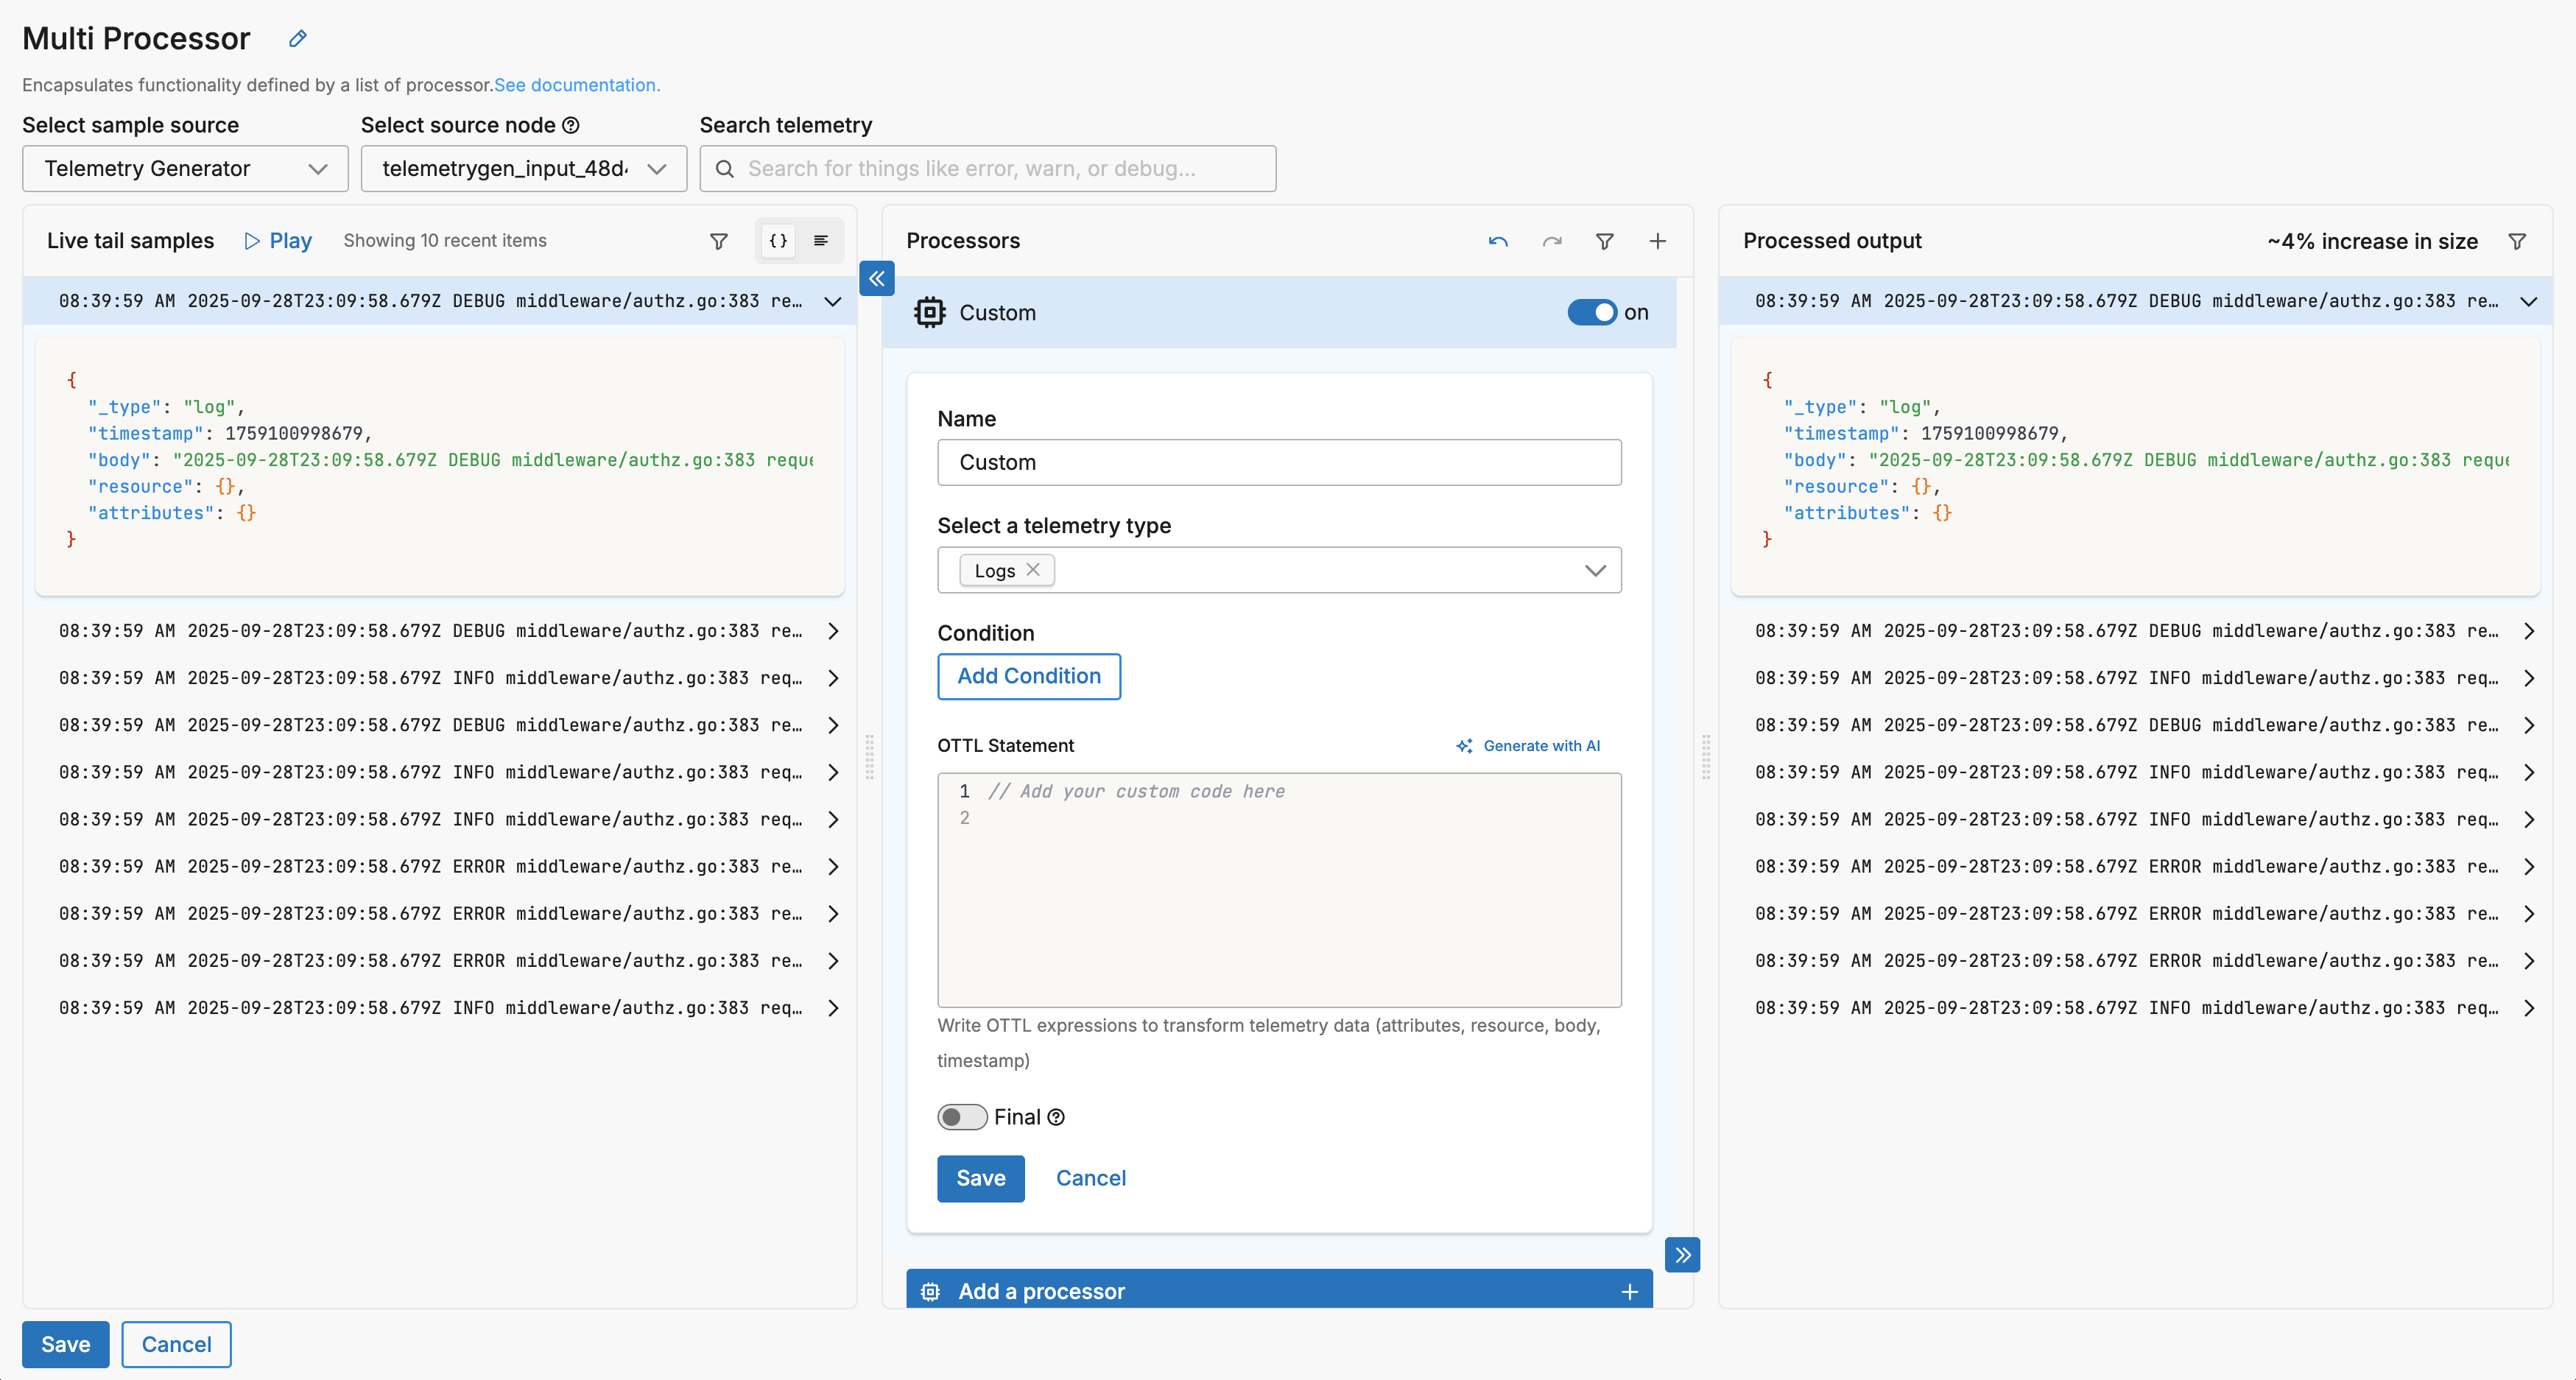
- Generate OTTL with AI: In the OTTL statement area, click Generate with AI to open a modal dialog with the AI configuration interface.
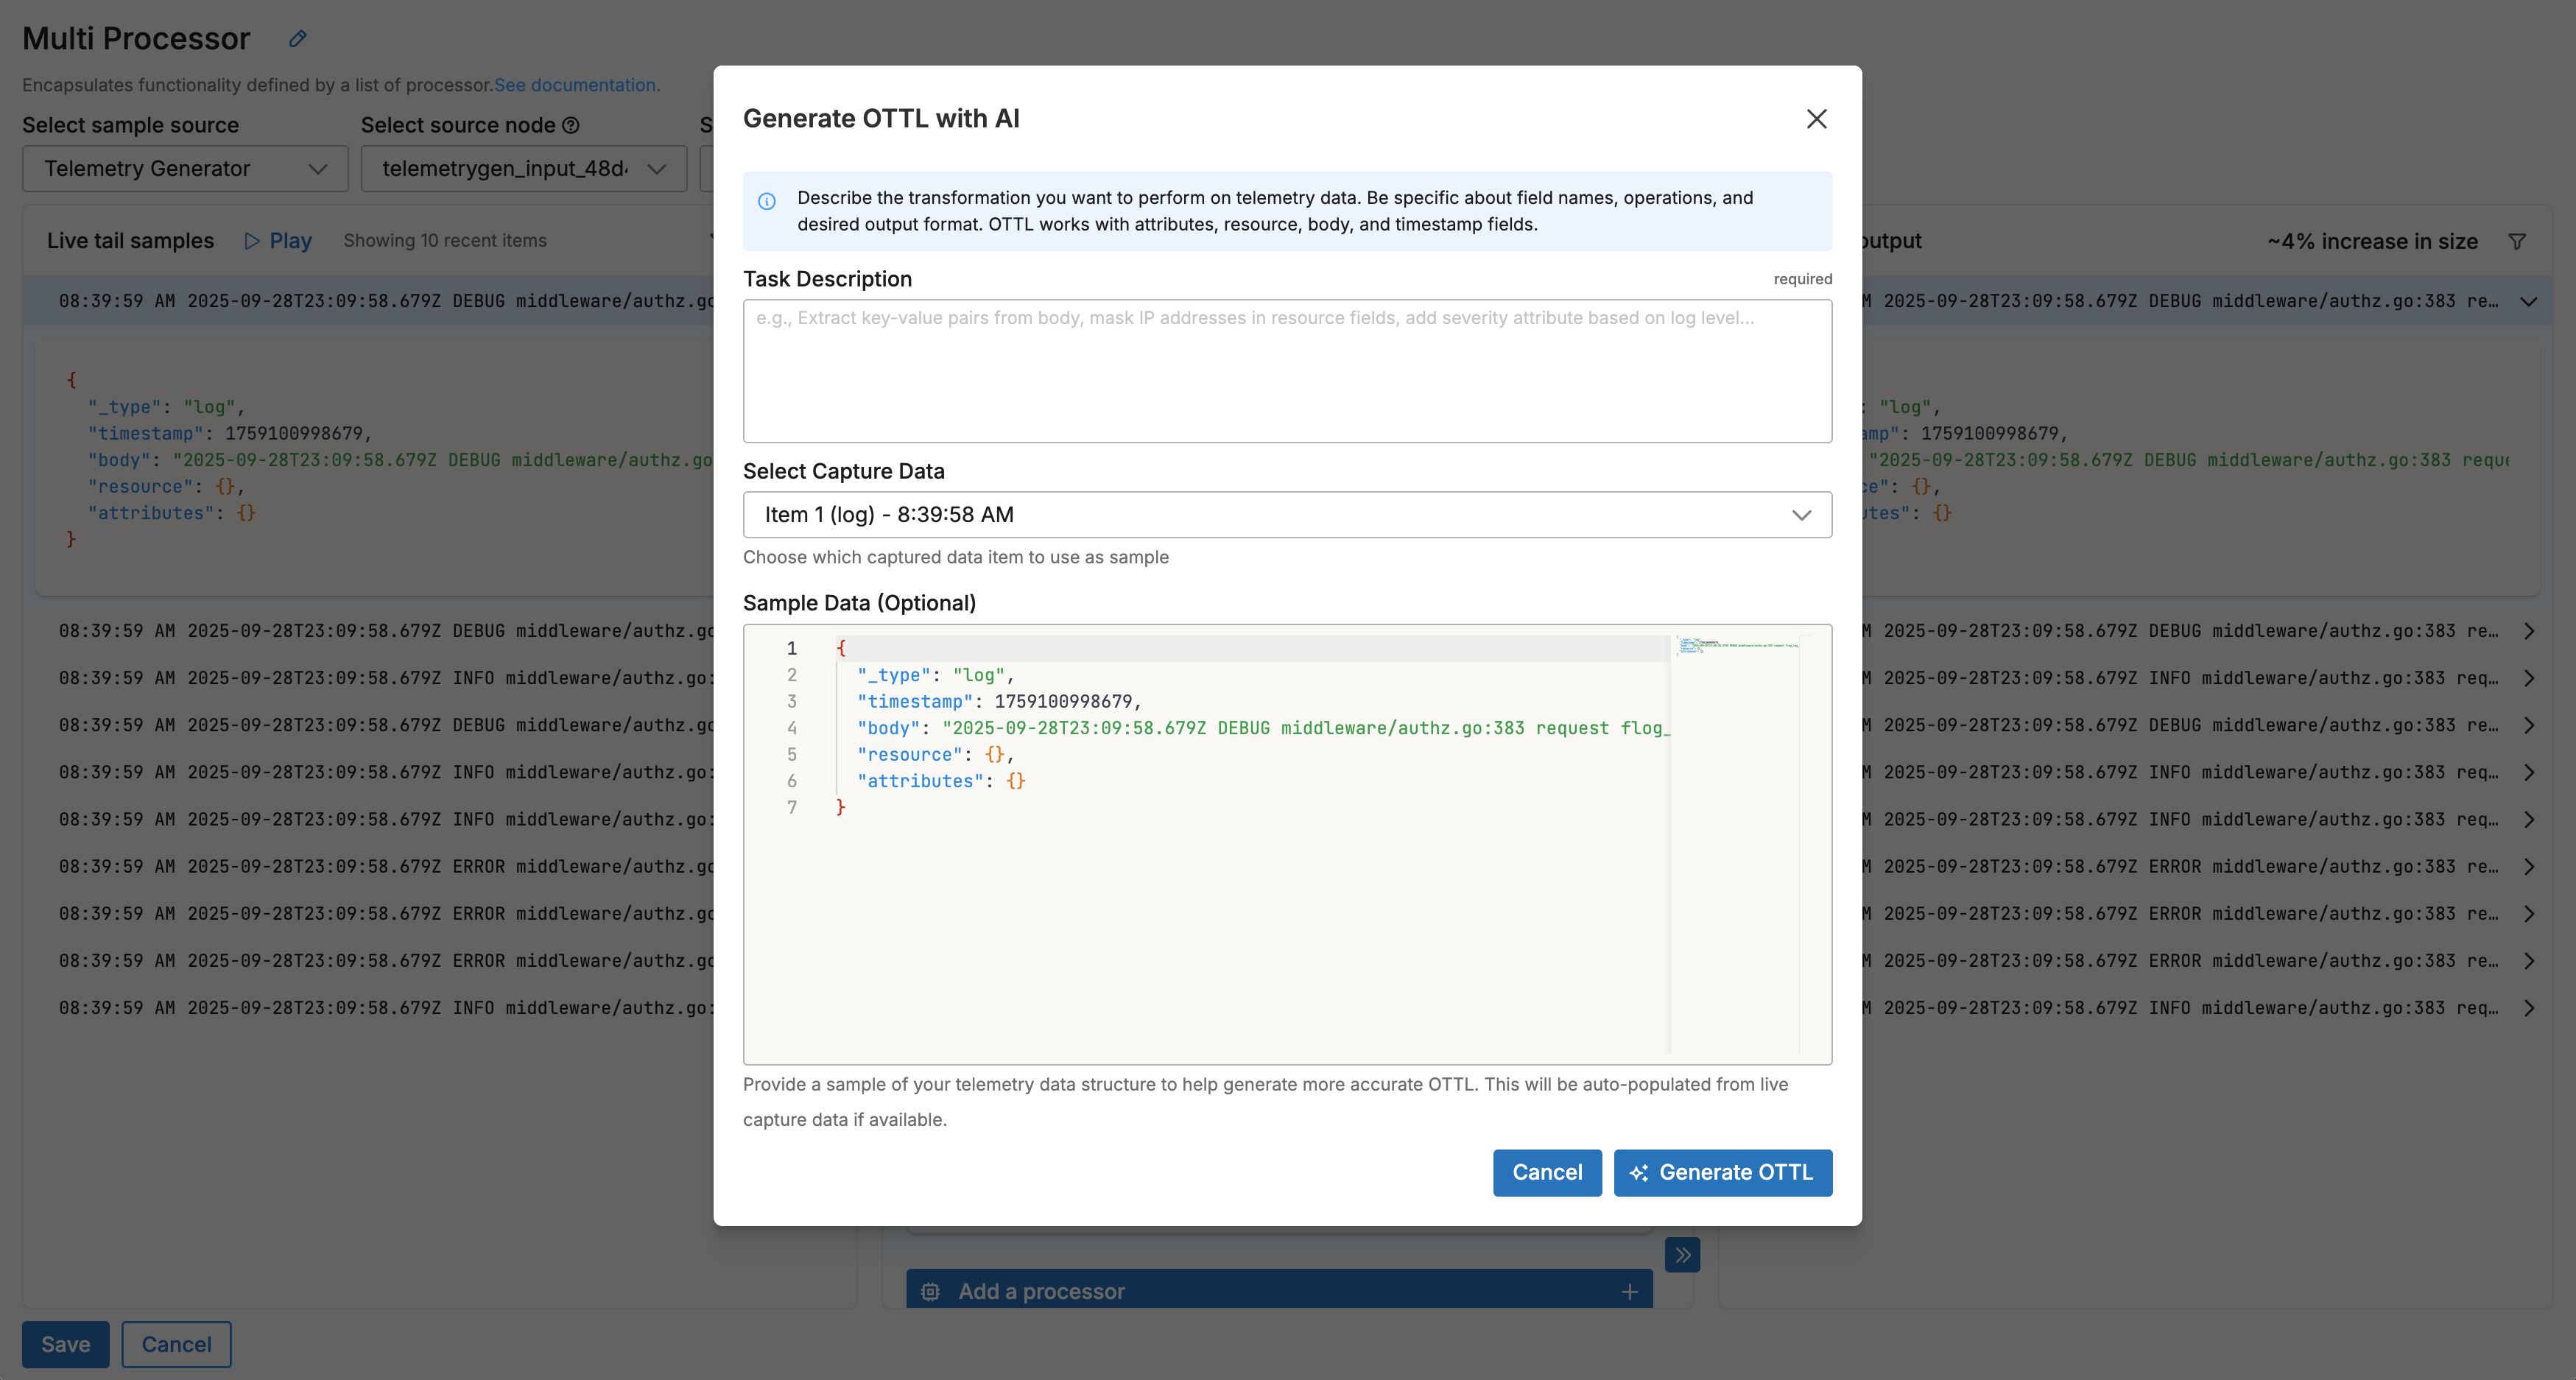
- Describe Your Transformation: Select a data item from Live Capture to view available field names (recommended), then in the task description field, describe the transformation you want to perform, being specific about field names, operations, and desired output format while referencing the appropriate OTTL contexts (attributes, resource, body, timestamp).

- Generate and Apply: Click Generate OTTL to create the statements, which are automatically applied to your Custom processor, then review the processed output in the Live Capture pane to verify results.
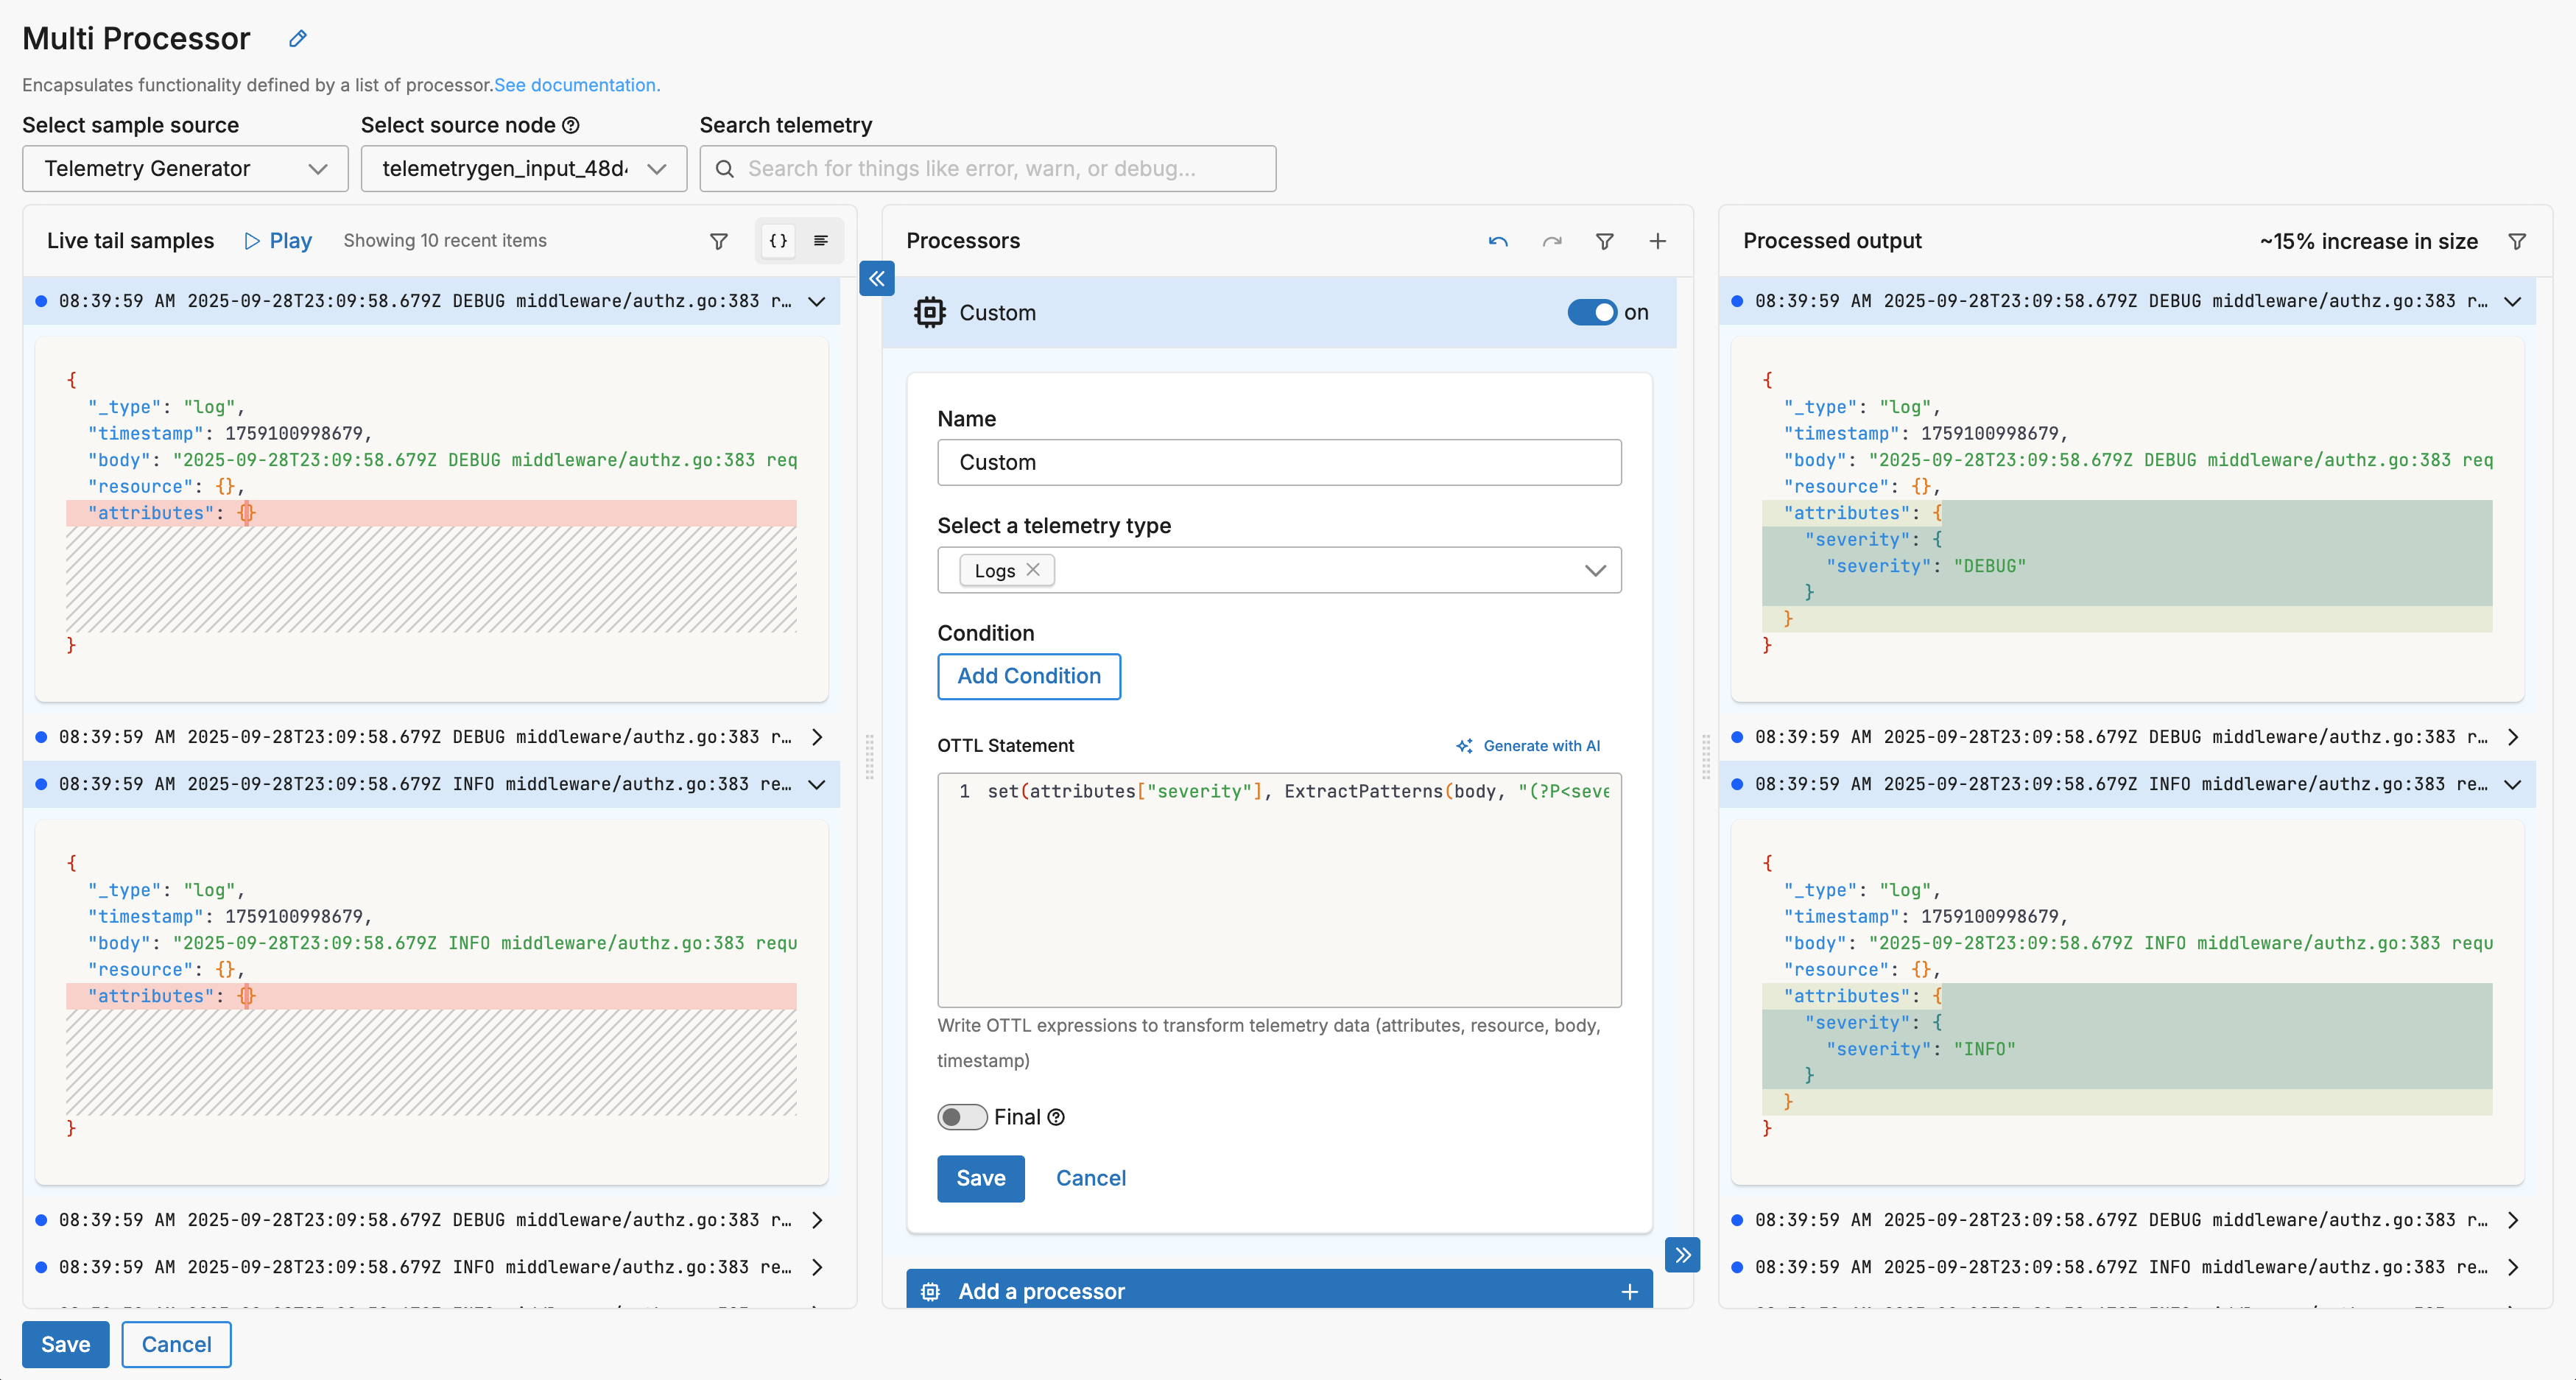
The AI generates OTTL statements based on your natural language description, which you can see applied in the Custom processor configuration:
Writing Effective Task Descriptions
Good task descriptions are specific and reference the exact operations you need. Here are examples of effective descriptions:
- “Extract key-value pairs from the body field and add them as attributes”
- “Mask IP addresses in the resource.host field using regex”
- “Add a severity attribute based on the log level in attributes.level”
- “Parse JSON from the body and extract the error.code field as a new attribute”
- “Convert timestamp to ISO 8601 format and add as attributes.formatted_time”
- “Remove all attributes that start with ‘debug_’ prefix”
- “Concatenate attributes.service and attributes.version into a new attribute.service_version field”
Best Practices
Iterate and Refine: Generate initial OTTL, test with Live Capture, then refine your description if needed.
Combine with Other Processors: Natural language-generated Custom processors work seamlessly in your processor stack. Consider the processing order when adding multiple transformations.
Validate Output: Always review the generated OTTL and test with multiple data samples in Live Capture before saving your configuration.
Tips for Complex Transformations
- Break complex transformations into multiple Custom processors for clarity
- Use the generated OTTL as a starting point and manually refine if needed
- Reference the OTTL documentation to understand the generated statements
- Create Packs for reuse across pipelines
Sequence Processors
Processors within a multiprocessor node are executed sequentially in a top-down flow. This structure allows you to shape telemetry—logs, metrics, traces, and events—in a controlled, efficient manner. Each processor in the stack applies its logic to the data it receives from the previous processor.
You can think of a multiprocessor node as a mini-pipeline contained within a single pipeline node. It simplifies logic that would otherwise require chaining multiple standalone processor nodes.
Learn the foundational behavior and flow control rules in the Processors core concepts guide.
Processing Rules
The order of processors in the stack significantly impacts results. Each processor receives the data output from the processor before it. Depending on processor configuration, data may continue down the stack or exit the node early:
- Unprocessed Items Continue: If a data item doesn’t meet a processor’s condition (e.g., type mismatch or filter logic), it is passed unchanged to the next processor.
- Processed Items Are Transformed: When a processor modifies or enriches data, those changes become the input for the next processor.
- Final Option: If a processor has
Finalenabled, successfully processed items exit the multiprocessor immediately and are routed to the next pipeline node. Failed or unprocessed items continue through the remaining processors. - Keep Original Telemetry Item: This option causes the processor to emit both the original and the new item when it successfully transforms data. This is useful for processors like Extract Metric, where retaining the original log may still be valuable downstream.
Practical Example
Suppose your processor stack includes:
- Extract Metric with
Keep Original Telemetry Itemenabled - Add Field
- Parse JSON with
Finalenabled - Filter to remove items tagged
type=test
Here’s how telemetry flows:
- A log generates a metric via Extract Metric. Since
Keep Original Telemetry Itemis enabled, both the metric and original log move to Add Field. - Add Field adds a
type=testtag to both items, and they proceed to Parse JSON. - Parse JSON only operates on logs. It parses the log and emits a new item. Because
Finalis enabled, the parsed log exits the node early—bypassing the Filter processor. - The metric, which wasn’t modified by Parse JSON, continues to Filter, where it is dropped due to the
type=testcondition.
This setup demonstrates how processor sequence, combined with processor-level options, lets you fine-tune both transformation and routing logic.
Disable Processors
You can toggle specific processors in the sequence on or off. You might do this as you experiment with the sequence of processors, or when troubleshooting.
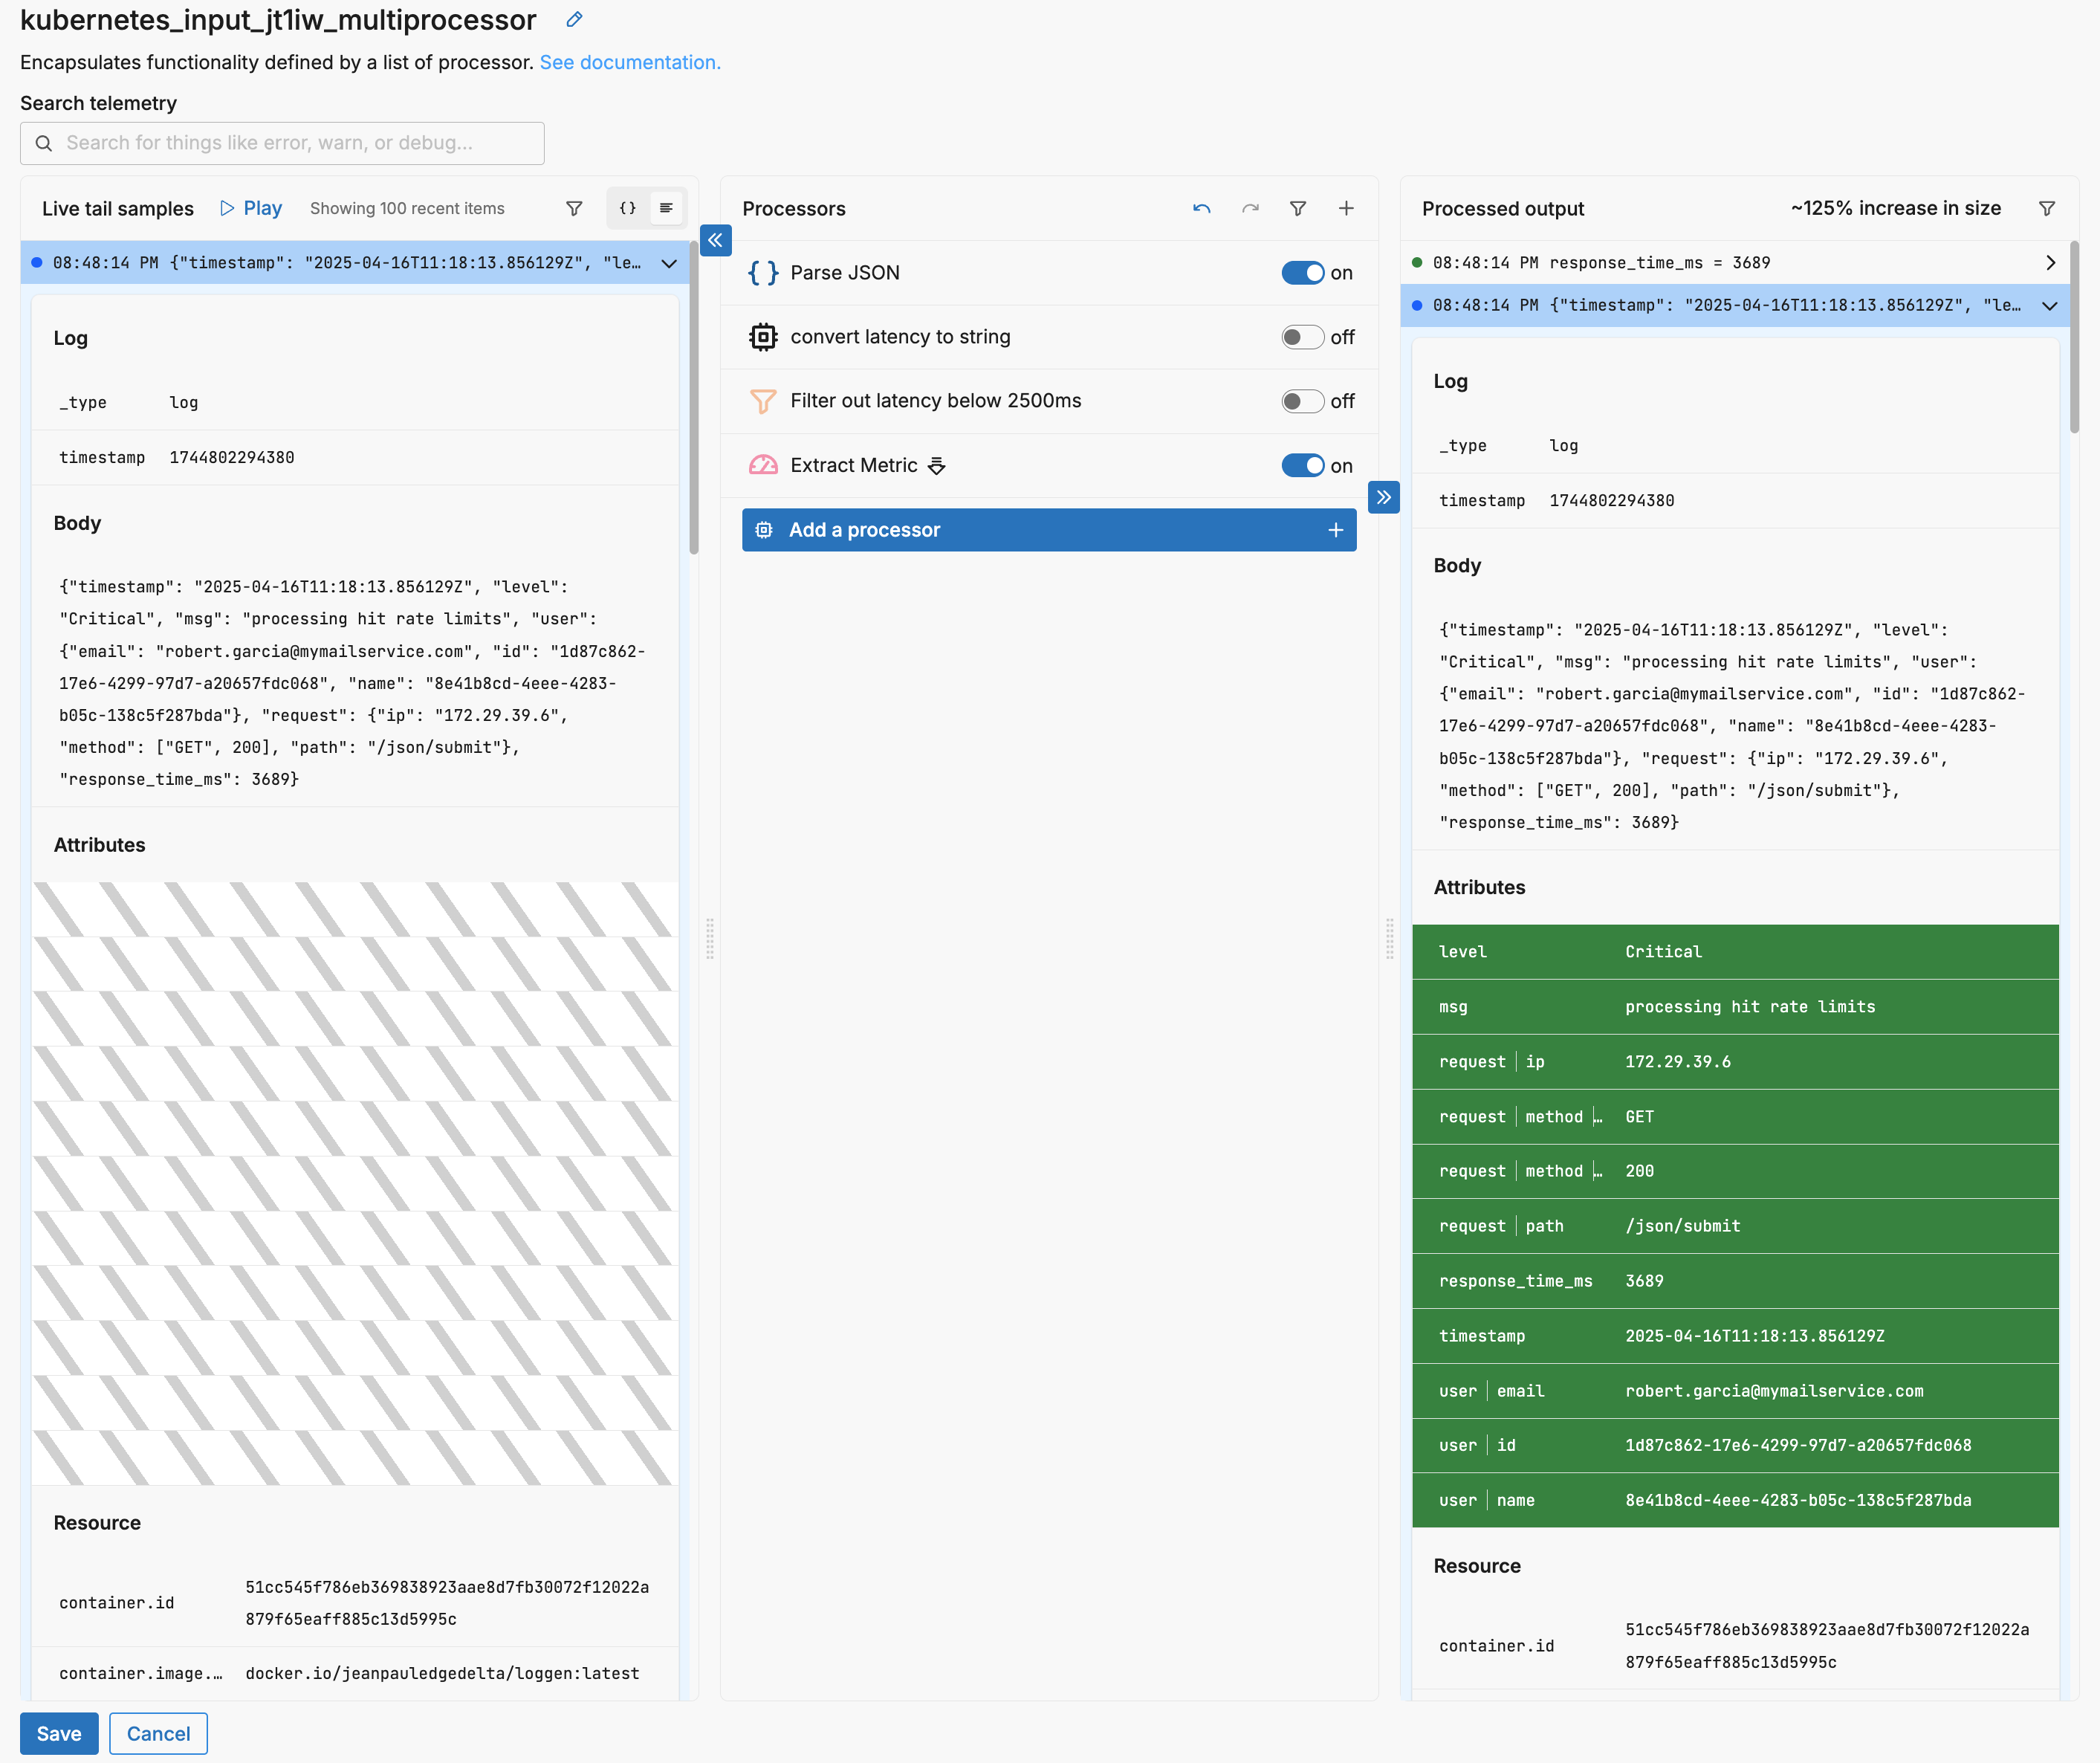
In this instance, the Extract Metric process is being used after parsing JSON but without string conversion or filtering.