Data Reduction
Explore strategies for reducing telemetry data volumes using Edge Delta's pre-index processing capabilities.
13 minute read
Overview
Data volume growth is one of the biggest challenges in modern observability. Edge Delta’s Telemetry Pipelines tackle this with pre‑index processing: transforming, filtering, and optimizing telemetry at the source—inside agents—before it hits expensive storage and indexing systems. By reducing data early, teams maintain visibility while controlling cost and avoiding downstream bottlenecks.
Practically, this means eliminating noise while preserving signal, compacting verbose messages into concise, actionable lines, and converting high‑volume logs into efficient metrics or patterns when detailed text isn’t needed. It also includes optimizing field storage by trimming unneeded metadata, masking sensitive values, and normalizing payloads so downstream tools remain fast and consistent. These layers are complementary: start with lossless steps (deletes, trims, dedup), add targeted sampling where appropriate, and route only high‑value data to high‑cost destinations, keeping everything else in cost‑efficient tiers.
Edge Delta provides multiple layers of data reduction, each appropriate for different scenarios:
- Field-Level Optimization - Remove or compress individual fields
- Content Transformation - Replace verbose content with concise alternatives
- Deduplication - Eliminate duplicate log entries
- Sampling - Reduce volume through intelligent sampling
- Aggregation - Convert repetitive logs into statistical summaries
- Pattern Recognition - Transform similar logs into reusable patterns
- Selective Routing - Send only relevant data to expensive destinations
For practical implementations achieving 20-90% reduction, see Data Reduction Examples.
Core Reduction Strategies
1. Field Deletion and Filtering
Field deletion and filtering are the lowest‑risk, highest‑leverage ways to start reducing volume. Most telemetry carries extra metadata that is useful at the source but adds little value once data reaches downstream tools. Begin by trimming what you know you do not analyze, then exclude clearly low‑value events (for example, DEBUG‑only noise) so the rest of the pipeline works on a smaller, cleaner stream.
In practice this shines when you tighten payloads before sampling or aggregation so later steps are cheaper and faster. It also helps remove transient diagnostics—such as debug, session, or request identifiers—that inflate size but add little analytical value, and it supports privacy requirements by trimming or masking sensitive fields before any egress.
Use the Delete Field processor to remove nonessential keys (for example, platform or host fields you don’t query on in your destination). Follow with the Delete Empty Field processor to strip structural clutter such as empty strings, nulls, lists, and maps created by upstream processing. If you prefer an allow‑list model, the OTTL Transform node can enforce “keep only these attributes” (for example, level, timestamp, message, and a few business keys) so everything else is dropped by design.
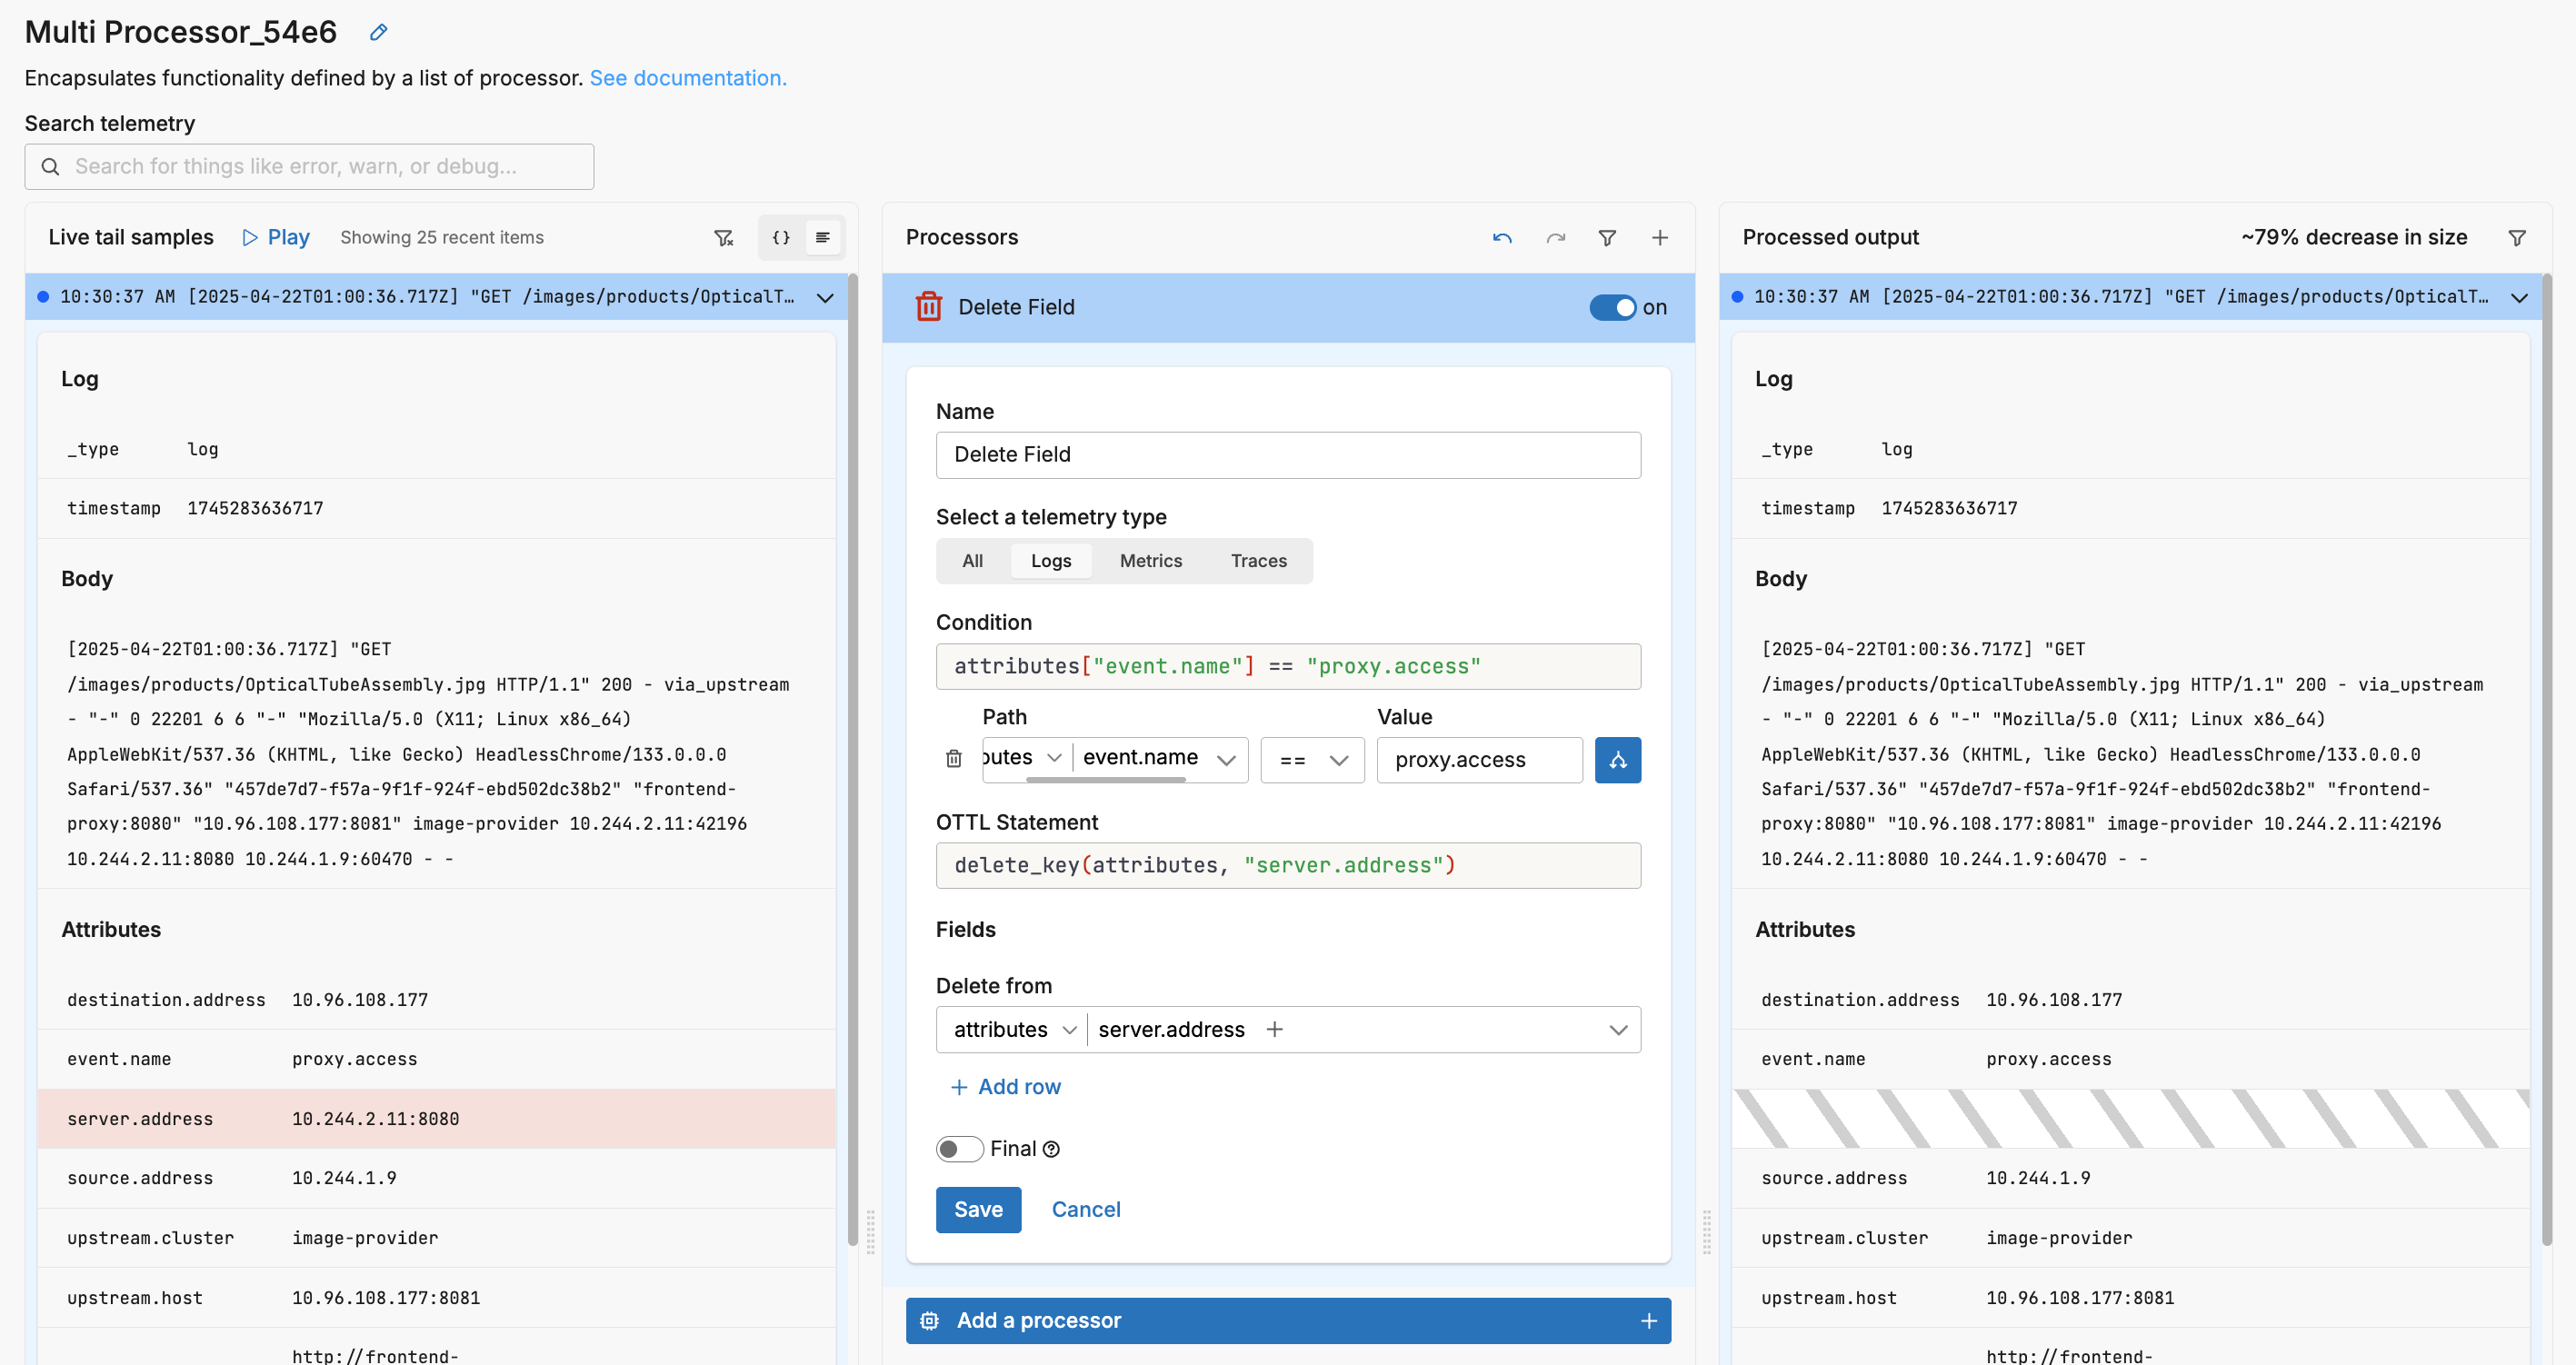
Be deliberate about what you keep: deletions are lossless for the fields that remain, but over‑trimming can remove join keys such as service, tenant, or correlation IDs—choose allow‑list keys carefully. Filtering is inherently lossy, so always preserve errors and signals that feed SLIs/SLOs. Parse only when you need structure for precise trimming; otherwise operate on resource fields and simple body predicates to keep cost low.
2. Lookup Table Replacements
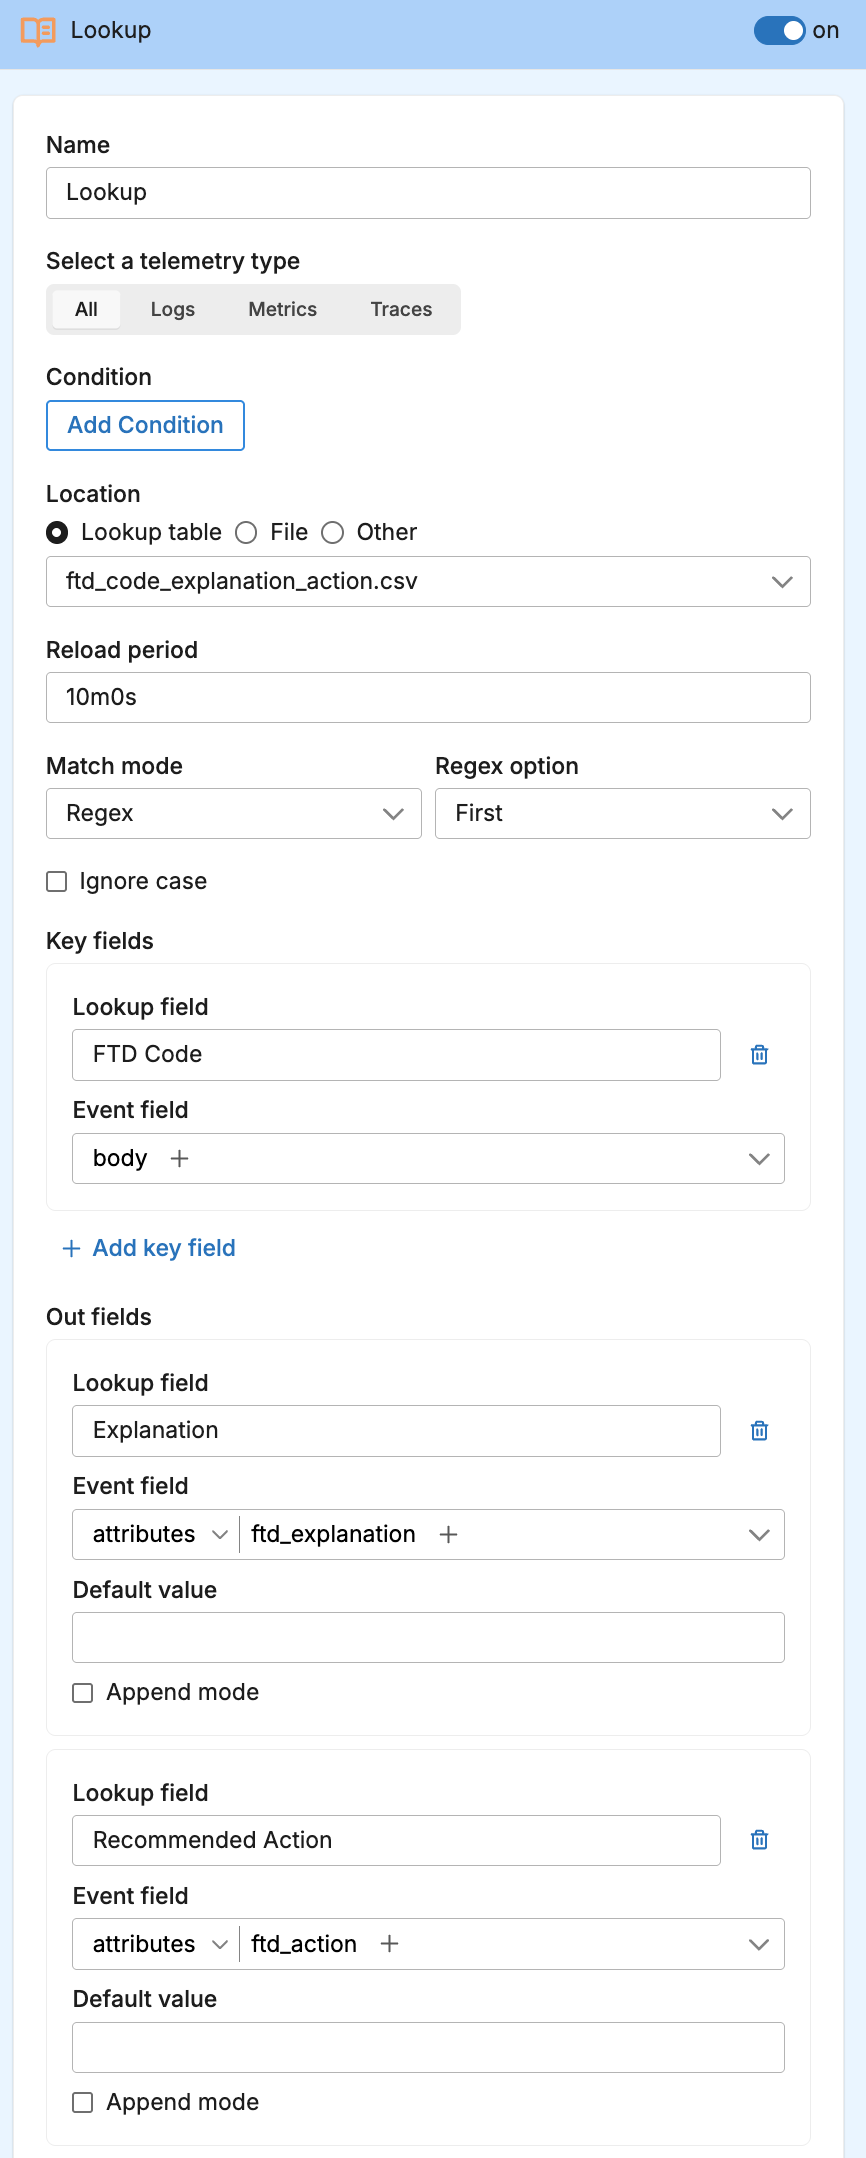
Lookups reduce payload by translating verbose, repetitive strings into compact, semantically meaningful codes. With the Lookup processor, you normalize many variants of the same concept (for example, browser user‑agent signatures, long or templated URL paths, chatty error text, or status descriptions) into short identifiers that are easy to group, filter, and aggregate. The win is twofold: fewer bytes per event and more consistent downstream analytics because disparate spellings or formats collapse to a single code. In most cases you enrich with the code and then remove the original bulky field so the message carries only what you analyze.
Conceptually, treat the lookup table as a small domain dictionary: keep it accurate, versioned, and shared across teams so translation is consistent. Choose a sensible refresh cadence, define defaults for misses, and, if you are migrating dashboards, keep both the code and original value for a brief overlap before dropping the source field. This way lookups act as both compression and normalization, reducing volume without sacrificing meaning. For the basic processor configuration, see the Lookup processor; for a deeper walkthrough of table design, match modes, and governance, see How to use lookup tables.
3. Deduplication
Deduplication removes repeated copies of the same message so your tools process one representative event instead of a burst of identical ones. The Deduplicate Logs processor compares items within a sliding window and keeps a single instance, adding a counter to record how many duplicates were collapsed. This preserves signal and frequency while eliminating redundant payload.
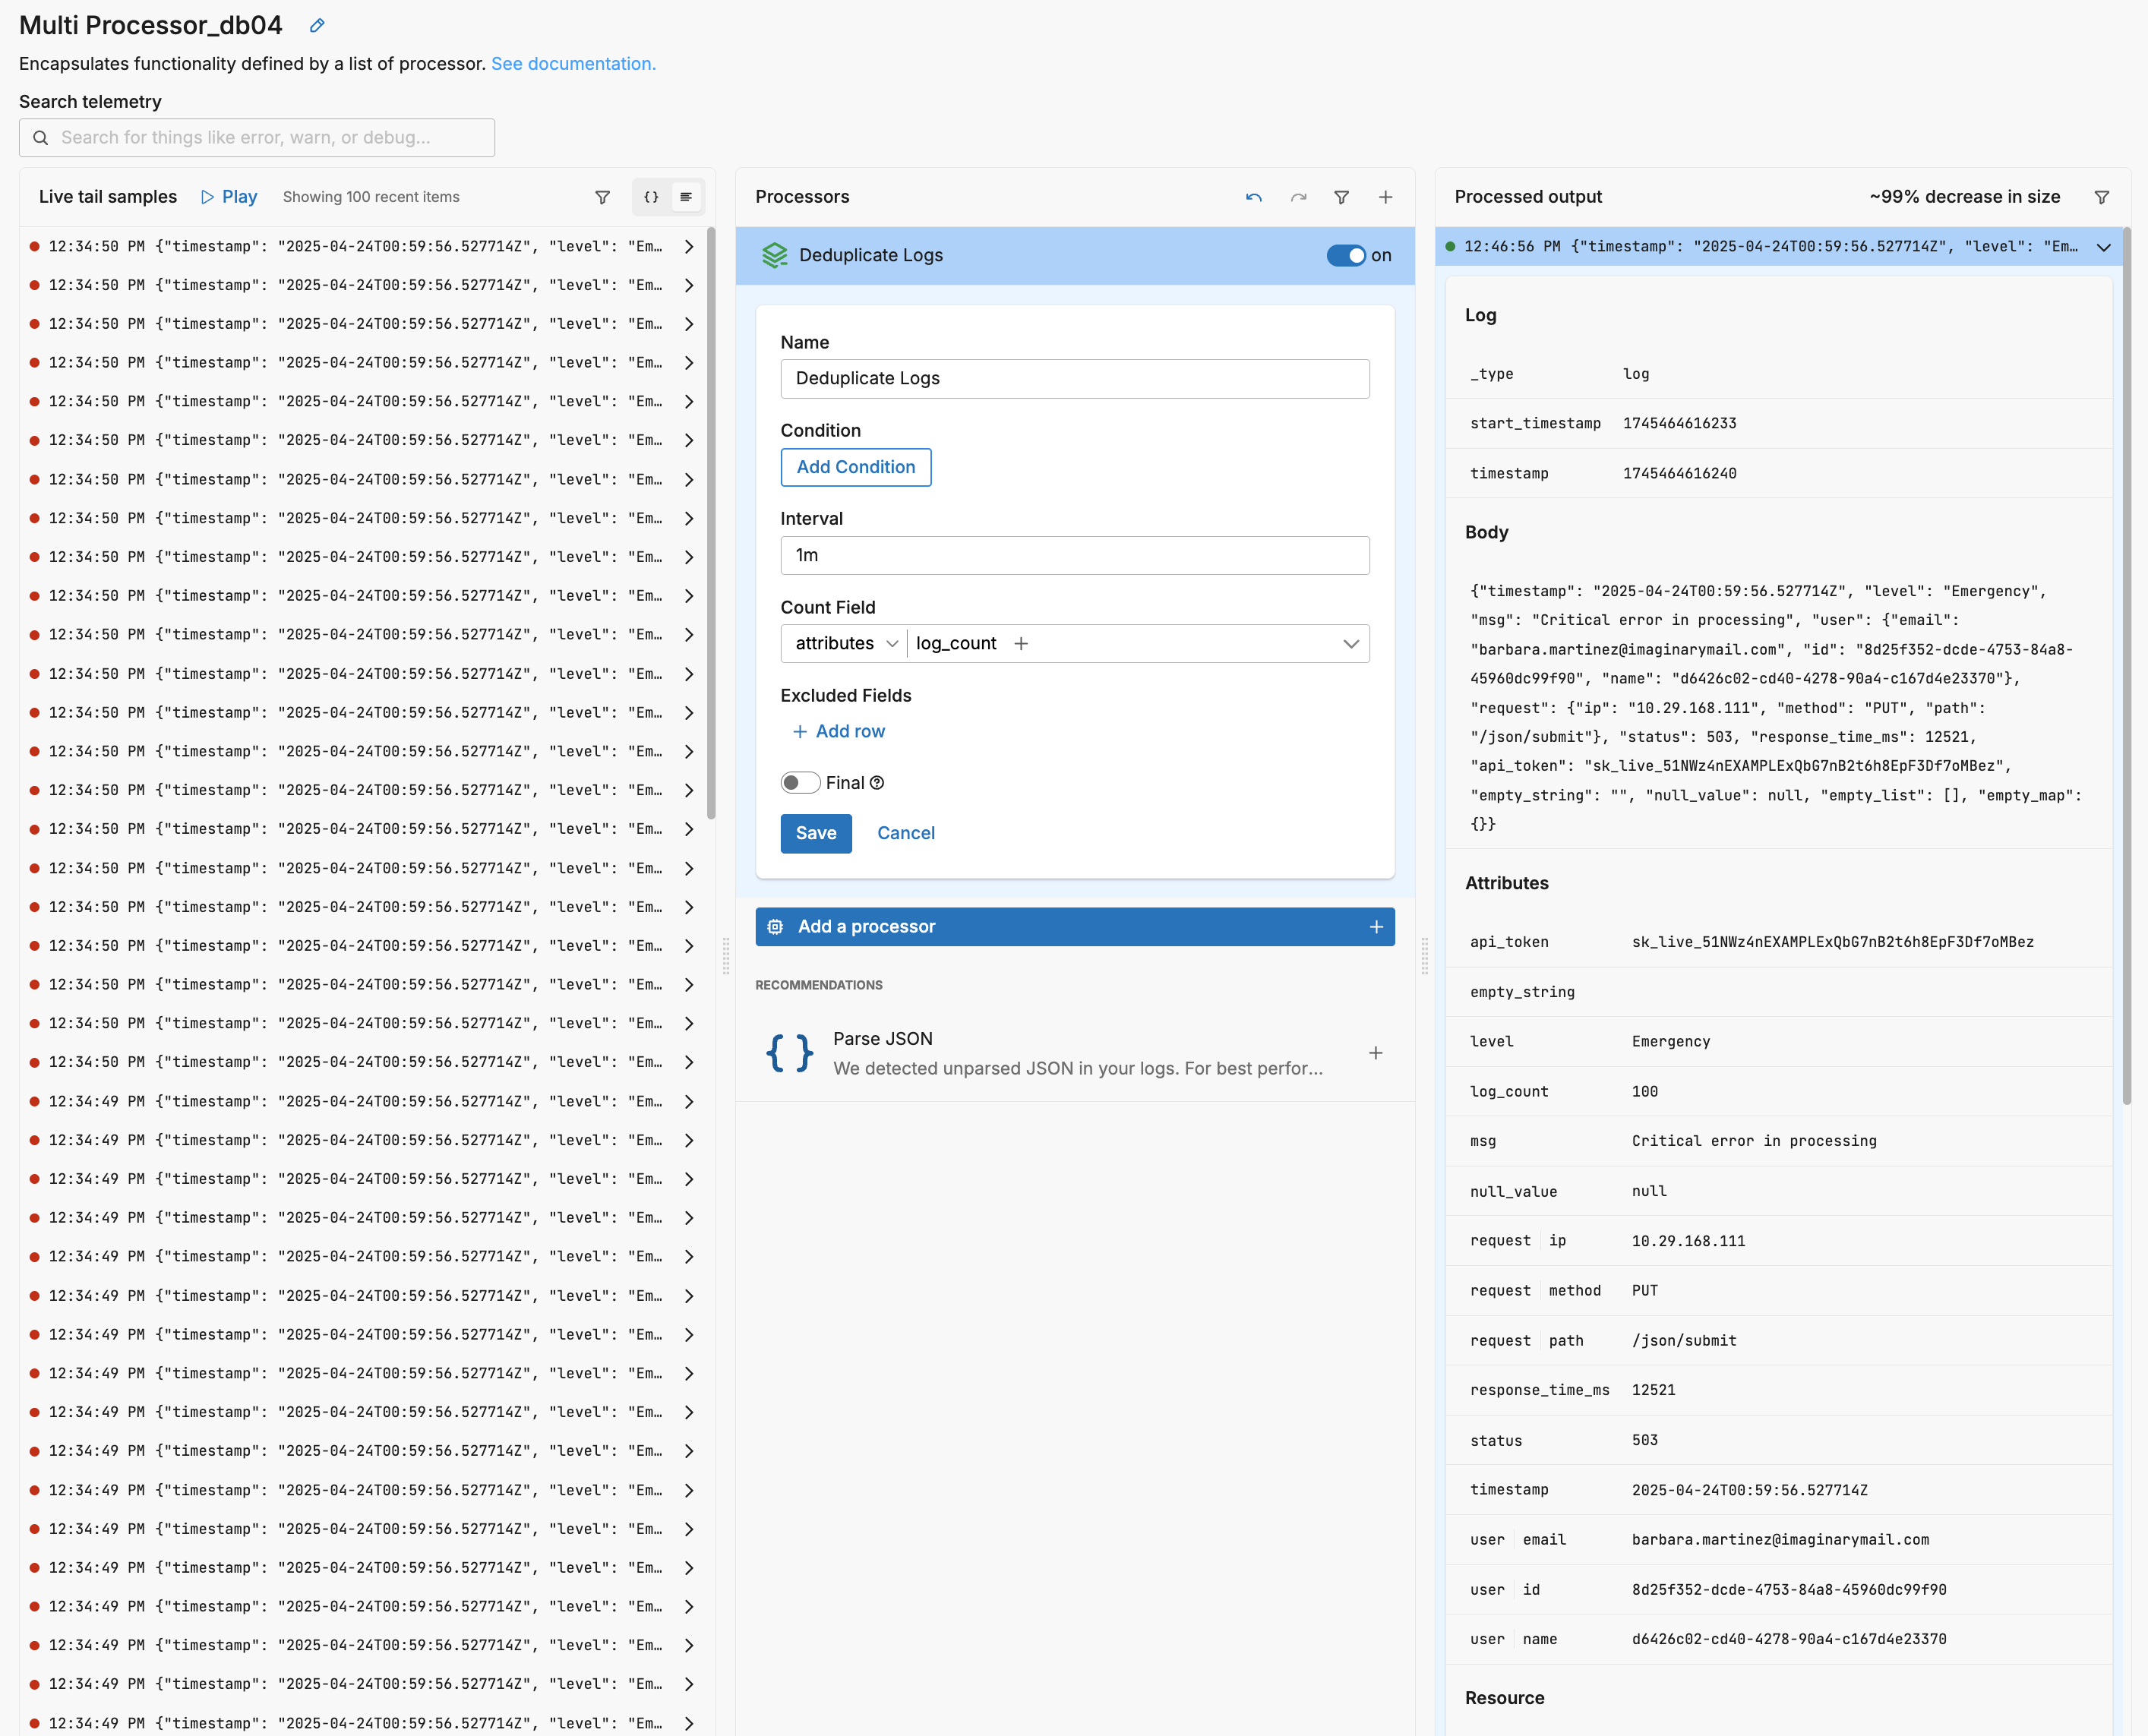
Two options shape behavior. The interval defines the time window for detecting duplicates; shorter windows catch brief spikes, while longer windows flatten periodic chatter at the cost of holding more state. The count_field_path sets where the processor writes the duplicate count (for example, attributes["log_count"]), so downstream queries can aggregate on the retained item and still reflect true volume.
In practice, duplicates are evaluated on message content and context, so normalizing noisy fields first improves results. Use a light transform to remove or generalize tokens that make otherwise identical entries appear unique (such as timestamps, request IDs, or query parameters), or configure excluded_field_paths to ignore known changers (for example, timestamp or attributes["query_id"]). This keeps the comparison focused on what matters while avoiding unnecessary misses.
Scope deduplication deliberately. Limit it to logs by setting data_types, restrict it with a condition if only certain sources are chatty, and consider enabling final if you want matched items to exit the processor stack early. The outcome is effectively lossless for retained content—one clean record plus a count—but it reduces storage, index pressure, and downstream noise wherever repeated messages occur.
4. Sampling Strategies
Sampling reduces volume by allowing a subset of traffic through while preserving the signals you care about. Used well, it keeps representative coverage of high‑throughput streams and guarantees that critical events still arrive. In Edge Delta there are two complementary samplers: one for logs and one for traces.
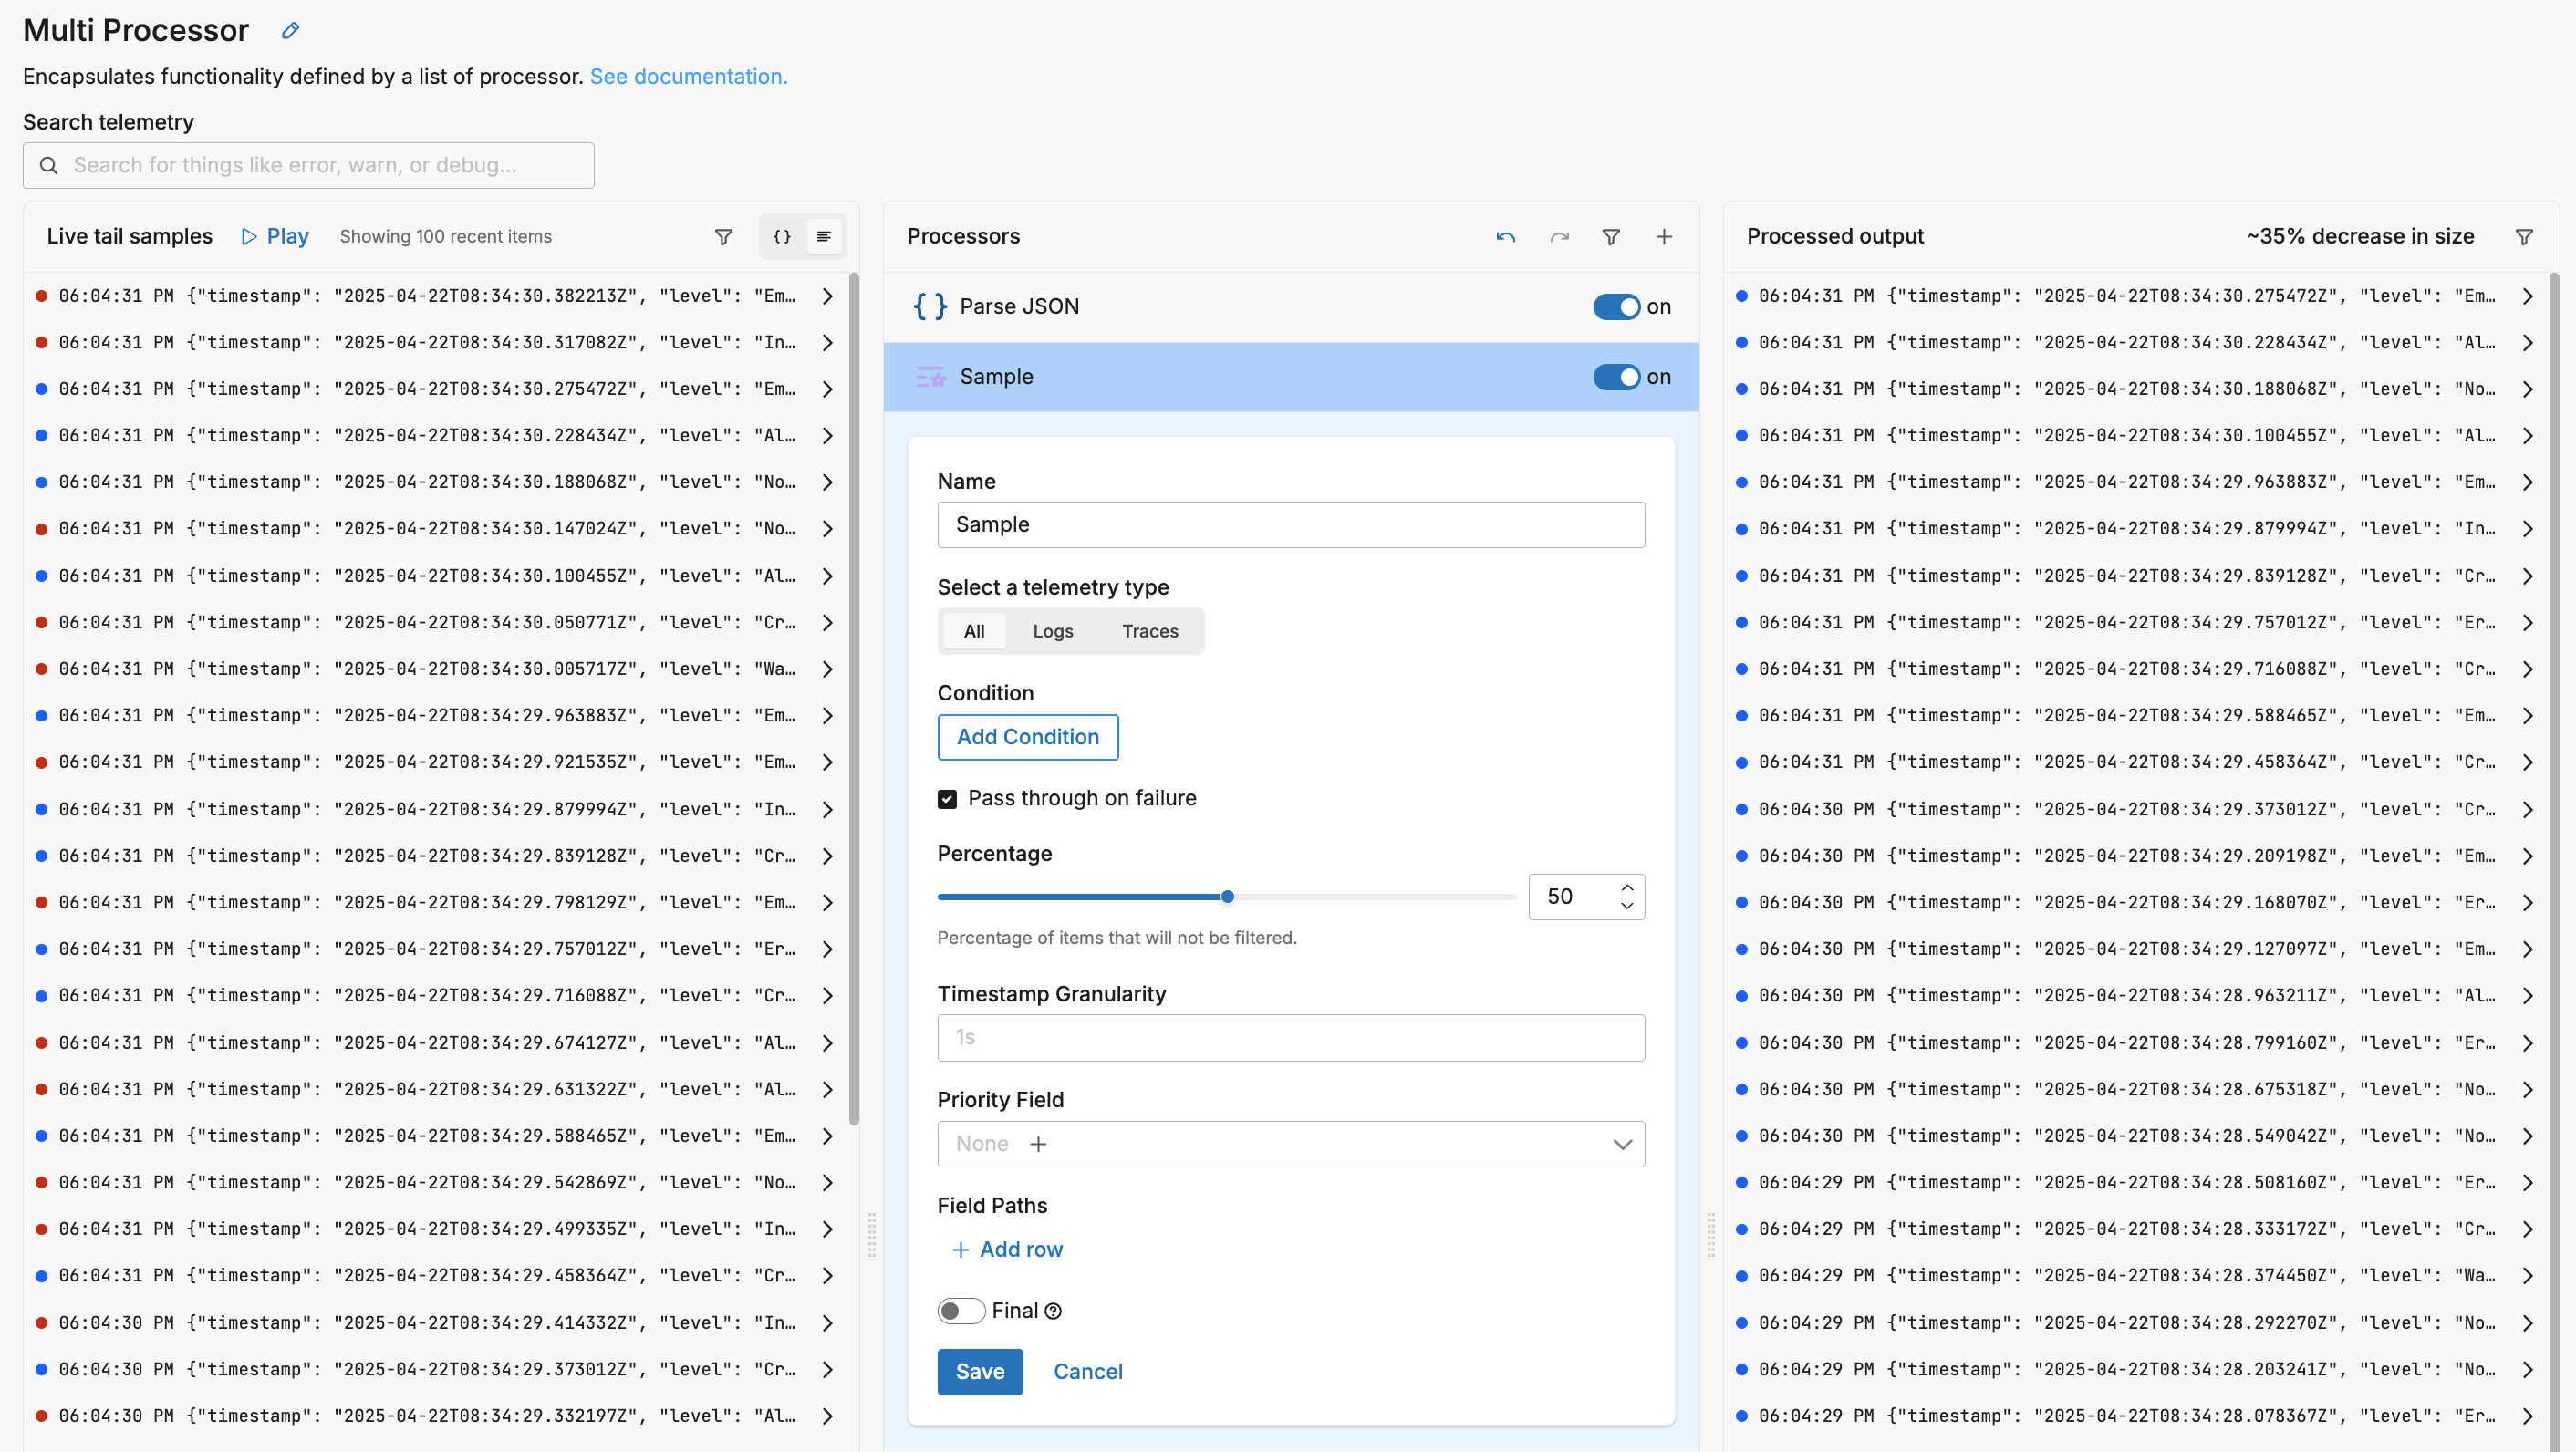
For logs, the Sample processor applies consistent probabilistic sampling. It hashes selected fields (by default timestamp, service name, and body) and admits events that fall under a configured percentage. You can scope sampling with a condition (for example, “only INFO and DEBUG”), set the percentage (10–50% are common for non‑error traffic), and enable pass_through_on_failure to avoid accidental drops on evaluation errors. When you need stability across batches, tune timestamp granularity and field paths so “sameness” reflects your domain (e.g., user id, route). If certain items must bypass the global rate, use a “sample‑rate override” field to raise or lower the effective percentage on a per‑item basis. This sampler is fast, stateless per event stream, and ideal at the edge to cut volume before egress.
For traces, the Tail Sample processor makes decisions after spans arrive, evaluating one or more policies across the whole trace. Policies can be probabilistic (keep N%), latency‑based (keep slow traces), status‑aware (keep ERROR), or attribute‑driven (numeric, string, boolean, or explicit conditions). You can also compose policies (AND) or mark drops explicitly. Operational controls such as the decision interval and cache sizing determine how long the sampler waits to observe related spans before deciding. Because spans from a single trace often originate on different nodes, tail sampling is most effective on a Gateway pipeline that sees traffic from many Node pipelines (see deployment examples); this placement provides a complete picture of each trace and drives consistent reductions across the estate.
In practice, combine both where appropriate: sample non‑critical logs close to the source to reduce transport and indexing cost, and tail‑sample traces at the Gateway to keep the most informative traces (errors, slow paths, or targeted subsets). Keep error logs and failing traces un‑sampled, document exceptions, and review sampled rates periodically to ensure you retain enough context for investigations without overspending on volume.
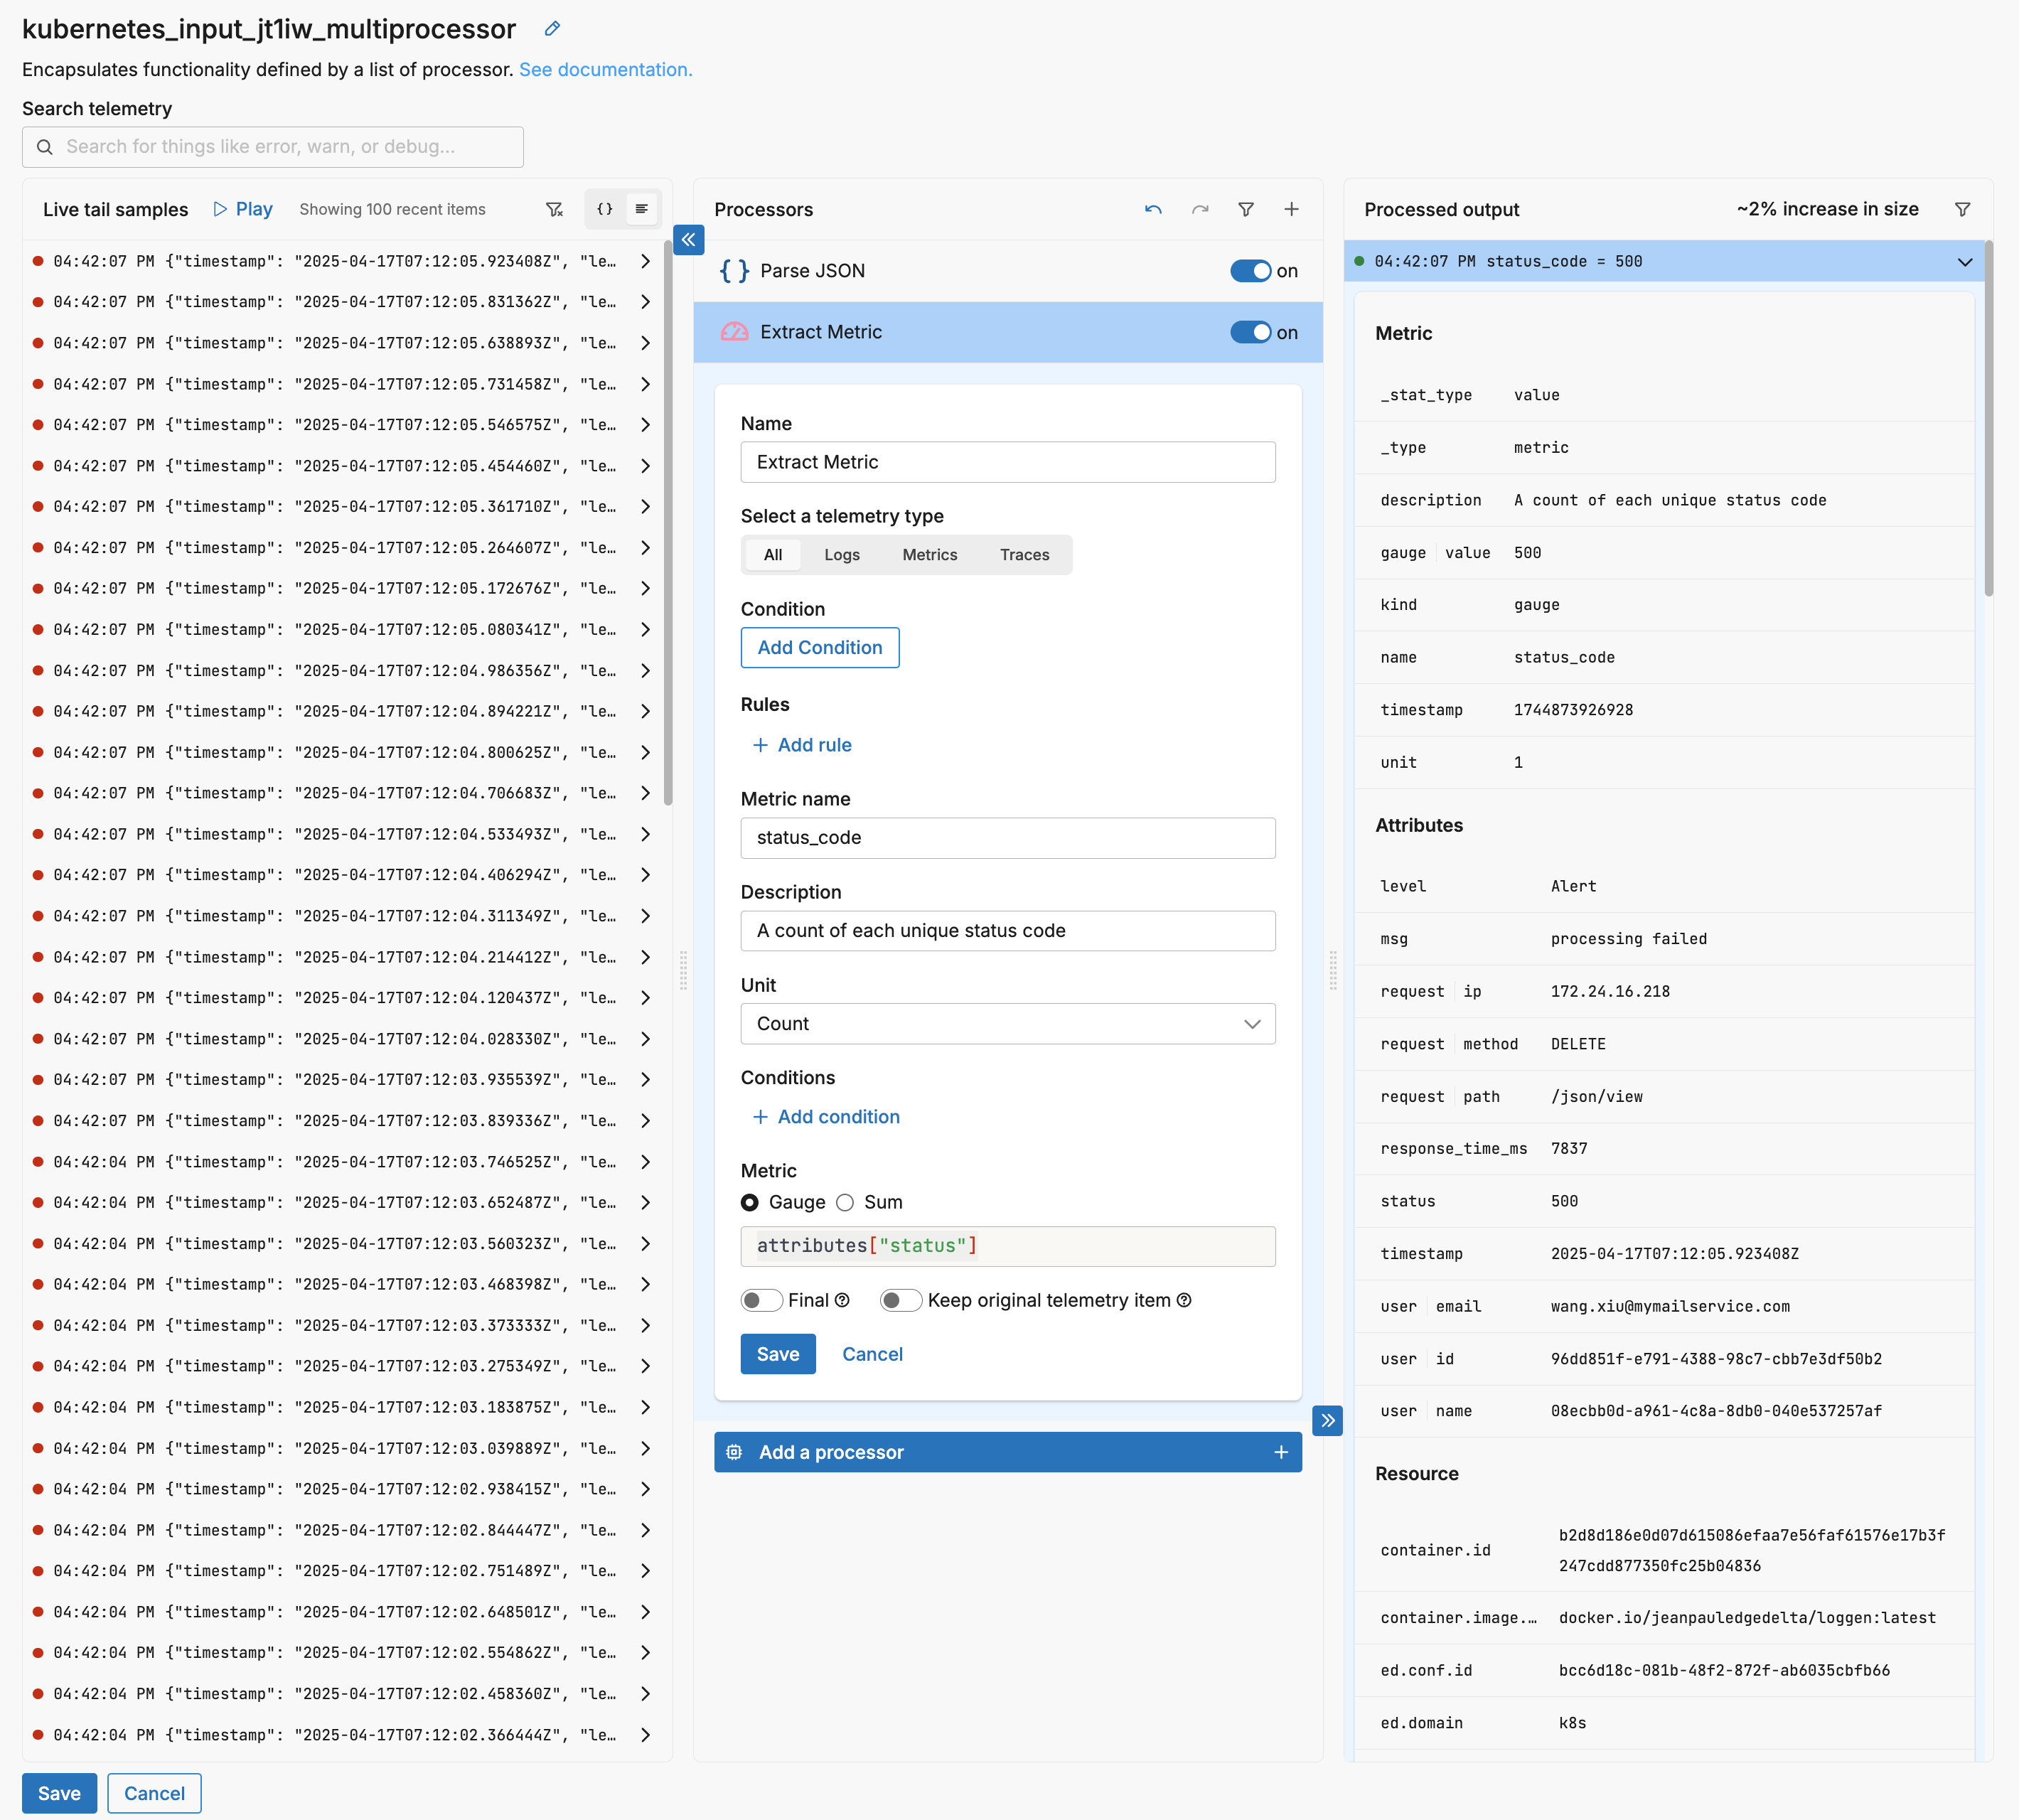
5. Log-to-Metric Conversion
Converting logs to metrics turns frequent, similar events into compact numeric signals you can aggregate and monitor over time. The goal is to preserve what matters (counts, rates, latencies) while shedding per‑event text that drives cost. In Edge Delta you typically extract the metric first, then aggregate it to reduce cardinality and reporting frequency.
Start by identifying the numeric value or counter you want to keep—status counts, response time, bytes sent—and use the Extract Metric processor to emit a metric alongside the log. On its own, extraction does not reduce volume; in fact, it can increase it because you now have the original log and a new metric. To realize reductions, follow extraction with either the Aggregate Metric processor or a rollup.
Aggregation groups metrics by a small set of dimensions (for example, endpoint, status class, service) and reports a single value for each group per interval. This collapses many data points into a handful of series while keeping the breakdowns you use in dashboards and alerts. Rollup is the same mechanism without any grouping—one summary per interval (for example, total requests per minute). Choosing the right dimensions is a balance: too many can explode cardinality; too few can hide useful variation. Intervals should match how quickly you need to react; shorter intervals increase resolution and volume, longer ones reduce both.
Finally, decide whether to keep the original log. Many pipelines drop it once the metric is emitted to avoid double counting and unnecessary egress, while others keep it selectively (for example, on errors) to preserve investigative detail. The “keep original log” behavior is configurable on extraction: turning it off maximizes reduction; leaving it on preserves context. Place this pattern close to the source when you want to cut transport and indexing cost early, or at a Gateway when you need to aggregate across services before forwarding.
To see this flow in action, walk through Extract and Aggregate Metrics. The resulting metrics are first‑class citizens in Edge Delta and downstream tools—powering dashboards, monitors, and SLOs. For an example of visualizing and tracking these signals, see Quickstart: Create a Dashboard.
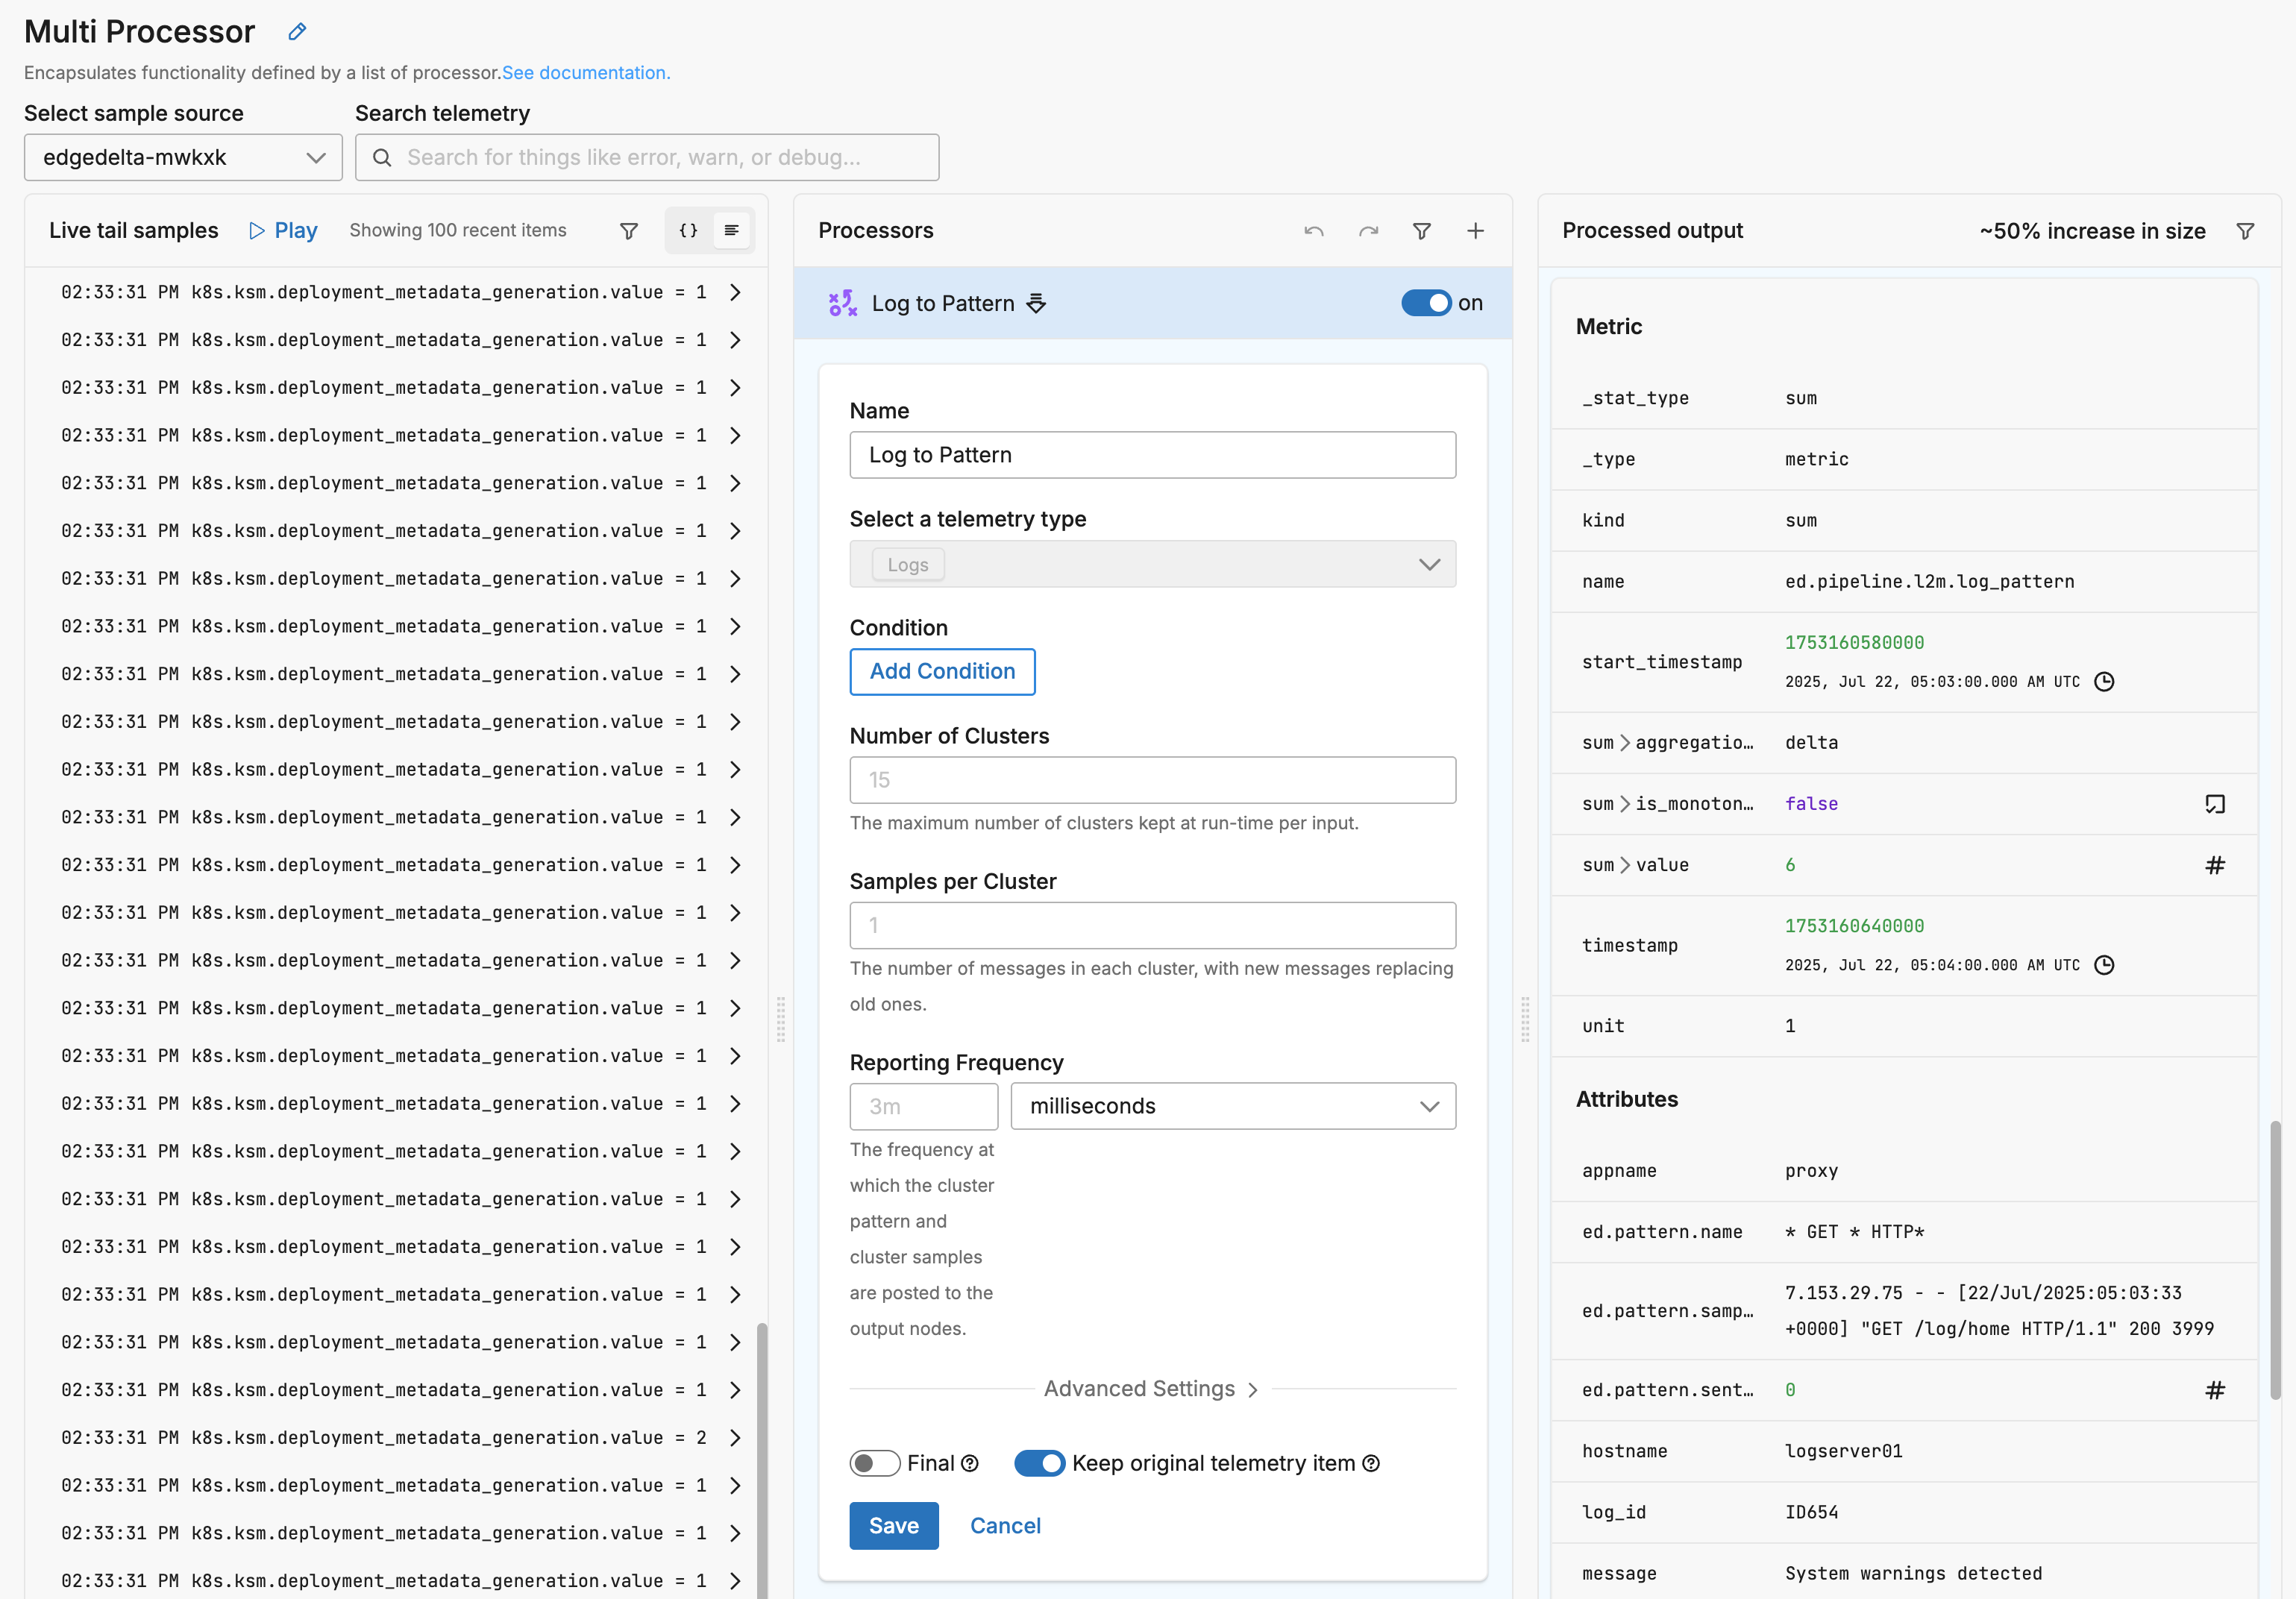
6. Log-to-Pattern Transformation
Patterning converts bursts of similar log lines into structured pattern metrics. Using the Log to Pattern Metric processor, Edge Delta clusters messages by shape and emits periodic counts per pattern instead of forwarding every near‑duplicate line. The result is a compact, high‑level signal that captures behavior without the verbosity of full text.
These pattern metrics are especially valuable downstream because they power AI‑assisted operations: they make it easy to spot spikes, novelty, and regressions in message shapes, and they feed systems for anomaly detection, recommendations, and on‑call assistance. See Anomaly Detection for how patterns and their volumes are analyzed to surface new or unusual conditions in real time.
Conceptually, think in terms of cadence, examples, and content. The reporting frequency controls how often counts are emitted; shorter intervals increase responsiveness and volume, longer intervals reduce both. A small number of samples per cluster preserves just enough context to understand a pattern when you investigate. And choosing the field to cluster (the whole body by default, or a normalized/derived field) determines how fine‑grained patterns will be. For maximum reduction, set the processor not to keep original items; if you still need raw lines for certain cases, keep them selectively (for example, for errors or during a rollout).
7. Intelligent Routing
Routing does not, by itself, reduce event count or data volume, but it is a powerful lever for controlling cost when data cannot—or should not—be reduced. Use tiered routing to send high‑value telemetry to premium destinations while directing the rest to cost‑efficient storage or internal tiers. See Data Tiering for end‑to‑end strategies and use the Route processor to express simple, data‑aware rules.
8. Conditional Reduction Based on Environment
Not every environment warrants the same level of reduction. Development and test can adopt aggressive trimming and sampling to keep costs low while iterating quickly, staging can apply moderate controls, and production—especially for critical services—can preserve richer context by default. Conditional reduction lets you express these differences explicitly so policies follow business risk rather than a one‑size‑fits‑all rule.
There are a few ways to implement this. One is to branch with the Route processor by environment or service tier and attach different processors to each path—this keeps intent clear in the pipeline graph. Another is to use each processor’s condition so it only runs where appropriate (for example, sample only in staging, or delete fields only for non‑critical services). A third is to use where clauses in a Custom processor so individual OTTL statements apply only when a predicate matches (for example, keep full context for critical services).
Whichever expression you choose, be explicit about what always bypasses reduction (errors, security signals, correlation identifiers), where stronger controls are allowed (dev and test), and how exceptions are handled during incidents or rollouts. This keeps cost predictable without compromising the visibility on which production teams rely.
9. Compression and Encoding
Compression can reduce cost when you must retain large, verbose fields but do not need them to remain human‑readable in flight. It is most effective on long, repetitive text (for example, stack traces, templated messages, or JSON with many repeated keys) and least effective on short strings or already‑compressed/low‑entropy payloads (for example, archives, protobuf/msgpack frames, or base64‑encoded blobs), where the container overhead or double compression can outweigh savings. Field‑level compression also shifts work to the CPU and may provide limited benefit if the destination re‑serializes the bytes (for example, as a JSON byte array) or applies its own transport compression. Use it deliberately: compress large blobs you intend to keep, drop or summarize the original, and confirm downstream support for the chosen format.
Encoding is different: it changes representation, not size. Base64 generally inflates data; it exists for compatibility, not reduction. When you must compress at the field level (for example, via an OTTL transform), pick an algorithm your consumers can decode and reserve it for cases where deletion, truncation, normalization, or converting logs to metrics/patterns is not acceptable. As a rule of thumb, prefer trimming and compaction first; apply compression selectively to the few fields that remain large and must be retained.
Measuring Reduction Impact
Pipeline Performance Dashboard
Monitor your data reduction effectiveness using live capture during configuration, and later with the Edge Delta Pipelines Dashboard:
- Input vs. output data rates
- Reduction percentage by processor
- Cost savings estimates
Implementation Best Practices
1. Gradual Rollout
Start with non-critical data and gradually expand reduction strategies:
- Begin with development environments
- Apply to staging with monitoring
- Roll out to production incrementally
- Monitor data quality and adjust
2. Preserve Observability
Always maintain critical signals:
- Keep all error and fatal logs intact
- Preserve unique identifiers for correlation
- Maintain SLI/SLO related metrics
- Retain security-relevant events
3. Document Reduction Logic
Use the Comment processor to document your reduction strategy directly in the pipeline configuration. This ensures your team understands what data is being reduced and why:
The Comment processor adds documentation directly to your pipeline YAML without affecting data flow, making reduction logic transparent and maintainable.
4. Monitor Reduction Impact
Track the effectiveness of your reduction strategies using the Pipelines Dashboard:
- Input/output data rates
- Processing latency
- Cost savings metrics
- Data quality indicators
See Also
- Extract Metric Processor - Convert logs to metrics
- Aggregate Metric Processor - Group metrics by dimensions
- Rollup Metric Processor - Create summary metrics
- Log to Pattern Metric Processor - Identify log patterns
- Sample Processor - Reduce log volume through sampling
- Tail Sample Processor - Sample distributed traces
- Deduplicate Logs Processor - Remove duplicate entries
- Delete Empty Field Processor - Remove empty values
- Route Processor - Conditional data routing
- Lookup Processor - Replace verbose content
- Delete Field Processor - Remove unnecessary fields
- Custom Processor - Advanced OTTL transformations
- Pipelines Dashboard - Monitor reduction effectiveness
Conclusion
Data reduction with Edge Delta is about finding the optimal balance between cost savings and operational visibility. By leveraging field deletion, lookup tables, deduplication, sampling, log-to-metric conversion, and pattern recognition, you can achieve dramatic volume reductions while maintaining the insights necessary for effective observability.
Start with light reduction on non-critical data, measure the impact using the Pipelines Dashboard, and progressively optimize your pipeline. Remember that the goal isn’t to eliminate all data, but to eliminate noise while amplifying signal - ensuring every byte that reaches your observability platform provides genuine value.
Data reduction also improves the effectiveness of downstream AI operations. When AI teammates investigate anomalies and incidents, high-quality, noise-free data leads to faster and more accurate correlation. Learn how data reduction fits into the broader operational cycle in AIOps.