Data Reduction Examples
8 minute read
Overview
These examples demonstrate practical data reduction techniques using Edge Delta’s Telemetry Pipelines to achieve 20-90% volume reduction while maintaining observability. Each scenario shows real test results from production workloads, complete with before/after comparisons and working pipeline configurations. For a comprehensive introduction to data reduction strategies and concepts, see the Data Reduction overview page.
Scenario 1: Small Logs with Light Reduction
Consider this log
{
  "_type": "log",
  "timestamp": 1757678937068,
  "body": "2025-09-12T12:08:57.067Z ERROR middleware/authz.go:383 request flog_log_generator spec:{uri:/v1/orgs/b9df8fc0-084b-11ee-be56-0242ac120002/confs/- method:POST password:4o7sOIGH} latency:401ms",
  "resource": {
    "ed.demo": "",
    "ed.source.name": "telemetrygen_input_d9f7",
    "ed.source.type": "telemetrygen_input",
    "host.ip": "172.19.0.4",
    "host.name": "data-reduction-test-control-plane",
    "service.name": "telemetry-gen-telemetrygen_input_d9f7"
  },
  "attributes": {}
}
When this configuration is applied log size is reduced by about 21%.
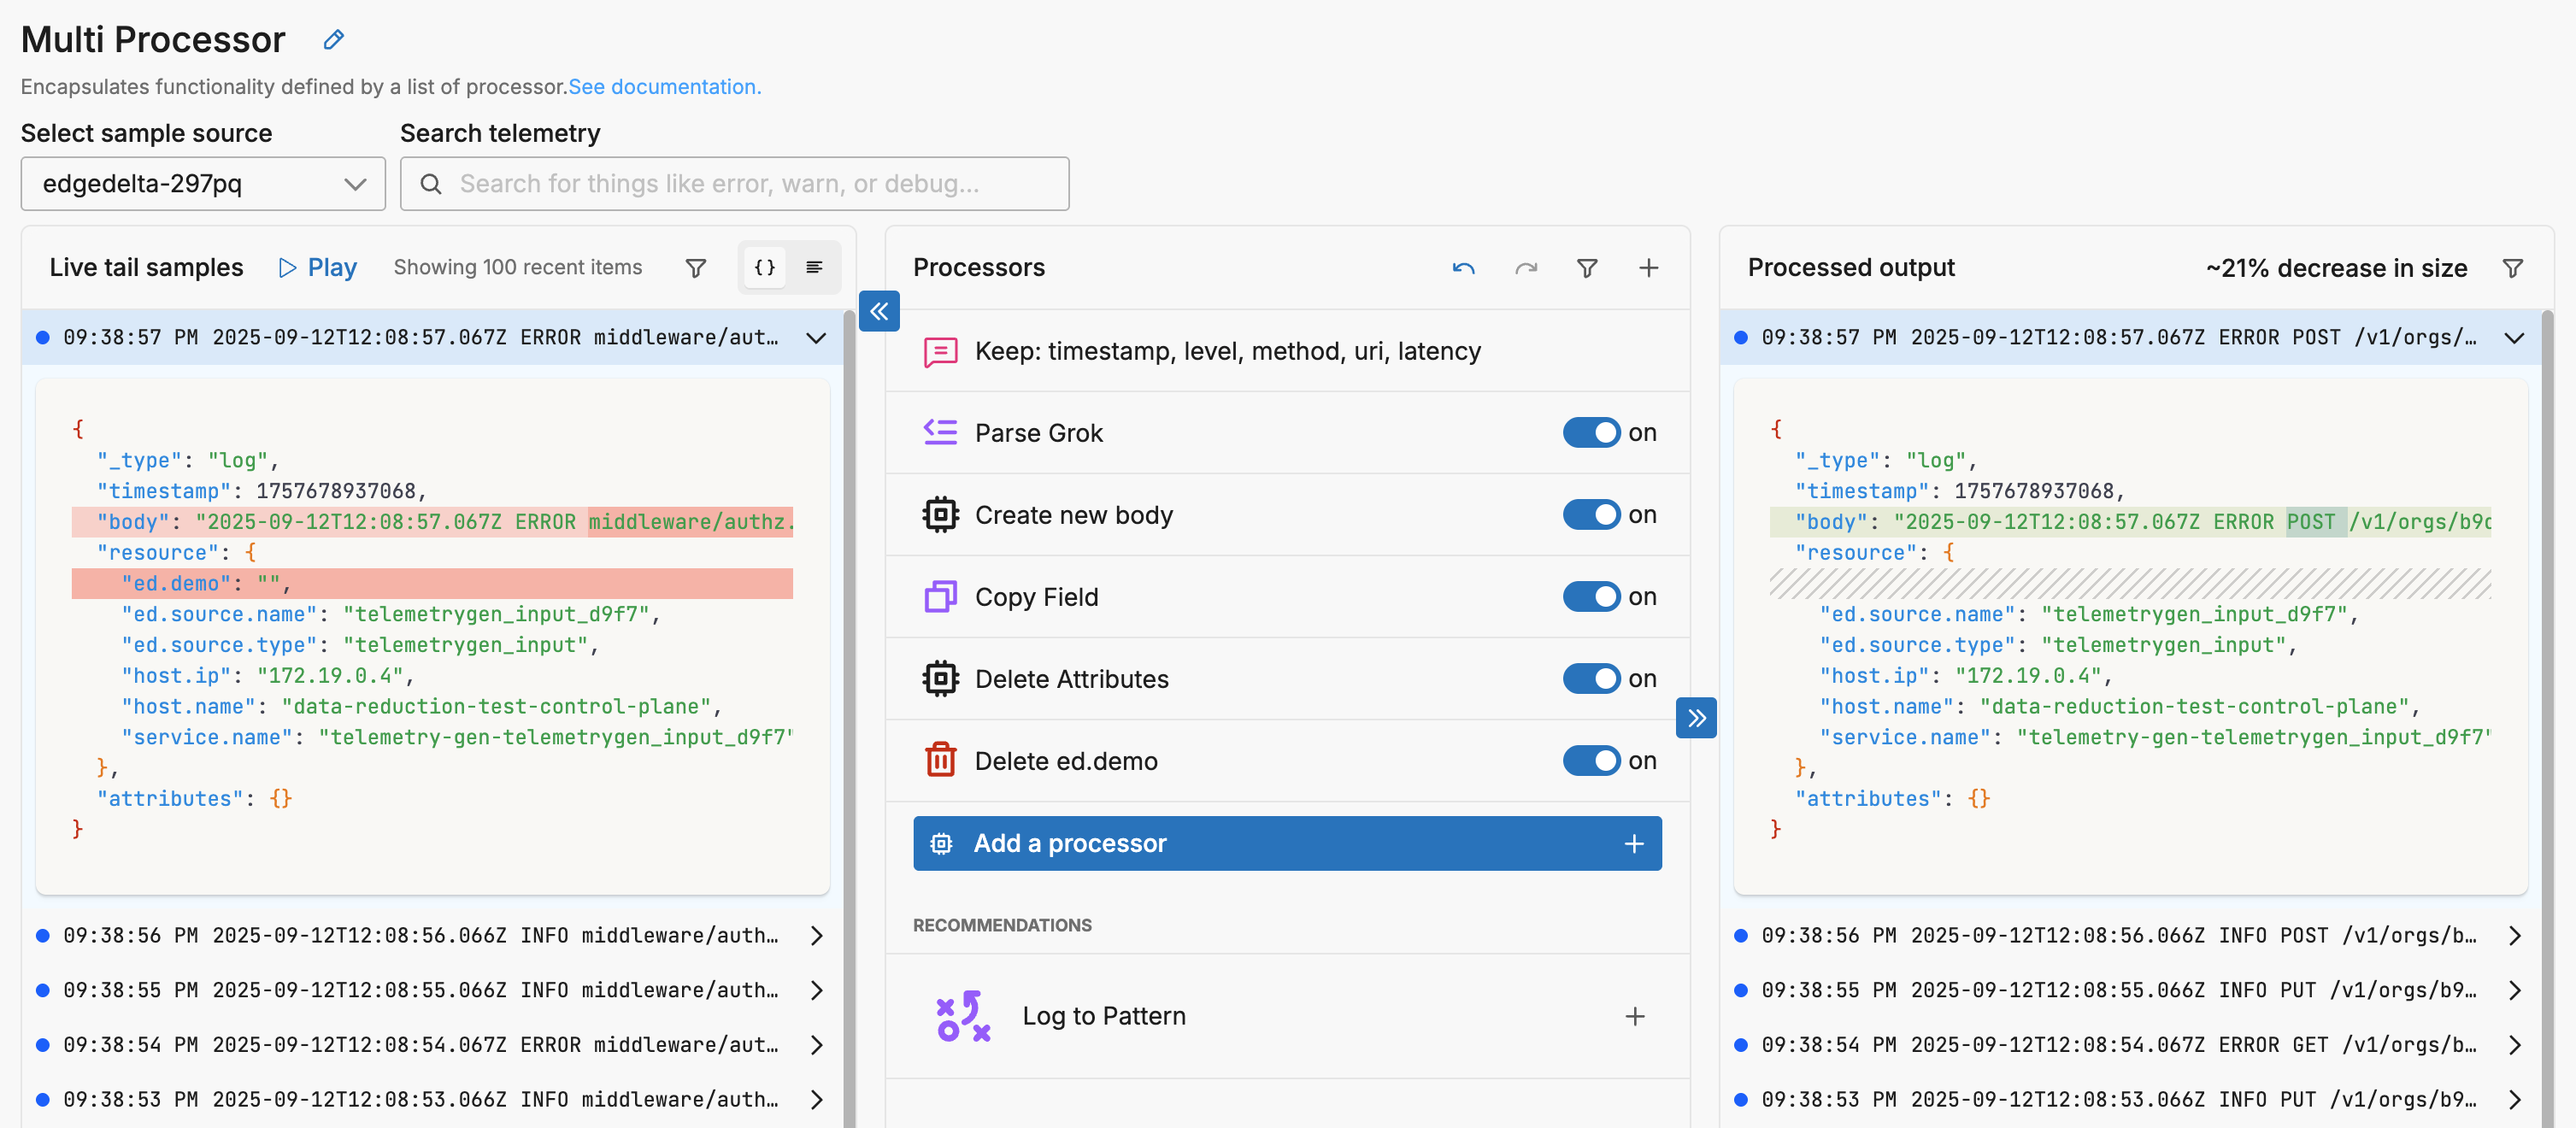
This stack parses only the essentials from each line (timestamp, level, method, URI, latency) and then synthesizes a compact message from those fields. It replaces the verbose body with that compact form so downstream processors and destinations handle a much smaller payload. Finally, it cleans up by dropping all temporary attributes and removing low‑value resource keys, leaving just a lean body plus the minimal metadata you intend to keep. The result is a lossless summary for operational needs, without carrying along extra parse artifacts or host details you don’t analyze.
Resulting in logs like this:
{
  "_type": "log",
  "timestamp": 1757678937068,
  "body": "2025-09-12T12:08:57.067Z ERROR POST /v1/orgs/b9df8fc0-084b-11ee-be56-0242ac120002/confs/- latency=401ms",
  "resource": {
    "ed.source.name": "telemetrygen_input_d9f7",
    "ed.source.type": "telemetrygen_input",
    "host.ip": "172.19.0.4",
    "host.name": "data-reduction-test-control-plane",
    "service.name": "telemetry-gen-telemetrygen_input_d9f7"
  },
  "attributes": {}
}
The GUI generates a pipeline with the following YAML in the Multi-processor node.
- type: comment
  metadata: '{"id":"ZRhKj7-SE6u5TYz1tX-9o","type":"comment","name":"Keep: timestamp, level, method, uri, latency"}'
  data_types:
  - log
- type: ottl_transform
  metadata: '{"id":"uOkKAdLBzduEcwDMDNg35","type":"parse-grok","name":"Parse Grok"}'
  data_types:
  - log
  statements: |-
    merge_maps(attributes, ExtractGrokPatterns(body, "%{TIMESTAMP_ISO8601:timestamp} %{LOGLEVEL:level} %{DATA} request %{DATA} spec:\\{uri:%{DATA:uri} method:%{WORD:method} password:%{DATA}\\} latency:%{NUMBER:latency}ms", true), "upsert") where IsMap(attributes)
    set(attributes, ExtractGrokPatterns(body, "%{TIMESTAMP_ISO8601:timestamp} %{LOGLEVEL:level} %{DATA} request %{DATA} spec:\\{uri:%{DATA:uri} method:%{WORD:method} password:%{DATA}\\} latency:%{NUMBER:latency}ms", true)) where not IsMap(attributes)
- type: ottl_transform
  metadata: '{"id":"8XuK6dYIkpiayHx59Ap0c","type":"ottl_transform","name":"Create
    new body"}'
  data_types:
  - log
  statements: |
    set(attributes["essential"], Format("%s %s %s %s latency=%sms", [attributes["timestamp"], attributes["level"], attributes["method"], attributes["uri"], String(attributes["latency"])])) where attributes["timestamp"] != nil and attributes["level"] != nil and attributes["method"] != nil and attributes["uri"] != nil and attributes["latency"] != nil
- type: ottl_transform
  metadata: '{"id":"1NcSk_6yX8HAvXuOyLkWl","type":"copy-field","name":"Copy Field"}'
  data_types:
  - log
  statements: set(body, attributes["essential"])
- type: ottl_transform
  metadata: '{"id":"KGyDcK2Xrr239u3gCGUwD","type":"ottl_transform","name":"Delete
    Attributes"}'
  data_types:
  - log
  statements: delete_matching_keys(attributes, ".*")
- type: ottl_transform
  metadata: '{"id":"X69__BNiX1W7RuYcOFrDS","type":"delete-field","name":"Delete ed.demo"}'
  data_types:
  - log
  statements: delete_key(resource, "ed.demo")
Note: This could be reduced into a single OTTL Custom Processor with multiple statements, but it is useful to have the GUI available to quickly reorder, disable or otherwise configure processors.
Optimized processor:
- name: telemetrygen_input_c47a_multiprocessor
  type: sequence
  user_description: Multi Processor
  processors:
  - type: ottl_transform
    metadata: '{"id":"oY9Q1NPiR_dXscOR6YPFX","type":"ottl_transform","name":"Custom"}'
    data_types:
    - log
    statements: |
      // Parse once, format directly to body, skip intermediate storage
      set(cache["p"], ExtractGrokPatterns(body, "%{TIMESTAMP_ISO8601:timestamp} %{LOGLEVEL:level} %{DATA} request %{DATA} spec:\\{uri:%{DATA:uri} method:%{WORD:method} password:%{DATA}\\} latency:%{NUMBER:latency}ms", true))
      set(body, Concat([cache["p"]["timestamp"], " ", cache["p"]["level"], " ", cache["p"]["method"], " ", cache["p"]["uri"], " latency=", String(cache["p"]["latency"]), "ms"], "")) where cache["p"]["timestamp"] != nil
      delete_key(resource, "ed.demo")
      delete_key(cache, "p")
This optimized processor achieves the same 21% reduction with just four operations instead of six. It parses the log line once using ExtractGrokPatterns and stores the result in a temporary cache. Then it immediately constructs the compact body format directly from the cached values using Concat, bypassing the need for intermediate attribute storage. Finally, it cleans up by removing the empty ed.demo field and clearing the cache. This approach reduces processing overhead by 50% compared to the GUI-generated version while producing identical output.
Scenario 2: Large Logs with Moderate Reduction
Consider this Apache JSON log:
{
  "_type": "log",
  "timestamp": 1757681921433,
  "body": "{\n\"host\": \"116.210.217.185\",\n\"user\": \"-\",\n\"time_local\": \"12/09/2025:12:58:41 +0000\",\n\"method\": \"POST\",\n\"request\": \"/v1/logout\",\n\"protocol\": \"HTTP/1.1\",\n\"response-code\": 201,\n\"bytes\": 1890,\n\"referrer\": \"https://www.investorholistic.biz/sticky/web-readiness\",\n\"agent\": \"Opera/10.56 (X11; Linux x86_64; en-US) Presto/2.8.161 Version/10.00\"\n}",
  "resource": {
    "ed.demo": "",
    "ed.source.name": "telemetrygen_input_c47a",
    "ed.source.type": "telemetrygen_input",
    "host.ip": "172.19.0.4",
    "host.name": "data-reduction-test-control-plane",
    "service.name": "telemetry-gen-telemetrygen_input_c47a"
  },
  "attributes": {}
}
When this configuration is applied, log size is reduced by about 40%.
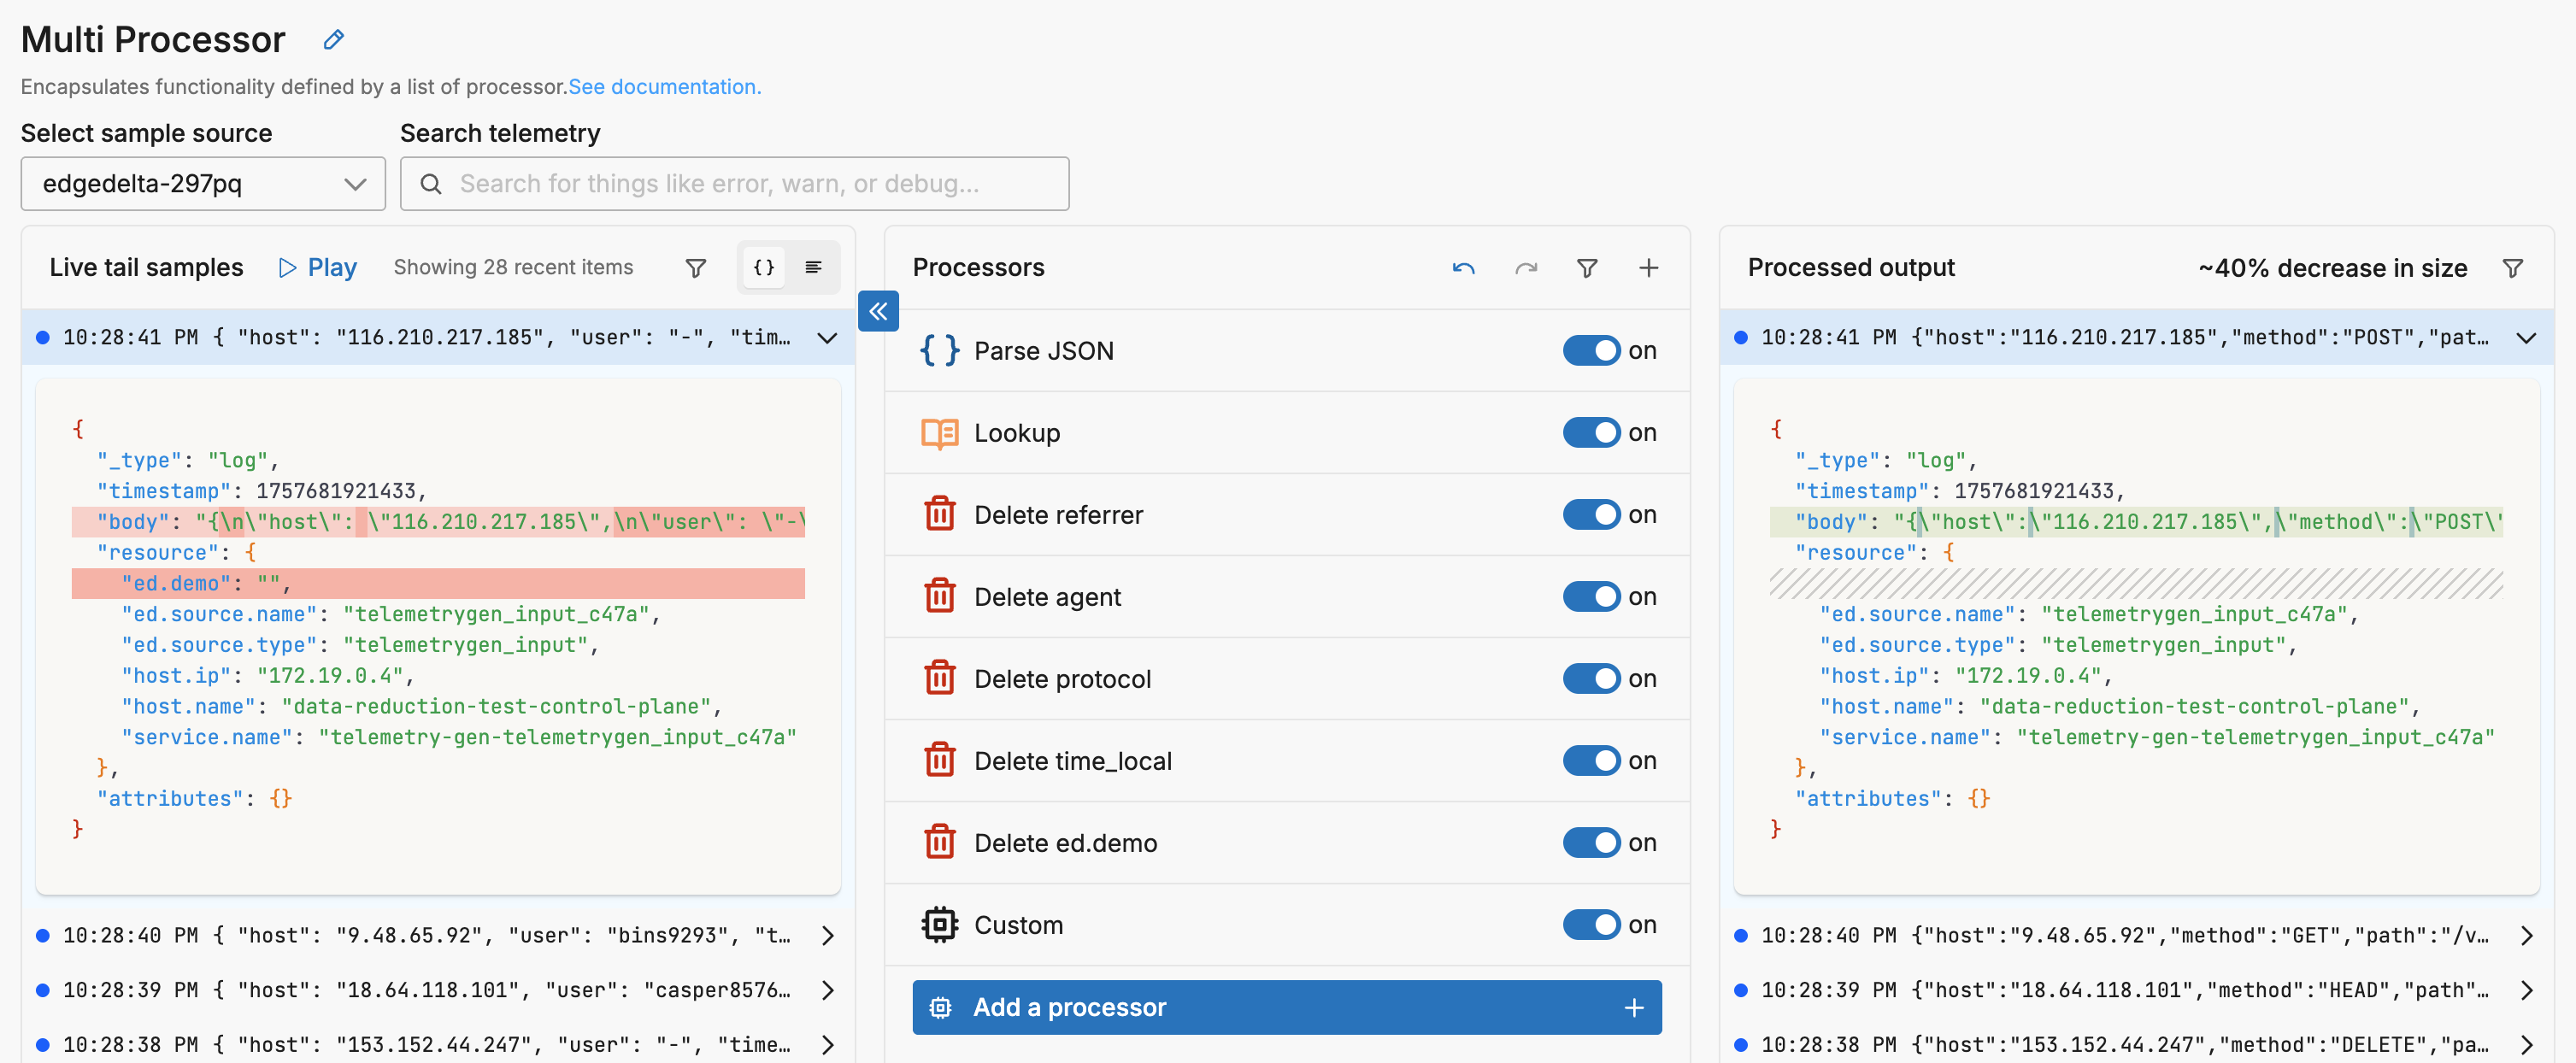
This stack parses the JSON body to extract fields, then uses a lookup table to map verbose user agent strings to descriptive codes (e.g., “Opera on Linux” instead of the full 80+ character agent string). It removes low-value fields like referrer, protocol, and time_local that either duplicate information or aren’t needed for analysis. Finally, it rebuilds a compact JSON body with just the essential fields and cleans up all temporary attributes. The result maintains queryable JSON structure while cutting size nearly in half.
Resulting in logs like this:
{
  "_type": "log",
  "timestamp": 1757681921433,
  "body": "{\"host\":\"116.210.217.185\",\"method\":\"POST\",\"path\":\"/v1/logout\",\"status\":201,\"bytes\":1890,\"ua\":\"Opera on Linux\"}",
  "resource": {
    "ed.source.name": "telemetrygen_input_c47a",
    "ed.source.type": "telemetrygen_input",
    "host.ip": "172.19.0.4",
    "host.name": "data-reduction-test-control-plane",
    "service.name": "telemetry-gen-telemetrygen_input_c47a"
  },
  "attributes": {}
}
The GUI generates a pipeline with the following YAML in the Multi-processor node:
- type: ottl_transform
  metadata: '{"id":"32ZrlYDO9o2NbDLDHtfVu8M4cjm","type":"parse-json","name":"Parse JSON","isRecommendation":true}'
  data_types:
  - log
  statements: |-
    set(cache["parsed-json"], ParseJSON(body))
    merge_maps(attributes, cache["parsed-json"], "upsert") where IsMap(attributes) and IsMap(cache["parsed-json"])
    set(attributes, cache["parsed-json"]) where not (IsMap(attributes) and IsMap(cache["parsed-json"]))
- type: lookup
  metadata: '{"id":"pIAlUUWI-Uwh4YjTW4uYZ","type":"lookup","name":"Lookup"}'
  data_types:
  - log
  location_path: ed://user-agent-lookup.csv
  match_mode: regex
  key_fields:
  - event_field: attributes["agent"]
    lookup_field: pattern
  out_fields:
  - event_field: attributes["ua_code"]
    lookup_field: description
    default_value: UNKNOWN
- type: ottl_transform
  metadata: '{"id":"L1iI_zYCM65dr0HBJfpyX","type":"delete-field","name":"Delete referrer"}'
  data_types:
  - log
  statements: delete_key(attributes, "referrer")
- type: ottl_transform
  metadata: '{"id":"86qKJVwikulm2W-b-itVP","type":"delete-field","name":"Delete agent"}'
  data_types:
  - log
  statements: delete_key(attributes, "agent")
- type: ottl_transform
  metadata: '{"id":"fAKhdxZ5hAGFBuUa1cE6j","type":"delete-field","name":"Delete protocol"}'
  data_types:
  - log
  statements: delete_key(attributes, "protocol")
- type: ottl_transform
  metadata: '{"id":"aoI0D7etoJXTOqq9Plirv","type":"delete-field","name":"Delete time_local"}'
  data_types:
  - log
  statements: delete_key(attributes, "time_local")
- type: ottl_transform
  metadata: '{"id":"Q8gN2A-HuMEOOXNCOuP4w","type":"delete-field","name":"Delete ed.demo"}'
  data_types:
  - log
  statements: delete_key(resource, "ed.demo")
- type: ottl_transform
  metadata: '{"id":"yt0jnUXRrhwJx7QWThVMh","type":"ottl_transform","name":"Custom"}'
  data_types:
  - log
  statements: |-
    set(body, Format("{\"host\":\"%s\",\"method\":\"%s\",\"path\":\"%s\",\"status\":%d,\"bytes\":%d,\"ua\":\"%s\"}", [attributes["host"], attributes["method"], attributes["request"], attributes["response-code"], attributes["bytes"], attributes["ua_code"]]))
    delete_matching_keys(attributes, ".*")
The lookup table (user-agent-lookup.csv) maps common user agent patterns to short descriptive codes, reducing strings from 80-200 characters to 10-15 characters while maintaining analytical value.
Again, this processor stack could be reduced into a single OTTL Custom Processor with multiple statements, but it is useful to have the GUI available to quickly reorder, disable or otherwise configure processors.
- name: telemetrygen_input_4aa9_multiprocessor
  type: sequence
  user_description: Multi Processor
  processors:
  - type: ottl_transform
    metadata: '{"id":"xLmTEbB_j0e7UOzywBUwB","type":"ottl_transform","name":"Custom"}'
    data_types:
    - log
    statements: |-
      // Parse JSON and extract fields in one step
      set(cache["a"], ParseJSON(body))

      // Map user agent to code inline using where conditions
      set(cache["ua"], "Chrome") where IsMatch(String(cache["a"]["agent"]), ".*Chrome.*")
      set(cache["ua"], "Firefox") where IsMatch(String(cache["a"]["agent"]), ".*Firefox.*") and cache["ua"] == nil
      set(cache["ua"], "Safari") where IsMatch(String(cache["a"]["agent"]), ".*Safari.*") and not IsMatch(String(cache["a"]["agent"]), ".*Chrome.*") and cache["ua"] == nil
      set(cache["ua"], "Opera") where IsMatch(String(cache["a"]["agent"]), ".*Opera.*") and cache["ua"] == nil
      set(cache["ua"], "Bot") where IsMatch(String(cache["a"]["agent"]), ".*(bot|crawler|spider).*") and cache["ua"] == nil
      set(cache["ua"], "Other") where cache["ua"] == nil

      // Build compact JSON using Concat
      set(body, Concat(["{\"host\":\"", String(cache["a"]["host"]), "\",\"method\":\"", String(cache["a"]["method"]), "\",\"path\":\"", String(cache["a"]["request"]), "\",\"status\":", String(cache["a"]["response-code"]), ",\"bytes\":", String(cache["a"]["bytes"]), ",\"ua\":\"", cache["ua"], "\"}"], ""))

      // IMPORTANT: Clear all attributes to reduce size
      delete_matching_keys(attributes, ".*")

      // Clean up cache and resource
      delete_key(cache, "a")
      delete_key(cache, "ua")
      delete_key(resource, "ed.demo")
This optimized processor achieves 45% reduction (better than the GUI’s 40%) with cleaner code. It parses JSON once, uses conditional where statements for user agent mapping instead of an external lookup table, and builds the compact body with Concat. This single-processor approach outperforms the eight-processor GUI version in both efficiency and compression.
Scenario 3: Extreme Aggregation/Optimization
Consider this GCP Audit log:
{
  "_type": "log",
  "timestamp": 1757684811048,
  "body": "{\"insertId\":\"WpjlIoyaKV\",\"logName\":\"projects/affable-alpha-386416/logs/cloudaudit.googleapis.com%2Factivity\",\"protoPayload\":{\"@type\":\"type.googleapis.com/google.cloud.audit.AuditLog\",\"authenticationInfo\":{\"principalEmail\":\"153750138338-compute@developer.gserviceaccount.com\",\"principalSubject\":\"serviceAccount:153750138338-compute@developer.gserviceaccount.com\",\"serviceAccountKeyName\":\"//iam.googleapis.com/projects/affable-alpha-386416/serviceAccounts/153750138338-compute@developer.gserviceaccount.com/keys/76b9aeba5cdb268d4fe4e0e9ddfeea35eea0647f\"},\"authorizationInfo\":[{\"granted\":true,\"permission\":\"pubsub.topics.attachSubscription\",\"resource\":\"projects/affable-alpha-386416/topics/all4\",\"resourceAttributes\":{}}],\"methodName\":\"google.pubsub.v1.Subscriber.CreateSubscription\",\"request\":{\"@type\":\"type.googleapis.com/google.pubsub.v1.Subscription\",\"name\":\"projects/affable-alpha-415524/subscriptions/all4sub\",\"topic\":\"projects/affable-alpha-910731/topics/all4\"},\"requestMetadata\":{\"callerIp\":\"175.55.149.113\",\"callerSuppliedUserAgent\":\"grpc-node-js/1.6.8,gzip(gfe)\",\"destinationAttributes\":{},\"requestAttributes\":{\"auth\":{},\"time\":\"2025-09-12T13:46:51.048270838Z\"}},\"resourceName\":\"projects/affable-alpha-703700/topics/all4\",\"response\":{\"@type\":\"type.googleapis.com/google.pubsub.v1.Subscription\"},\"serviceName\":\"pubsub.googleapis.com\"},\"receiveTimestamp\":\"2025-09-12T13:46:51.048270838Z\",\"resource\":{\"labels\":{\"project_id\":\"affable-alpha-312617\",\"topic_id\":\"projects/affable-alpha-894811/topics/all4\"},\"type\":\"pubsub_topic\"},\"severity\":\"NOTICE\",\"timestamp\":\"2025-09-12T13:46:51.048270838Z\"}",
  "resource": {
    "ed.demo": "",
    "ed.source.name": "telemetrygen_input_4aa9",
    "ed.source.type": "telemetrygen_input",
    "host.ip": "172.19.0.4",
    "host.name": "data-reduction-test-control-plane",
    "service.name": "telemetry-gen-telemetrygen_input_4aa9"
  },
  "attributes": {}
}
When this configuration is applied, log size is reduced by about 88% and converted to metrics.
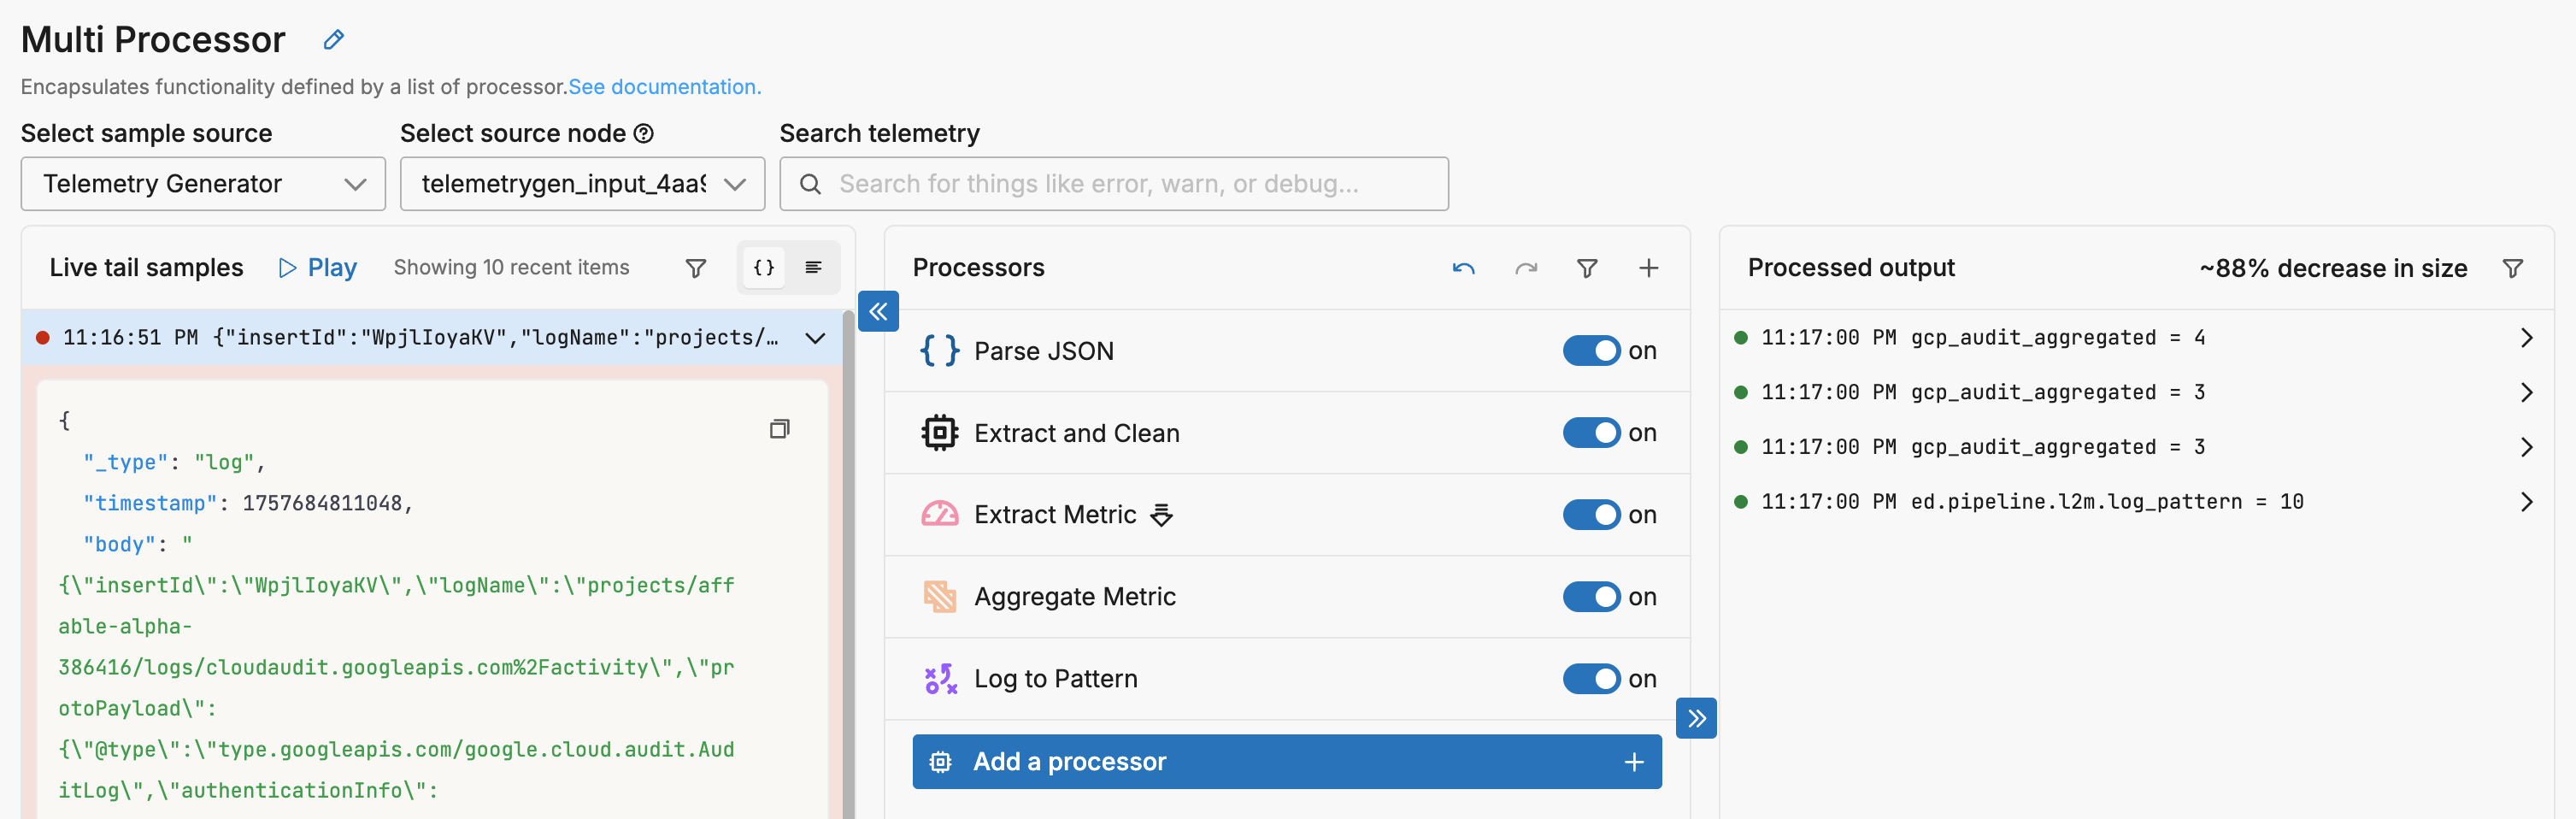
This stack parses the massive nested JSON to extract just five critical fields (service, method, user, severity, resource type) from over 50 fields in the audit payload. It immediately deletes the verbose protoPayload and other nested structures before any metric extraction occurs - this is crucial to prevent metrics from carrying unnecessary data. The pipeline then generates both aggregated metrics for dashboards and pattern metrics for anomaly detection, replacing thousands of bytes of audit detail with compact, actionable signals. The result transforms verbose audit logs into lean metrics while preserving full observability through aggregation.
Resulting in metrics like this:
{
  "_type": "metric",
  "timestamp": 1757684820000,
  "resource": {},
  "attributes": {
    "method": "google.pubsub.v1.Subscriber.CreateSubscription",
    "pattern": "pubsub.googleapis.com google.pubsub.v1.Subscriber.CreateSubscription by 153750138338-compute@developer.gserviceaccount.com - NOTICE",
    "service": "pubsub.googleapis.com",
    "severity": "NOTICE"
  },
  "kind": "sum",
  "name": "gcp_audit_aggregated",
  "start_timestamp": 1757684810000,
  "sum": {
    "aggregation_temporality": "cumulative",
    "is_monotonic": false,
    "value": 4
  },
  "unit": "1",
  "_stat_type": "sum"
}
The GUI generates a pipeline with the following YAML in the Multi-processor node:
- type: ottl_transform
  metadata: '{"id":"32ZqUErKPAOS80x4ftfV17vC6zi","type":"parse-json","name":"Parse JSON"}'
  data_types:
  - log
  statements: |-
    set(cache["parsed-json"], ParseJSON(body))
    merge_maps(attributes, cache["parsed-json"], "upsert") where IsMap(attributes) and IsMap(cache["parsed-json"])
    set(attributes, cache["parsed-json"]) where not (IsMap(attributes) and IsMap(cache["parsed-json"]))
- type: ottl_transform
  metadata: '{"id":"Ooji6H0r2e89z9d1_40yy","type":"ottl_transform","name":"Extract and Clean"}'
  data_types:
  - log
  statements: |-
    // Extract only the essential fields
    set(cache["service"], String(attributes["protoPayload"]["serviceName"]))
    set(cache["method"], String(attributes["protoPayload"]["methodName"]))
    set(cache["user"], String(attributes["protoPayload"]["authenticationInfo"]["principalEmail"]))
    set(cache["severity"], String(attributes["severity"]))
    set(cache["resource_type"], String(attributes["resource"]["type"]))

    // Create compact pattern
    set(attributes["pattern"], Concat([cache["service"], " ", cache["method"], " by ", cache["user"], " - ", cache["severity"]], ""))
    set(body, attributes["pattern"])

    // DELETE VERBOSE FIELDS IMMEDIATELY (before metrics)
    delete_key(attributes, "protoPayload")
    delete_key(attributes, "insertId")
    delete_key(attributes, "logName")
    delete_key(attributes, "receiveTimestamp")
    delete_key(attributes, "resource")
    delete_key(attributes, "timestamp")

    // Set dimensions for metrics
    set(attributes["service"], cache["service"])
    set(attributes["method"], cache["method"])
    set(attributes["severity"], cache["severity"])
- type: extract_metric
  metadata: '{"id":"hk1ewFWnss-jytQr_kZ1x","type":"extract_metric","name":"Extract Metric"}'
  keep_item: true
  data_types:
  - log
  extract_metric_rules:
  - name: gcp_audit_events
    unit: "1"
    sum:
      aggregation_temporality: cumulative
      value: "1"
- type: aggregate_metric
  metadata: '{"id":"Q89VVlmBfkh75nzuDvl6P","type":"aggregate_metric","name":"Aggregate Metric"}'
  data_types:
  - metric
  aggregate_metric_rules:
  - name: gcp_audit_aggregated
    interval: 10s
    aggregation_type: count
    group_by:
    - attributes["service"]
    - attributes["method"]
    - attributes["severity"]
- type: log_to_pattern_metric
  metadata: '{"id":"6QCbncbPA8i01vrerrH96","type":"log_to_pattern_metric","name":"Log to Pattern"}'
  data_types:
  - log
  reporting_frequency: 30s