Docker Logs Connector
Configure the Docker Logs connector to collect container logs from Docker environments for analysis by AI teammates.
10 minute read
Overview
The Docker Logs connector collects logs from Docker containers running in non-Kubernetes environments. It streams container logs from Docker hosts, Docker Compose deployments, and standalone containers into Edge Delta Pipelines, making the data available for AI teammates to query through the Edge Delta MCP connector.
When you add this streaming connector, it appears as a Docker Logs source in your selected pipeline. AI teammates access this data by querying the Edge Delta backend with the Edge Delta MCP connector.
Add the Docker Logs Connector
To add the Docker Logs connector, you configure filters to specify which containers to monitor, then deploy to a Docker-type environment.
Prerequisites
Before configuring the connector, ensure you have:
- Edge Delta agent deployed on Docker host
- Docker socket access for Edge Delta agent (
/var/run/docker.sockmounted as read-only) - Docker-type environment configured, or ability to create one
Configuration Steps
- Navigate to AI Team > Connectors in the Edge Delta application
- Find the Docker Logs connector in Streaming Connectors
- Click the connector card
- Configure container filters (see below)
- Select a Docker-type environment (or click Docker to create one)
- Click Save
The connector is now collecting logs from matching containers.
Configuration Options
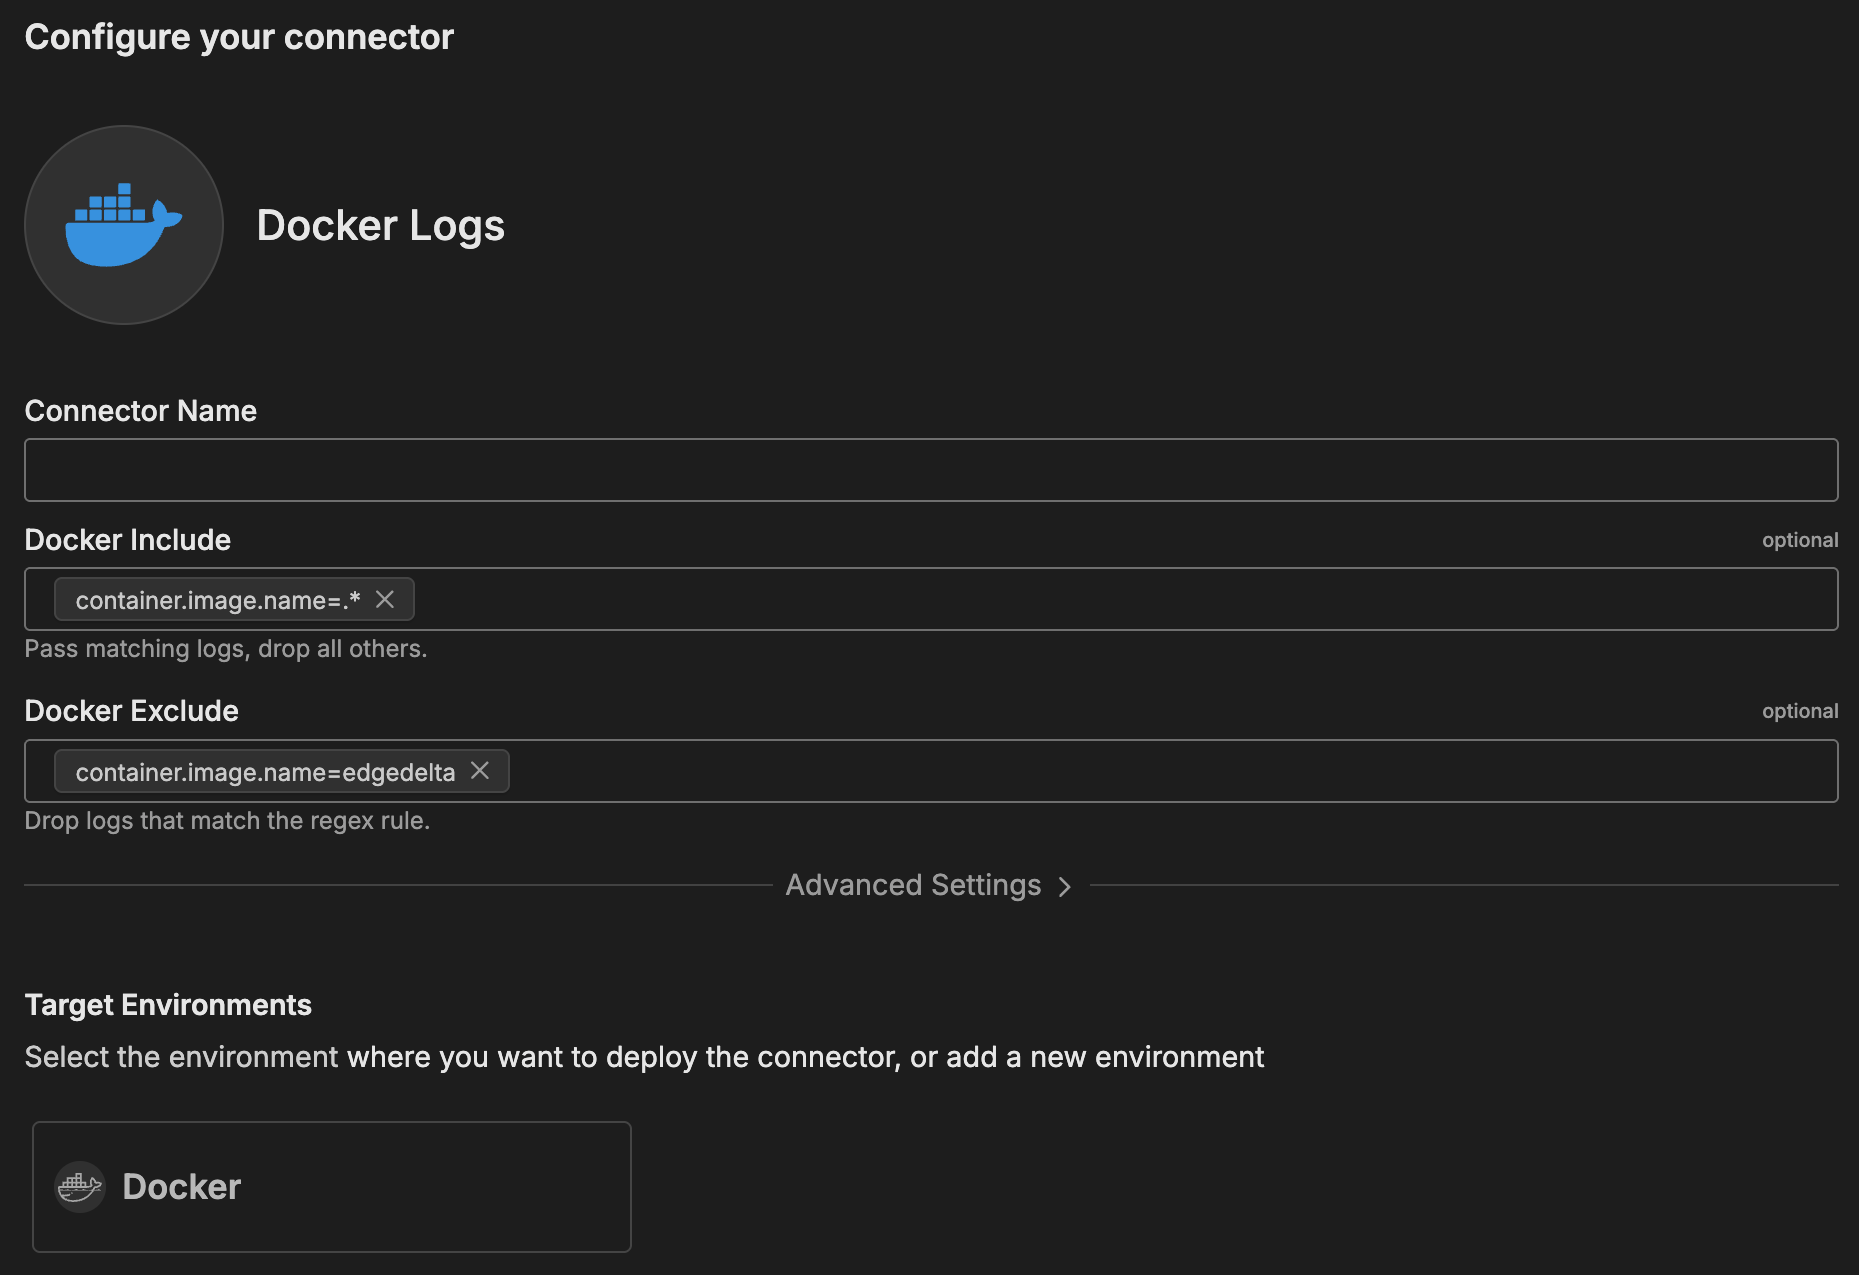
Connector Name
Name to identify this Docker Logs connector instance.
Docker Include
Filter to specify which containers to monitor. Use regex patterns matching container names, images, or labels.
Format: key=value where key is name, image, or label.* and value is a regex pattern
Examples:
name=.*- Monitor all containersname=^my-app$- Monitor specific containerimage=nginx:.*- Monitor all nginx containerslabel.com.docker.compose.service=web- Monitor by Compose service labellabel.com.docker.compose.service=(web|api|worker)- Monitor multiple services
Docker Exclude
Optional filter to exclude specific containers even if they match include patterns. Uses same format as Docker Include.
Examples:
name=.*test.*- Exclude test containerslabel.com.docker.compose.service=db- Exclude database service
Advanced Settings
Metadata Level
This option is used to define which detected resources and attributes to add to each data item as it is ingested by Edge Delta. You can select:
- Required Only: This option includes the minimum required resources and attributes for Edge Delta to operate.
- Default: This option includes the required resources and attributes plus those selected by Edge Delta
- High: This option includes the required resources and attributes along with a larger selection of common optional fields.
- Custom: With this option selected, you can choose which attributes and resources to include. The required fields are selected by default and can’t be unchecked.
Based on your selection in the GUI, the source_metadata YAML is populated as two dictionaries (resource_attributes and attributes) with Boolean values.
See Choose Data Item Metadata for more information on selecting metadata.
Rate Limit
The rate_limit parameter enables you to control data ingestion based on system resource usage. This advanced setting helps prevent source nodes from overwhelming the agent by automatically throttling or stopping data collection when CPU or memory thresholds are exceeded.
Use rate limiting to prevent runaway log collection from overwhelming the agent in high-volume sources, protect agent stability in resource-constrained environments with limited CPU/memory, automatically throttle during bursty traffic patterns, and ensure fair resource allocation across source nodes in multi-tenant deployments.
When rate limiting triggers, pull-based sources (File, S3, HTTP Pull) stop fetching new data, push-based sources (HTTP, TCP, UDP, OTLP) reject incoming data, and stream-based sources (Kafka, Pub/Sub) pause consumption. Rate limiting operates at the source node level, where each source with rate limiting enabled independently monitors and enforces its own thresholds.
Rate limiting vs backpressure: Rate limiting and backpressure are different mechanisms. Rate limiting controls data ingestion at the source based on CPU or memory thresholds. Backpressure controls data output at the destination when in-memory queues fill up. Backpressure logs such as
backpressure: dataCh at 92% capacitydo not appear when rate limiting triggers, and rate limiting logs do not appear during backpressure events.
Observability: When rate limiting is active in enforce mode, the agent does not produce INFO, WARN, or ERROR level logs. To confirm that rate limiting is triggering, check the source node’s Bytes I/O metrics in the Edge Delta app for gaps or drops that coincide with expected throttling periods.
Configuration Steps:
- Click Add New in the Rate Limit section
- Click Add New for Evaluation Policy
- Select Policy Type:
- CPU Usage: Monitors CPU consumption and rate limits when usage exceeds defined thresholds. Use for CPU-intensive sources like file parsing or complex transformations.
- Memory Usage: Monitors memory consumption and rate limits when usage exceeds defined thresholds. Use for memory-intensive sources like large message buffers or caching.
- AND (composite): Combines multiple sub-policies with AND logic. All sub-policies must be true simultaneously to trigger rate limiting. Use when you want conservative rate limiting (both CPU and memory must be high).
- OR (composite): Combines multiple sub-policies with OR logic. Any sub-policy can trigger rate limiting. Use when you want aggressive rate limiting (either CPU or memory being high triggers).
- Select Evaluation Mode. Choose how the policy behaves when thresholds are exceeded:
- Enforce (default): Actively applies rate limiting when thresholds are met. Pull-based sources (File, S3, HTTP Pull) stop fetching new data, push-based sources (HTTP, TCP, UDP, OTLP) reject incoming data, and stream-based sources (Kafka, Pub/Sub) pause consumption. Use in production to protect agent resources.
- Monitor: Logs when rate limiting would occur without actually limiting data flow. Use for testing thresholds before enforcing them in production.
- Passthrough: Disables rate limiting entirely while keeping the configuration in place. Use to temporarily disable rate limiting without removing configuration.
- Set Absolute Limits and Relative Limits (for CPU Usage and Memory Usage policies)
Note: If you specify both absolute and relative limits, the system evaluates both conditions and rate limiting triggers when either condition is met (OR logic). For example, if you set absolute limit to
1.0CPU cores and relative limit to50%, rate limiting triggers when the source uses either 1 full core OR 50% of available CPU, whichever happens first.
For CPU Absolute Limits: Enter value in full core units:
0.1= one-tenth of a CPU core0.5= half a CPU core1.0= one full CPU core2.0= two full CPU cores
For CPU Relative Limits: Enter percentage of total available CPU (0-100):
50= 50% of available CPU75= 75% of available CPU85= 85% of available CPU
For Memory Absolute Limits: Enter value in bytes
104857600= 100Mi (100 × 1024 × 1024)536870912= 512Mi (512 × 1024 × 1024)1073741824= 1Gi (1 × 1024 × 1024 × 1024)
For Memory Relative Limits: Enter percentage of total available memory (0-100)
60= 60% of available memory75= 75% of available memory80= 80% of available memory
- Set Refresh Interval (for CPU Usage and Memory Usage policies). Specify how frequently the system checks resource usage:
- Recommended Values:
10sto30sfor most use cases5sto10sfor high-volume sources requiring quick response1mor higher for stable, low-volume sources
The system fetches current CPU/memory usage at the specified refresh interval and uses that value for evaluation until the next refresh. Shorter intervals provide more responsive rate limiting but incur slightly higher overhead, while longer intervals are more efficient but slower to react to sudden resource spikes.
The GUI generates YAML as follows:
# Simple CPU-based rate limiting
nodes:
  - name: <node name>
    type: <node type>
    rate_limit:
      evaluation_policy:
        policy_type: cpu_usage
        evaluation_mode: enforce
        absolute_limit: 0.5  # Limit to half a CPU core
        refresh_interval: 10s
# Simple memory-based rate limiting
nodes:
  - name: <node name>
    type: <node type>
    rate_limit:
      evaluation_policy:
        policy_type: memory_usage
        evaluation_mode: enforce
        absolute_limit: 536870912  # 512Mi in bytes
        refresh_interval: 30s
Composite Policies (AND / OR)
When using AND or OR policy types, you define sub-policies instead of limits. Sub-policies must be siblings (at the same level)—do not nest sub-policies within other sub-policies. Each sub-policy is independently evaluated, and the parent policy’s evaluation mode applies to the composite result.
- AND Logic: All sub-policies must evaluate to true at the same time to trigger rate limiting. Use when you want conservative rate limiting (limit only when CPU AND memory are both high).
- OR Logic: Any sub-policy evaluating to true triggers rate limiting. Use when you want aggressive protection (limit when either CPU OR memory is high).
Configuration Steps:
- Select AND (composite) or OR (composite) as the Policy Type
- Choose the Evaluation Mode (typically Enforce)
- Click Add New under Sub-Policies to add the first condition
- Configure the first sub-policy by selecting policy type (CPU Usage or Memory Usage), selecting evaluation mode, setting absolute and/or relative limits, and setting refresh interval
- In the parent policy (not within the child), click Add New again to add a sibling sub-policy
- Configure additional sub-policies following the same pattern
The GUI generates YAML as follows:
# AND composite policy - both CPU AND memory must exceed limits
nodes:
  - name: <node name>
    type: <node type>
    rate_limit:
      evaluation_policy:
        policy_type: and
        evaluation_mode: enforce
        sub_policies:
          # First sub-policy (sibling)
          - policy_type: cpu_usage
            evaluation_mode: enforce
            absolute_limit: 0.75  # Limit to 75% of one core
            refresh_interval: 15s
          # Second sub-policy (sibling)
          - policy_type: memory_usage
            evaluation_mode: enforce
            absolute_limit: 1073741824  # 1Gi in bytes
            refresh_interval: 15s
# OR composite policy - either CPU OR memory can trigger
nodes:
  - name: <node name>
    type: <node type>
    rate_limit:
      evaluation_policy:
        policy_type: or
        evaluation_mode: enforce
        sub_policies:
          - policy_type: cpu_usage
            evaluation_mode: enforce
            relative_limit: 85  # 85% of available CPU
            refresh_interval: 20s
          - policy_type: memory_usage
            evaluation_mode: enforce
            relative_limit: 80  # 80% of available memory
            refresh_interval: 20s
# Monitor mode for testing thresholds
nodes:
  - name: <node name>
    type: <node type>
    rate_limit:
      evaluation_policy:
        policy_type: memory_usage
        evaluation_mode: monitor  # Only logs, doesn't limit
        relative_limit: 70  # Test at 70% before enforcing
        refresh_interval: 30s
Target Environments
Select a Docker-type environment where you want to deploy this connector. If no Docker environments exist, click Docker to create a new Docker environment.
How to Use the Docker Logs Connector
The Docker Logs connector integrates seamlessly with AI Team, enabling analysis of container logs from Docker environments. AI teammates automatically leverage the ingested data based on the queries they receive and the context of the conversation.
Use Case: Docker Compose Application Monitoring
Monitor all services in a Docker Compose application while excluding infrastructure containers. AI teammates can analyze application logs, identify error patterns, and correlate issues across multiple containers. For example, when investigating checkout failures, teammates analyze logs from frontend, API, and payment containers to identify the failure sequence.
Configuration: Include: label.com.docker.compose.project=myapp, Exclude: label.com.docker.compose.service=db
Use Case: Container Restart Analysis
When containers repeatedly restart, AI teammates can analyze logs immediately before restart events to identify crash patterns. This is valuable when combined with alert connectors like PagerDuty—teammates investigate restart alerts by querying recent container logs to pinpoint root causes like memory exhaustion or unhandled exceptions.
Configuration: Include: image=mycompany/.* (monitor all company containers)
Use Case: Development Environment Debugging
Monitor local development containers to troubleshoot startup issues and configuration problems. AI teammates analyze startup logs to identify missing environment variables, network connectivity issues, or service dependency failures, accelerating developer debugging without manual log inspection.
Configuration: Include: name=^dev-.* (monitor containers with dev- prefix)
Troubleshooting
No logs appearing: Verify Docker socket is mounted (ls -la /var/run/docker.sock inside Edge Delta container). Check that include filters match running containers (docker ps).
Permission denied errors: Ensure Docker socket is mounted with read permissions (:ro flag). Verify Edge Delta container user has docker group access.
Only some containers monitored: Check that exclude filters aren’t too broad. Remember exclude rules apply after include rules.
Missing log entries: Verify containers log to stdout/stderr, not to files. Check container logging driver with docker inspect <container> | grep LogConfig.
High CPU/memory usage: Narrow include filters to monitor only relevant containers. Use exclude filters to remove verbose infrastructure containers. Set appropriate rate limits.
Next Steps
- Learn about creating custom teammates that can use Docker logs
- Explore the Edge Delta MCP connector for querying container logs
For additional help, visit AI Team Support.