Give AI Teammates Access to Your Observability Data
Connect AI teammates to your pipelines, logs, metrics, and dashboards. Enable autonomous incident triage and anomaly investigation.
9 minute read
Overview
The Edge Delta MCP (Model Context Protocol) connector is the primary connector for enabling AI Team members to access your Edge Delta platform data. Edge Delta is an AI-native telemetry data management platform that collects, processes, and routes logs, metrics, traces, and events through intelligent Telemetry Pipelines. By connecting the Edge Delta platform to AI Team, organizations can enable AI teammates to investigate incidents, analyze anomalies, query telemetry data, and manage pipeline configurations through natural language interactions.
The connector provides comprehensive access to your Edge Delta platform, allowing AI teammates to search logs using Edge Delta syntax with facets and filters, retrieve top log patterns with sentiment analysis, access metrics and time-series data, search anomaly events, view and query dashboard configurations, and manage pipeline configurations including deployment. This integration enables use cases such as automated incident investigation, anomaly analysis and correlation, log pattern analysis for trend identification, dashboard-driven monitoring workflows, and infrastructure management through pipeline configuration changes, making it valuable for teams that need to reduce mean time to resolution (MTTR) and empower their AI teammates with full observability platform access.
The Edge Delta MCP connector serves as the bridge between AI Team members—particularly the SRE—and your telemetry data. Without this connector, AI teammates cannot access your logs, metrics, events, or pipeline configurations. The connector is automatically available to built-in teammates like the SRE and Security Engineer, and can be assigned to custom teammates as needed.
Accessing Streaming Connector Data: When you configure streaming connectors (such as Kubernetes logs, file inputs, or OTLP), the telemetry data flows into your Edge Delta pipelines. AI teammates access this data through the Edge Delta MCP connector by querying the Edge Delta backend. This means teammates can search logs, analyze patterns, and investigate incidents from any streaming connector source.
Add the Edge Delta MCP Connector
To add the Edge Delta MCP connector, you navigate to the Connectors tab in AI Team and configure the connector using your existing platform credentials. The connector typically uses your current platform session for authentication, requiring minimal configuration.
Prerequisites
Before configuring the connector, ensure you have:
- An active Edge Delta account with at least one configured Telemetry Pipeline
- User permissions to access platform data
- AI Team feature enabled for your organization
Configuration Steps
- Navigate to AI Team > Connectors in the Edge Delta application
- Find the Edge Delta MCP Connector
- Click the connector card to open the configuration panel
- Review the available tools on the Tools tab
- Click Save to complete the configuration
The connector is now available for use by AI Team members who have been assigned this connector.
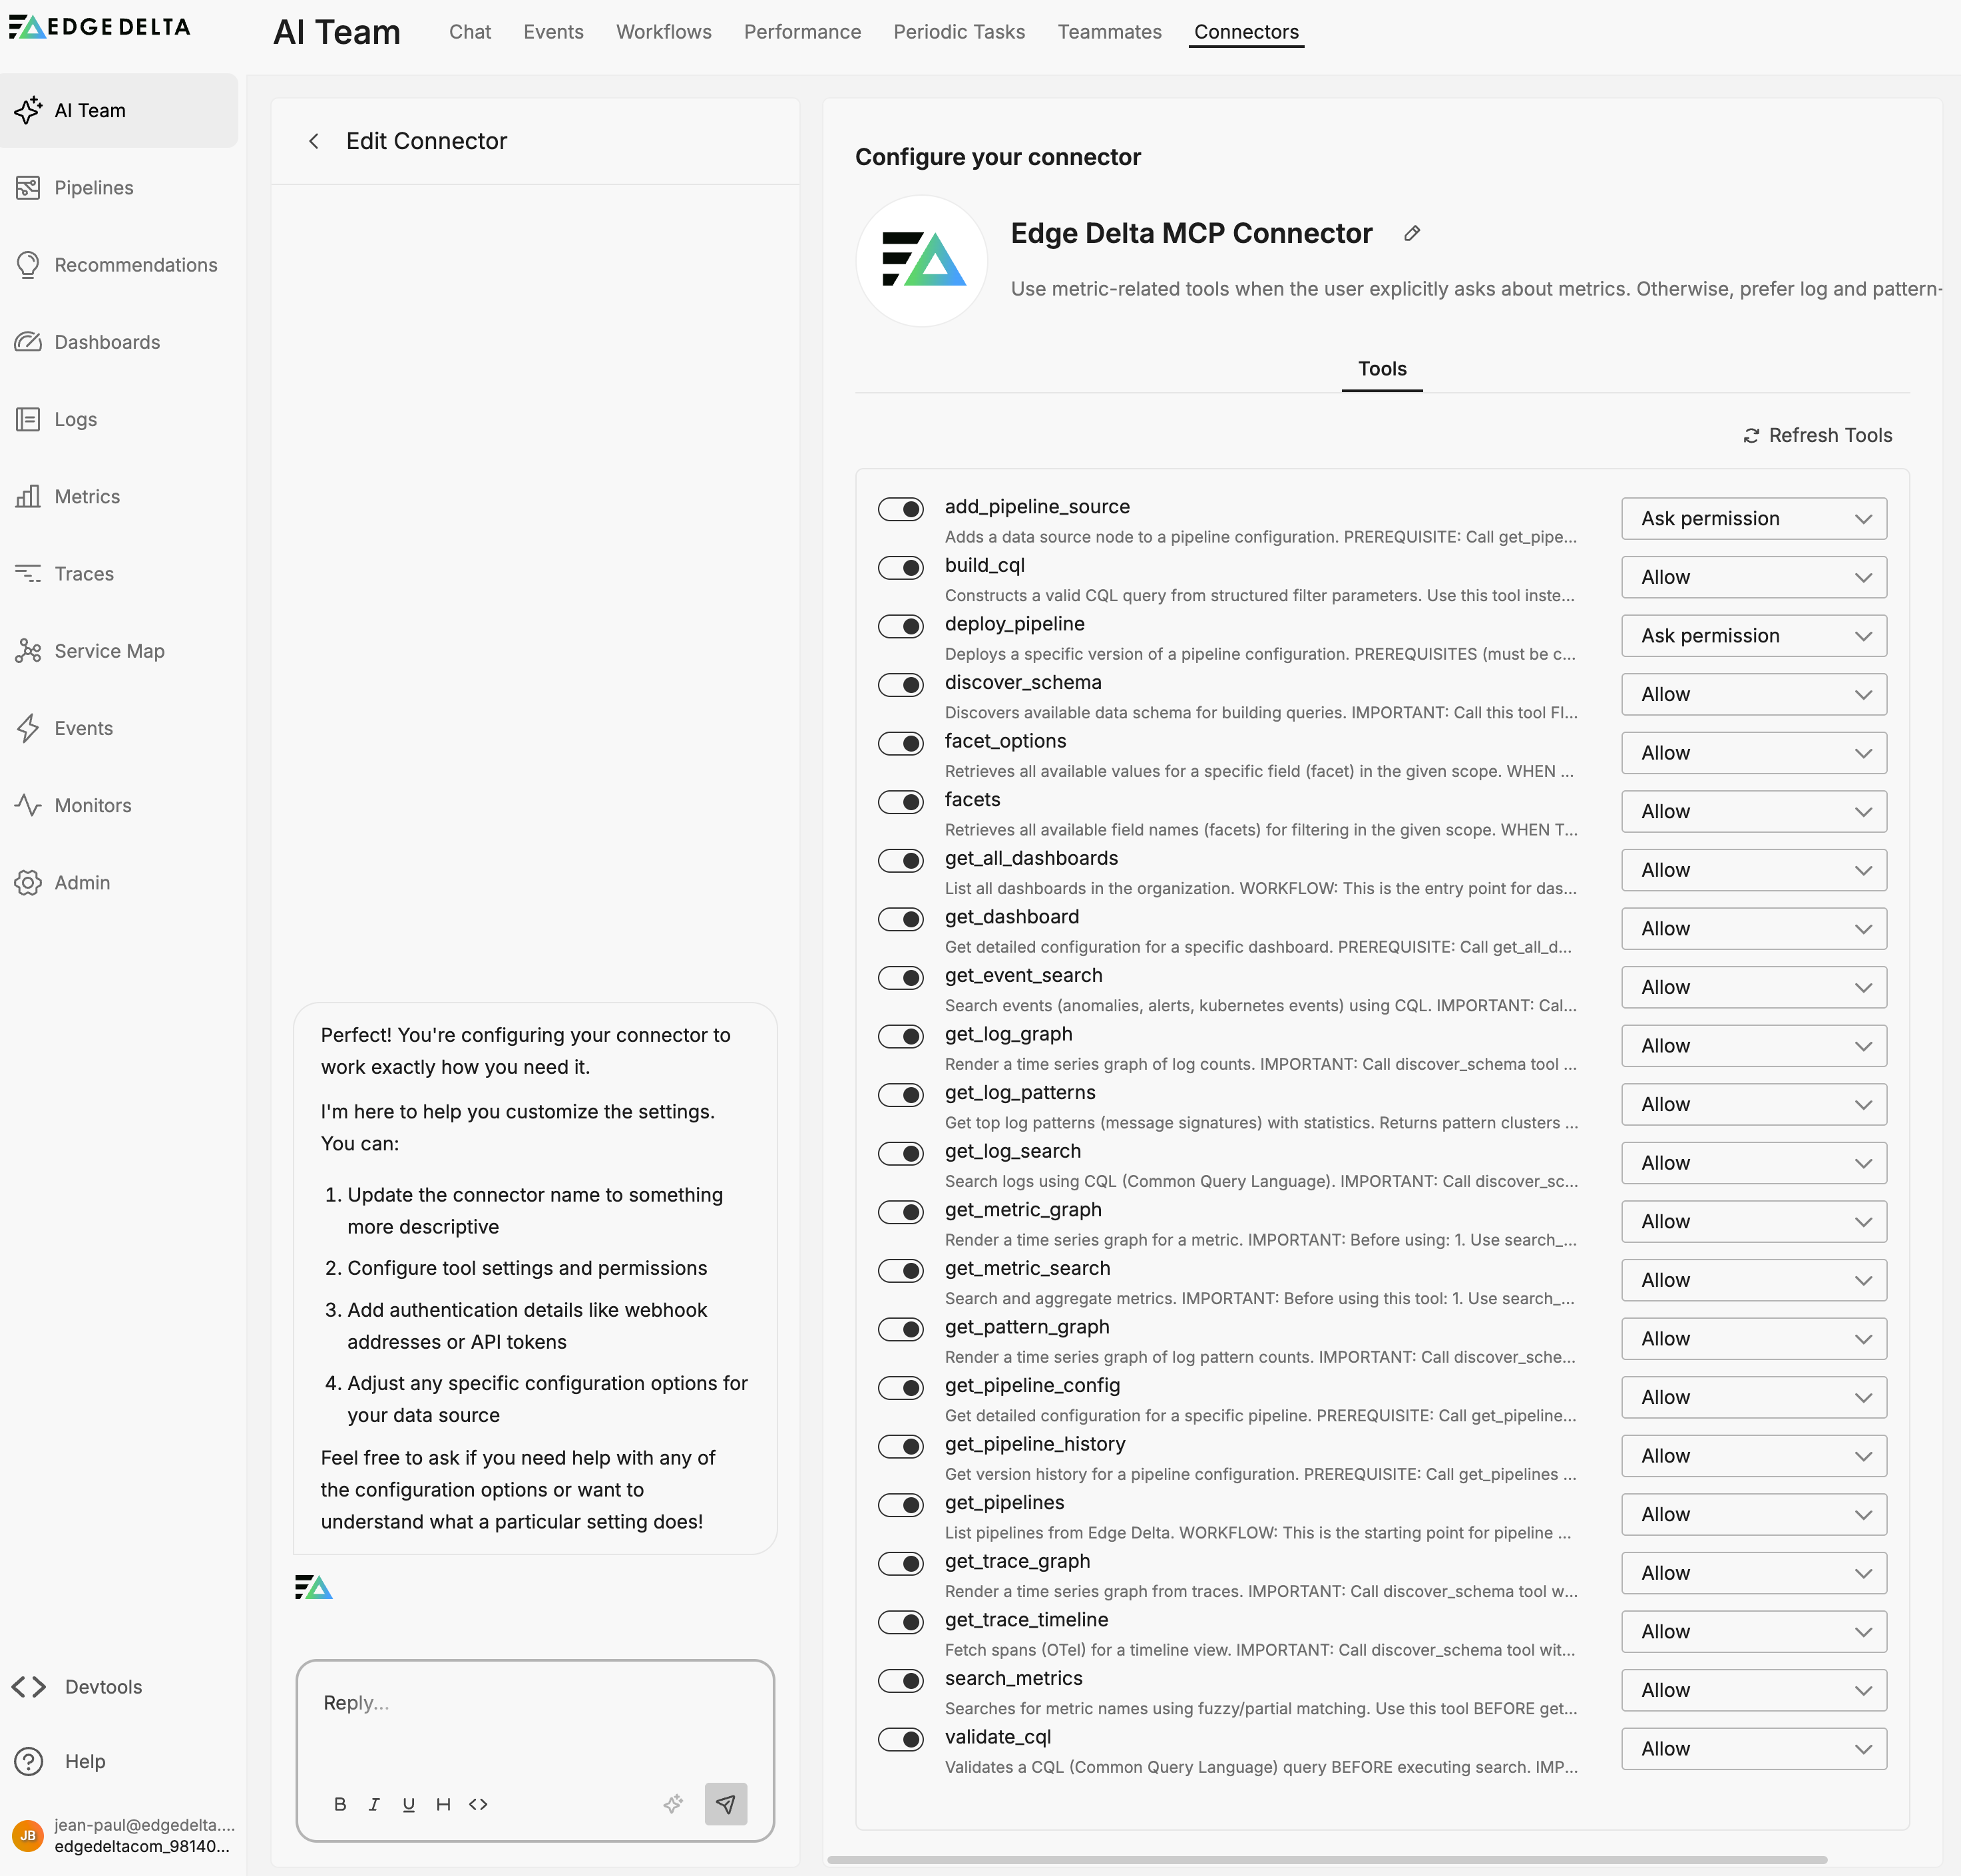
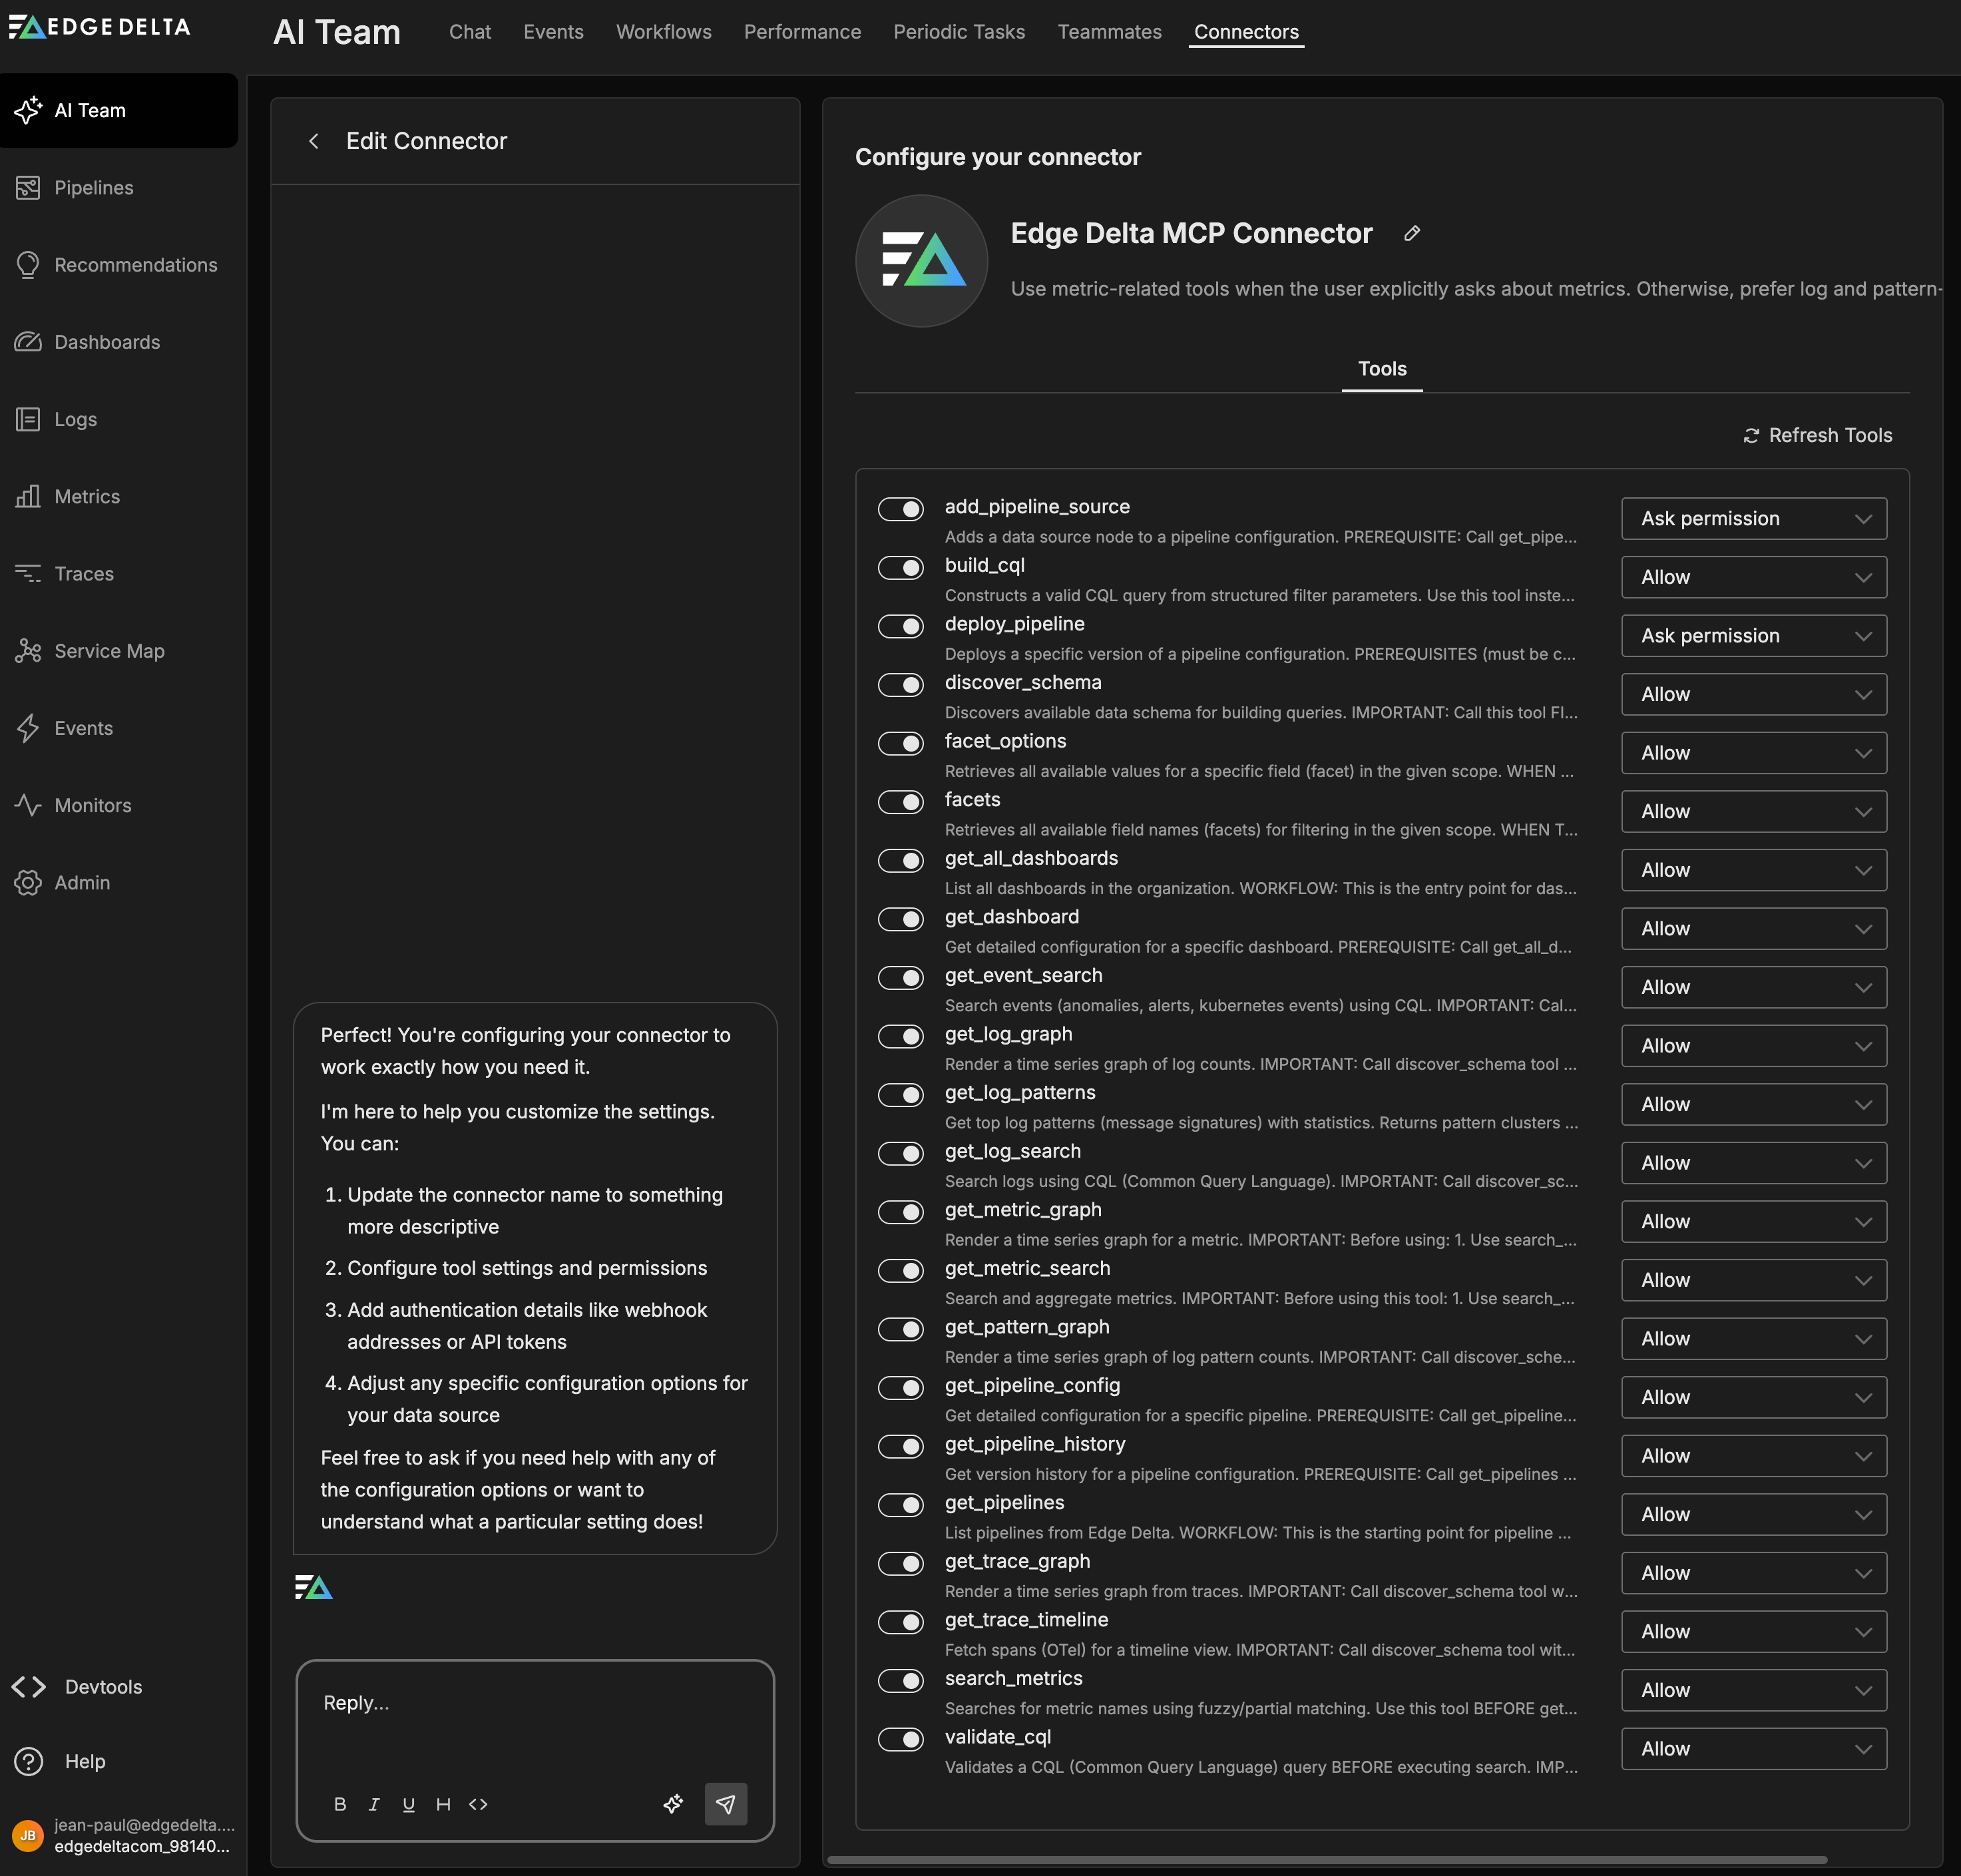
Tools
The Edge Delta MCP connector provides AI teammates with comprehensive access to your Edge Delta telemetry data and pipeline configurations through the following tools. Each tool can be individually enabled or disabled, and you can configure the permission level for each tool:
- Allow: The tool can be used freely by AI teammates without approval
- Ask Permission: The tool requires human approval before execution
The permission levels shown below represent the default configuration. You can adjust these settings based on your security requirements and operational policies.
add_pipeline_source
Adds a source node configuration to a pipeline and connects it to the Edge Delta Destination. This tool saves the updated pipeline configuration without deploying changes, allowing you to stage configuration updates for review before deployment. For details on available source types and their configurations, see the Sources overview.
build_cql
Constructs a valid CQL query from structured filter parameters. Use this tool instead of manually writing CQL strings to avoid syntax errors. It validates field names against known facet keys, constructs proper CQL syntax with correct quoting, and handles AND/OR/NOT logic automatically.
deploy_pipeline
Deploys a pipeline configuration to activate the changes. The version parameter is the timestamp from the pipeline history, which AI teammates retrieve using the get_pipeline_history tool.
discover_schema
Discovers available data schema for building queries within a given scope (logs, metrics, traces, patterns, or events). Returns all available field names, sample values for common fields, CQL syntax reference, and sample queries. Call this tool first before constructing any search queries.
facet_options
Retrieves facet options for a specific facet within a given scope. Use this tool to discover available filter values for constructing precise search queries. The results can be used to filter searches in logs, metrics, and traces with the syntax <facet_path>:<facet_option>.
facets
Retrieves all available facets for the given scope (logs, metrics, traces). Facets represent the dimensions and fields you can use to filter and group your telemetry data.
get_all_dashboards
Returns all dashboards in your organization, including dashboard names, IDs, and descriptions. Use this to discover what dashboards exist and what data they visualize.
get_dashboard
Returns the complete configuration for a specific dashboard, including all widgets, queries, and visualizations. Use this to understand what a particular dashboard displays or to troubleshoot dashboard-related questions.
get_event_search
Searches Edge Delta events using event search syntax. For anomaly searches, include event.type:pattern_anomaly in the query. Events represent significant occurrences detected by Edge Delta, such as anomalies, threshold violations, or pattern changes.
get_log_graph
Renders a time-series graph of log counts filtered by a CQL query. Use this to visualize log volume trends, error spikes, or traffic patterns over time.
get_log_patterns
Returns top log patterns (signatures of log messages) with their statistics including count, proportion, sentiment, and delta. Log patterns help identify common message templates and detect unusual log behavior. Set negative to true to filter for patterns with negative sentiment scores.
get_log_search
Searches logs using Edge Delta’s log search syntax. Supports complex queries with facet filters, time ranges, and field selectors. Use this tool to investigate specific log messages, error conditions, or application behavior.
get_metric_graph
Renders a time-series graph for a specific metric filtered by a CQL query. Use this to visualize metric trends such as CPU usage, request latency, or error rates over time.
get_metric_search
Searches metrics data using metric query syntax. Use this to retrieve time-series metric data, analyze performance trends, or investigate metric anomalies.
get_pattern_graph
Renders a time-series graph of log pattern counts filtered by a CQL query. Use this to visualize how specific log patterns change over time, including sentiment-based filtering.
get_pipeline_config
Returns the full configuration for a specific pipeline, including the config content, fleet assignment, and environment type. Use this after get_pipelines to inspect a pipeline’s detailed setup.
get_pipeline_history
Returns the version history of a pipeline configuration, showing all past configuration states with their timestamps. The timestamp values are used as the version parameter when deploying pipelines.
get_pipelines
Retrieves the 5 most recently updated pipelines from Edge Delta. Use this to discover available pipelines, check their current configuration, or identify which pipeline to modify.
get_trace_graph
Renders a time-series graph from trace data filtered by a CQL query. Use this to visualize trace volume, error rates by span kind, or latency distributions over time.
get_trace_timeline
Fetches trace spans for a timeline view filtered by a CQL query. Use this to inspect individual traces, view span hierarchies, and analyze request flow across services.
search_metrics
Searches for metric names using fuzzy or partial matching. Use this tool before get_metric_search or get_metric_graph when you do not know the exact metric name. Returns matching metric names ranked by relevance.
validate_cql
Validates a CQL query before execution. Returns validation results with errors, warnings, and suggestions for fixes. Use this to check query syntax before calling search or graph tools.
How to Use the Edge Delta MCP Connector
The Edge Delta MCP connector integrates seamlessly with AI Team, enabling AI teammates to investigate incidents, analyze telemetry data, and manage infrastructure through natural language interactions. AI teammates automatically leverage the connector based on the queries they receive and the context of the conversation. The connector is primarily used by the SRE teammate but is also valuable for Security Engineers and custom teammates focused on observability.
Use Case: Error Investigation and Root Cause Analysis
When investigating production incidents, AI teammates can use the Edge Delta MCP connector to quickly search through logs, identify error patterns, and correlate issues across services. This is particularly useful when you need to understand the scope and impact of an error condition without manually constructing complex search queries.
For example, when a user reports that the API service is experiencing errors, the AI Team can use the get_log_search tool to query logs filtered by service name and log level, examine the error messages and stack traces, and identify common patterns. The agent can then use the get_log_patterns tool to see if error rates have increased compared to historical baselines.
Use Case: Anomaly Detection and Analysis
The Edge Delta platform continuously monitors log patterns and detects anomalies using machine learning. AI teammates can query these detected anomalies, analyze their severity, and correlate them with other system events to provide comprehensive incident context.
For example, when you want to understand what unusual behavior has been detected in your systems today, the AI Team can search for pattern anomalies, analyze the sentiment of affected log patterns, retrieve example logs that triggered the anomaly, and correlate anomalies across multiple services to identify cascading failures. This workflow is particularly valuable for proactive incident detection and for understanding the broader impact of infrastructure issues.
Configuration for this use case:
No special configuration is needed beyond the standard connector setup.
Use Case: Dashboard-Driven Monitoring Workflows
AI teammates can access and interpret your existing dashboards, answering questions about what’s being monitored, what the current values are, and how to interpret the visualizations. This enables conversational access to your monitoring data without requiring users to navigate the UI.
For example, when asked about a specific dashboard, the AI Team can list all available dashboards to find the right one, retrieve the dashboard configuration including all widgets and queries, explain what each widget monitors, and provide current data from the dashboard’s queries. This is particularly useful for onboarding new team members, sharing monitoring context during incidents, and enabling remote or mobile access to dashboard insights.
Use Case: Pipeline Configuration Management
AI teammates can help manage Telemetry Pipeline configurations by adding new data sources, reviewing configuration history, and deploying changes. This enables infrastructure-as-conversation workflows where you can describe what you need and the agent implements it.
For example, when you need to add a new log source to an existing pipeline, the AI Team can retrieve the current pipeline configuration, add the appropriate source node configuration (file input, Kubernetes input, etc.), save the configuration, retrieve the updated version from pipeline history, and deploy the configuration after confirmation. This workflow reduces the time spent manually configuring pipelines and ensures consistent configuration patterns.
Configuration for this use case:
Ensure approval workflows are configured for deployment actions to prevent unintended changes to production pipelines. Tools like add_pipeline_source and deploy_pipeline should be set to “Ask Permission” rather than “Allow”.
Troubleshooting
Pipeline Deployment Workflow
When deploying pipeline configuration changes, AI teammates must use three tool calls in sequence:
- Save the configuration: Use
add_pipeline_sourceto add a source node and save the updated pipeline configuration - Retrieve the version ID: Use
get_pipeline_historyto get the timestamp of the newly saved configuration - Deploy the configuration: Use
deploy_pipelinewith the pipeline ID and version timestamp from step 2
This three-step workflow ensures that configuration changes are staged, versioned, and then activated.