Filebeat Connector
Configure the Filebeat connector to receive data from Filebeat, Logstash, Vector, and Elastic Beats agents using the Elasticsearch Bulk API protocol for AI-powered analysis.
22 minute read
Overview
The Filebeat connector receives data using the Elasticsearch Bulk API protocol. This connector enables Edge Delta to act as an Elasticsearch-compatible endpoint, allowing seamless integration with the entire Elastic ecosystem including Filebeat, Logstash, Metricbeat, and Vector. Content streams into Edge Delta Pipelines for analysis by AI teammates through the Edge Delta MCP connector.
This connector was previously named “Elasticsearch API” and was renamed in v2.11.0 to better reflect its primary use case of receiving data from Filebeat agents.
The connector provides native Elasticsearch Bulk API support with NDJSON format parsing and optional authentication. It accepts data from:
- Elastic Beats family: Filebeat, Metricbeat, Heartbeat, Auditbeat, Packetbeat, and Winlogbeat
- Logstash: Using the Elasticsearch output plugin
- Vector: Using the Elasticsearch sink
- Elastic Agent: Direct integration with Elasticsearch-compatible endpoints
- Custom applications: Any client that sends data using the Elasticsearch Bulk API
When you add this streaming connector, it appears as a Filebeat source in your selected pipeline. AI teammates access this data by querying the Edge Delta backend with the Edge Delta MCP connector.
Add the Filebeat Connector
To add the Filebeat connector, you configure a listening address and port where Edge Delta will accept incoming Elasticsearch Bulk API requests.
Prerequisites
Before configuring the connector, ensure you have:
- Filebeat, Logstash, Vector, or other Elasticsearch-compatible clients configured
- Network connectivity from clients to Edge Delta agent
- Firewall rules allowing inbound HTTP/HTTPS traffic on chosen port
- Available TCP port (9200 for Elasticsearch compatibility or custom port)
Configuration Steps
- Navigate to AI Team > Connectors in the Edge Delta application
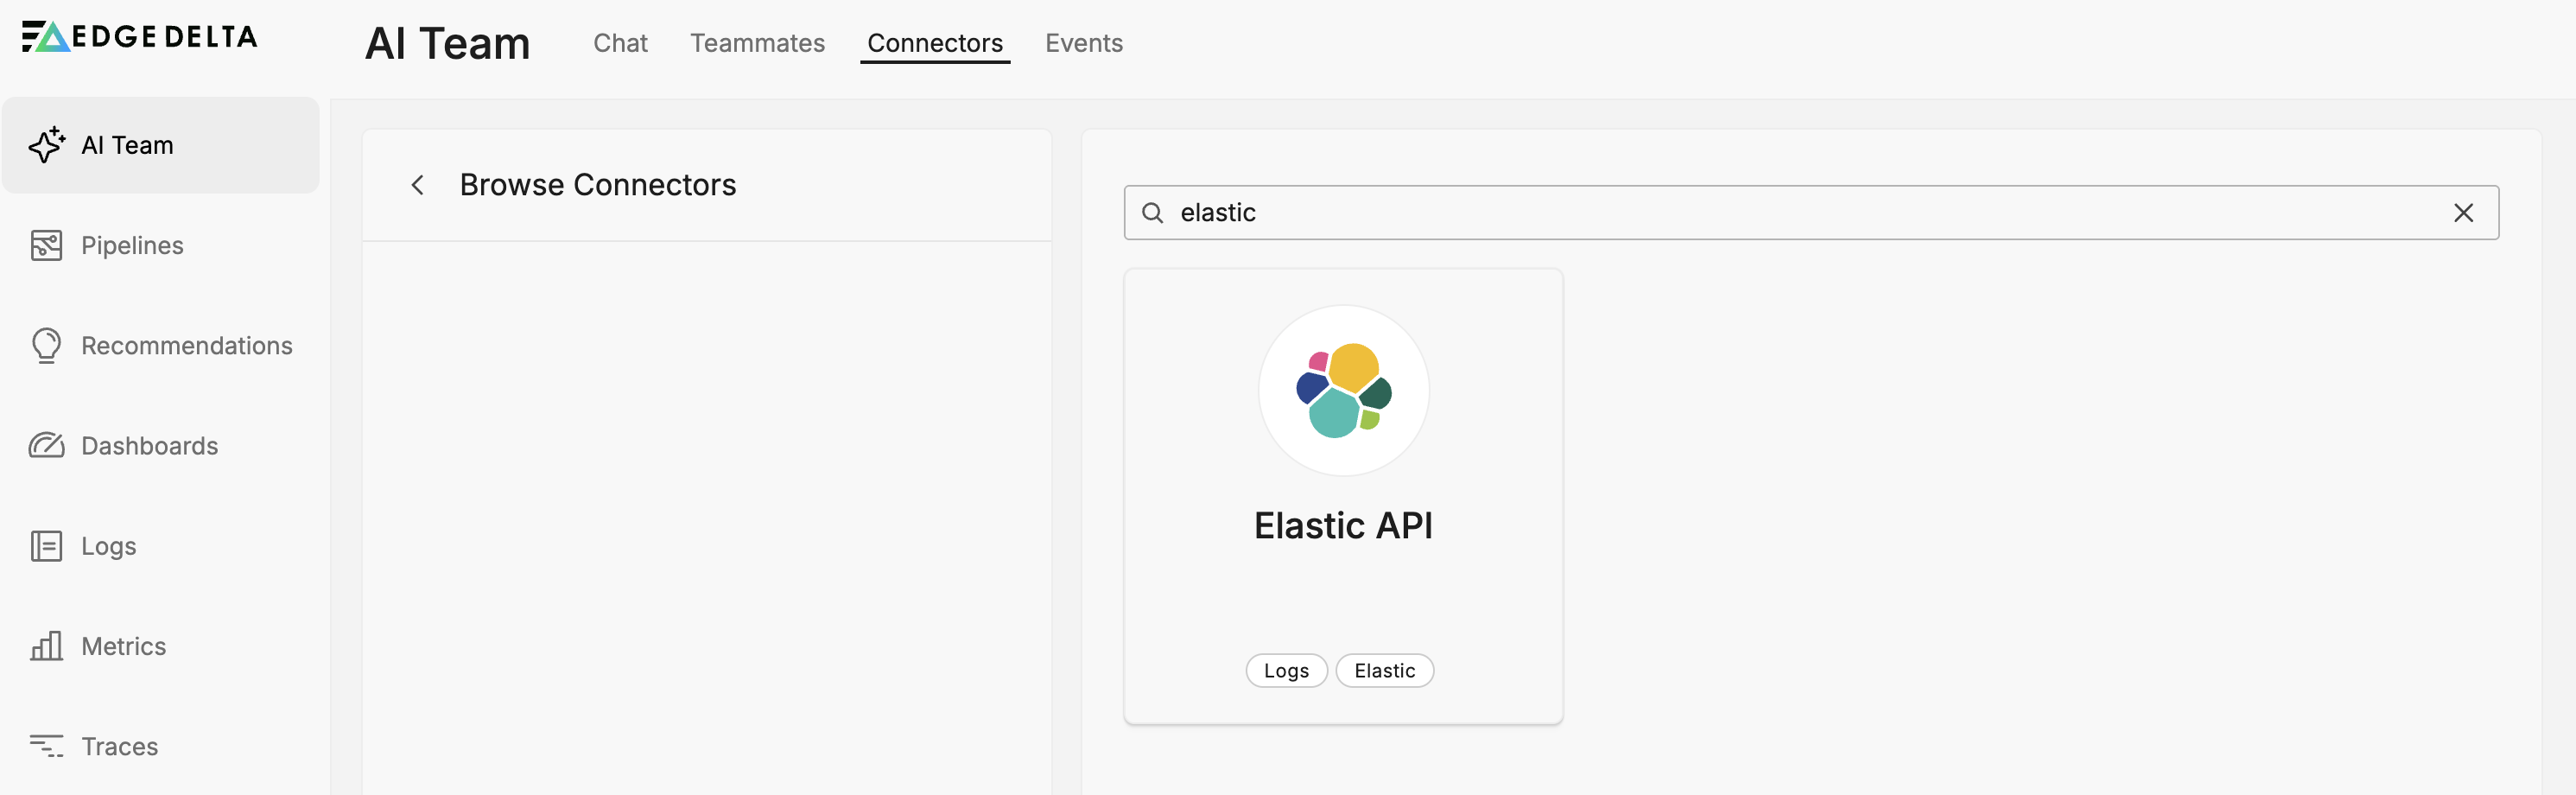
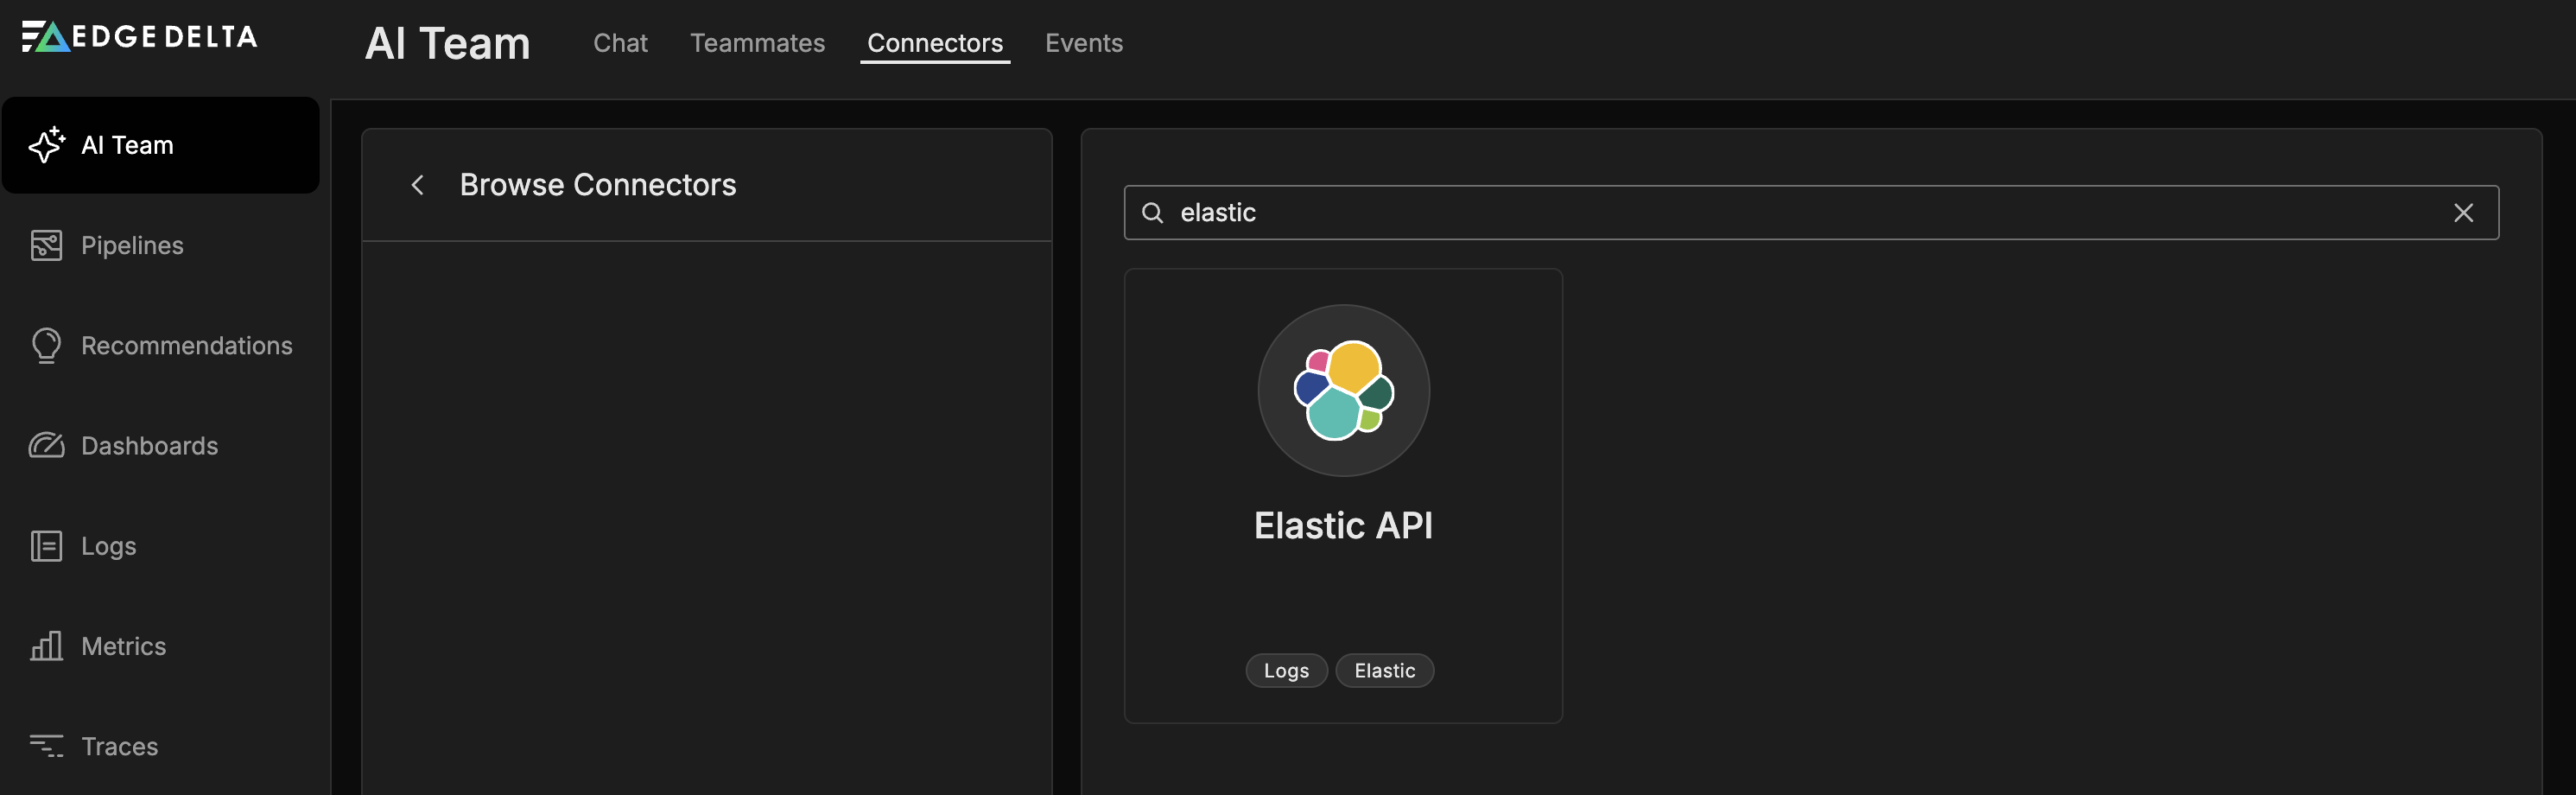
- Find the Elasticsearch API connector in Streaming Connectors
- Click the connector card
- Configure Listen address (default
0.0.0.0for all interfaces) - Set Port number (9200 for Elasticsearch compatibility or custom port)
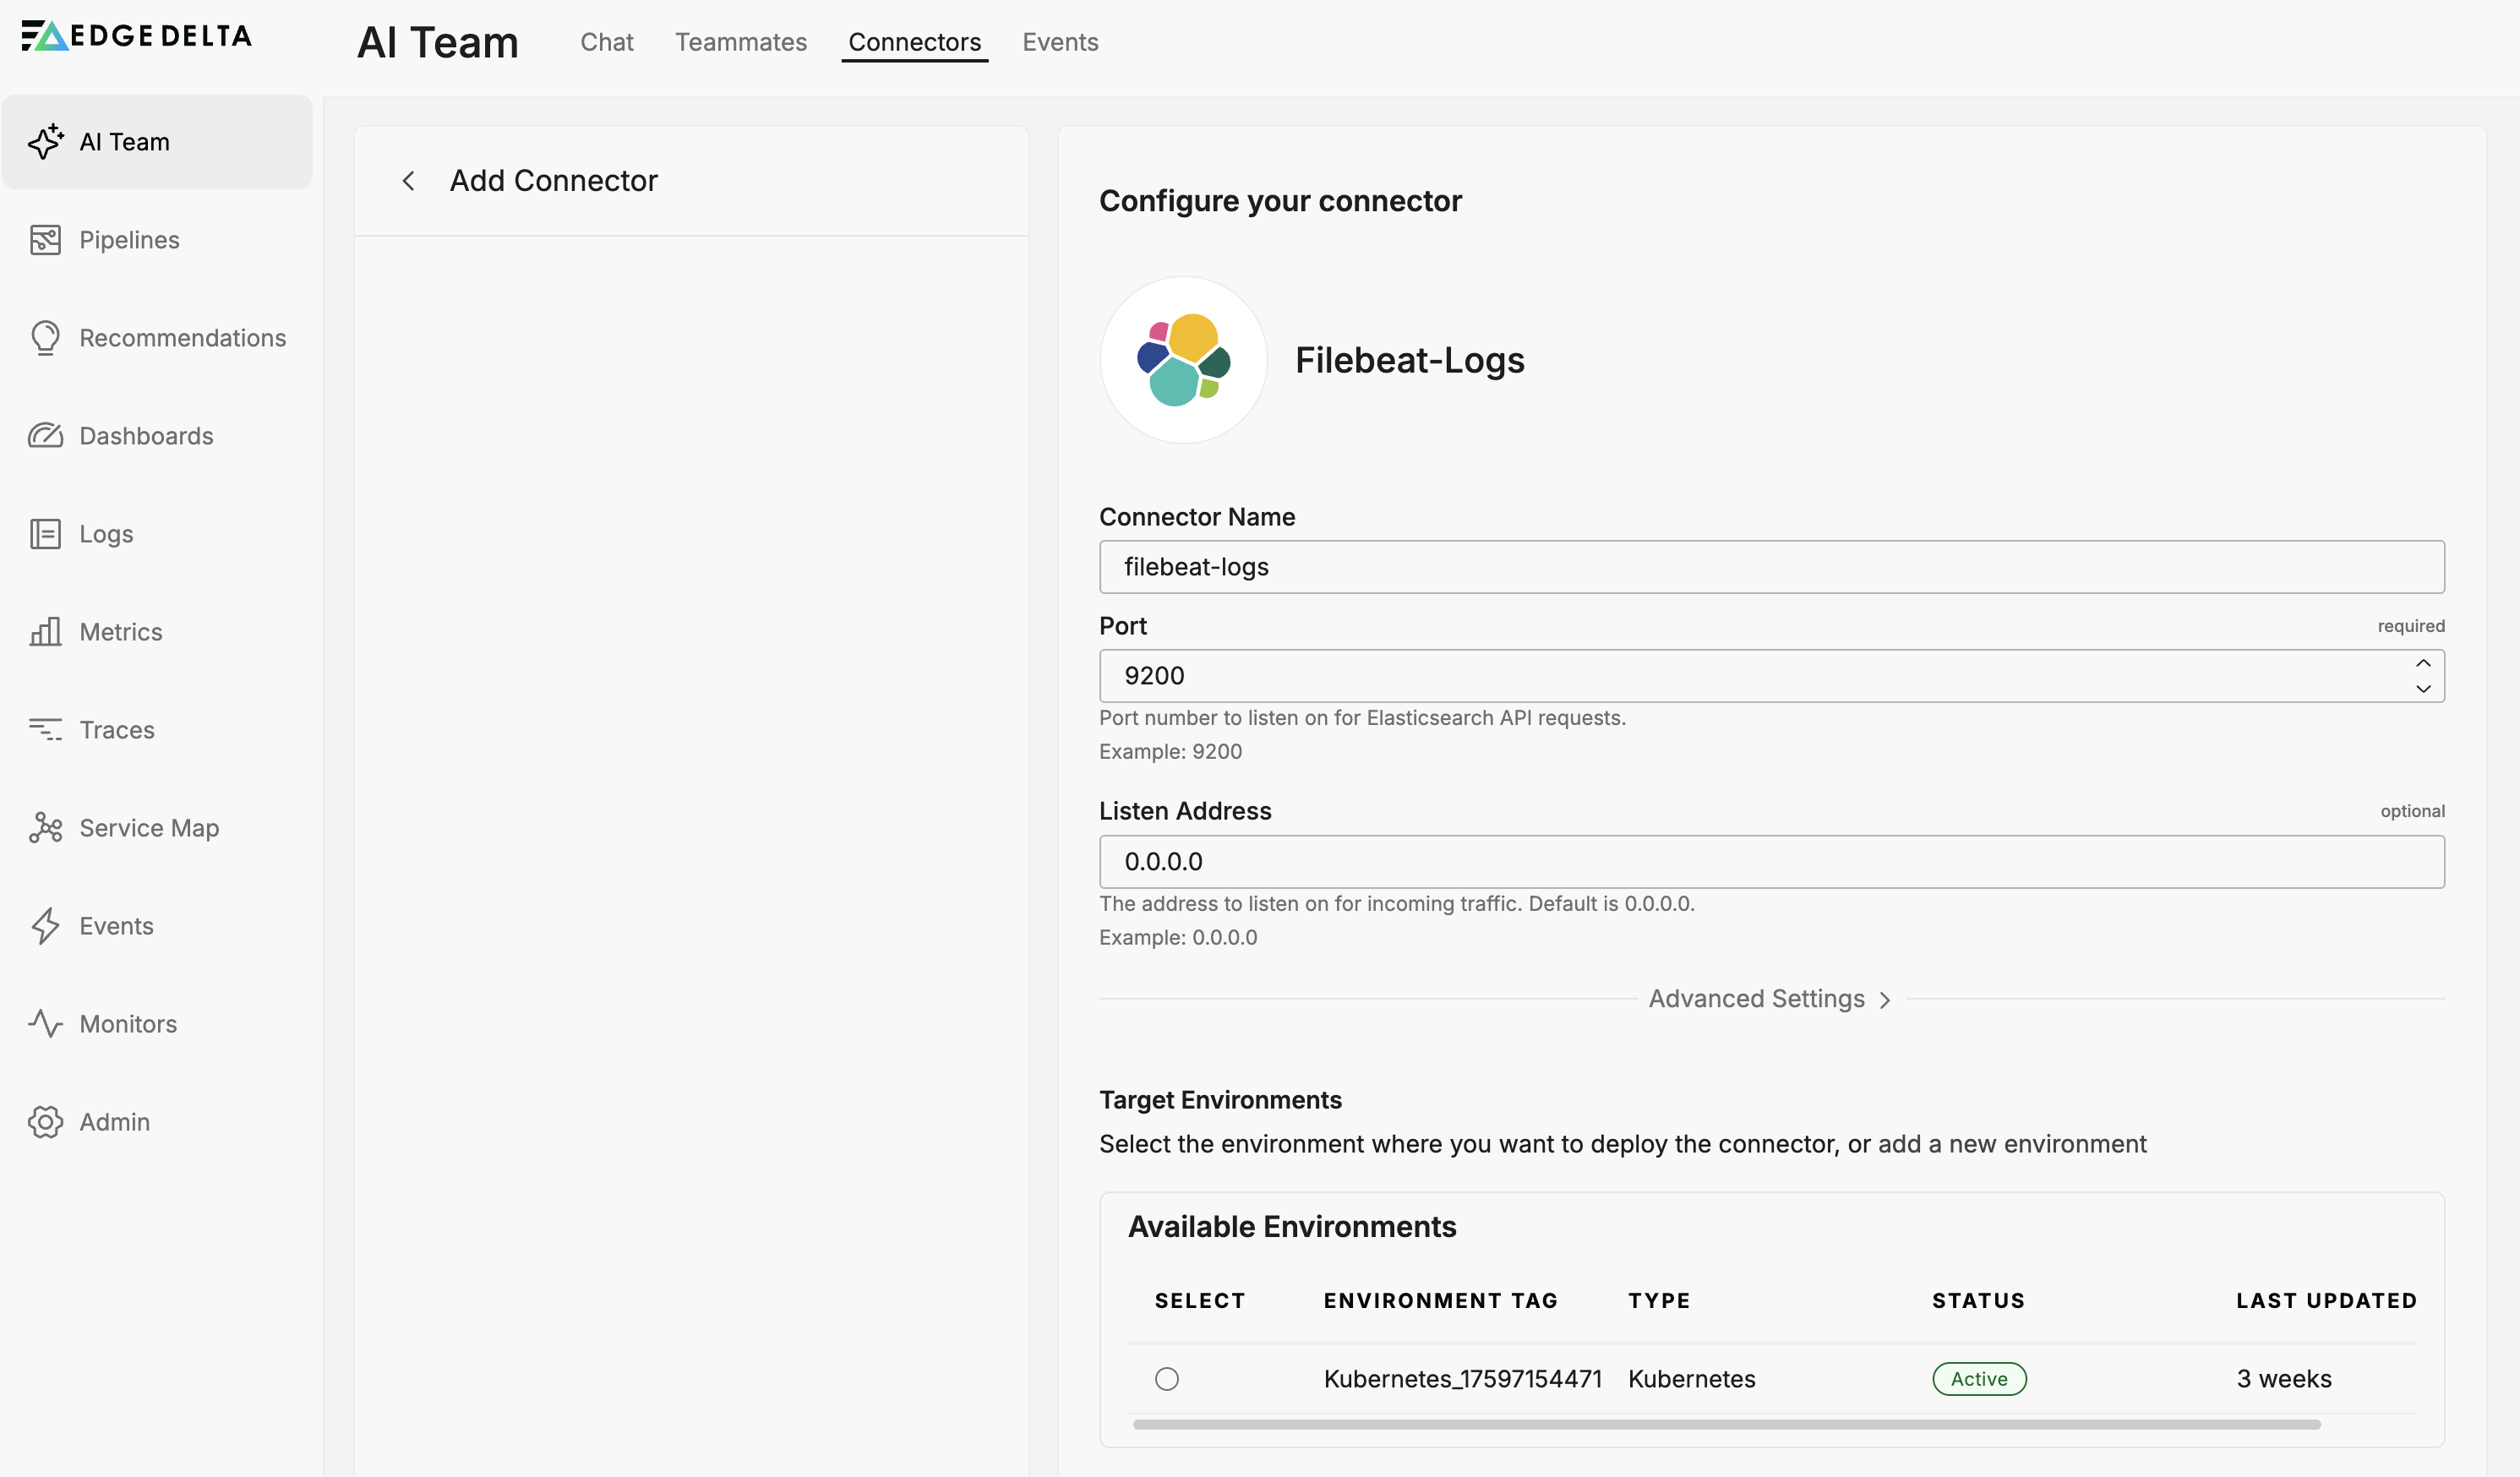
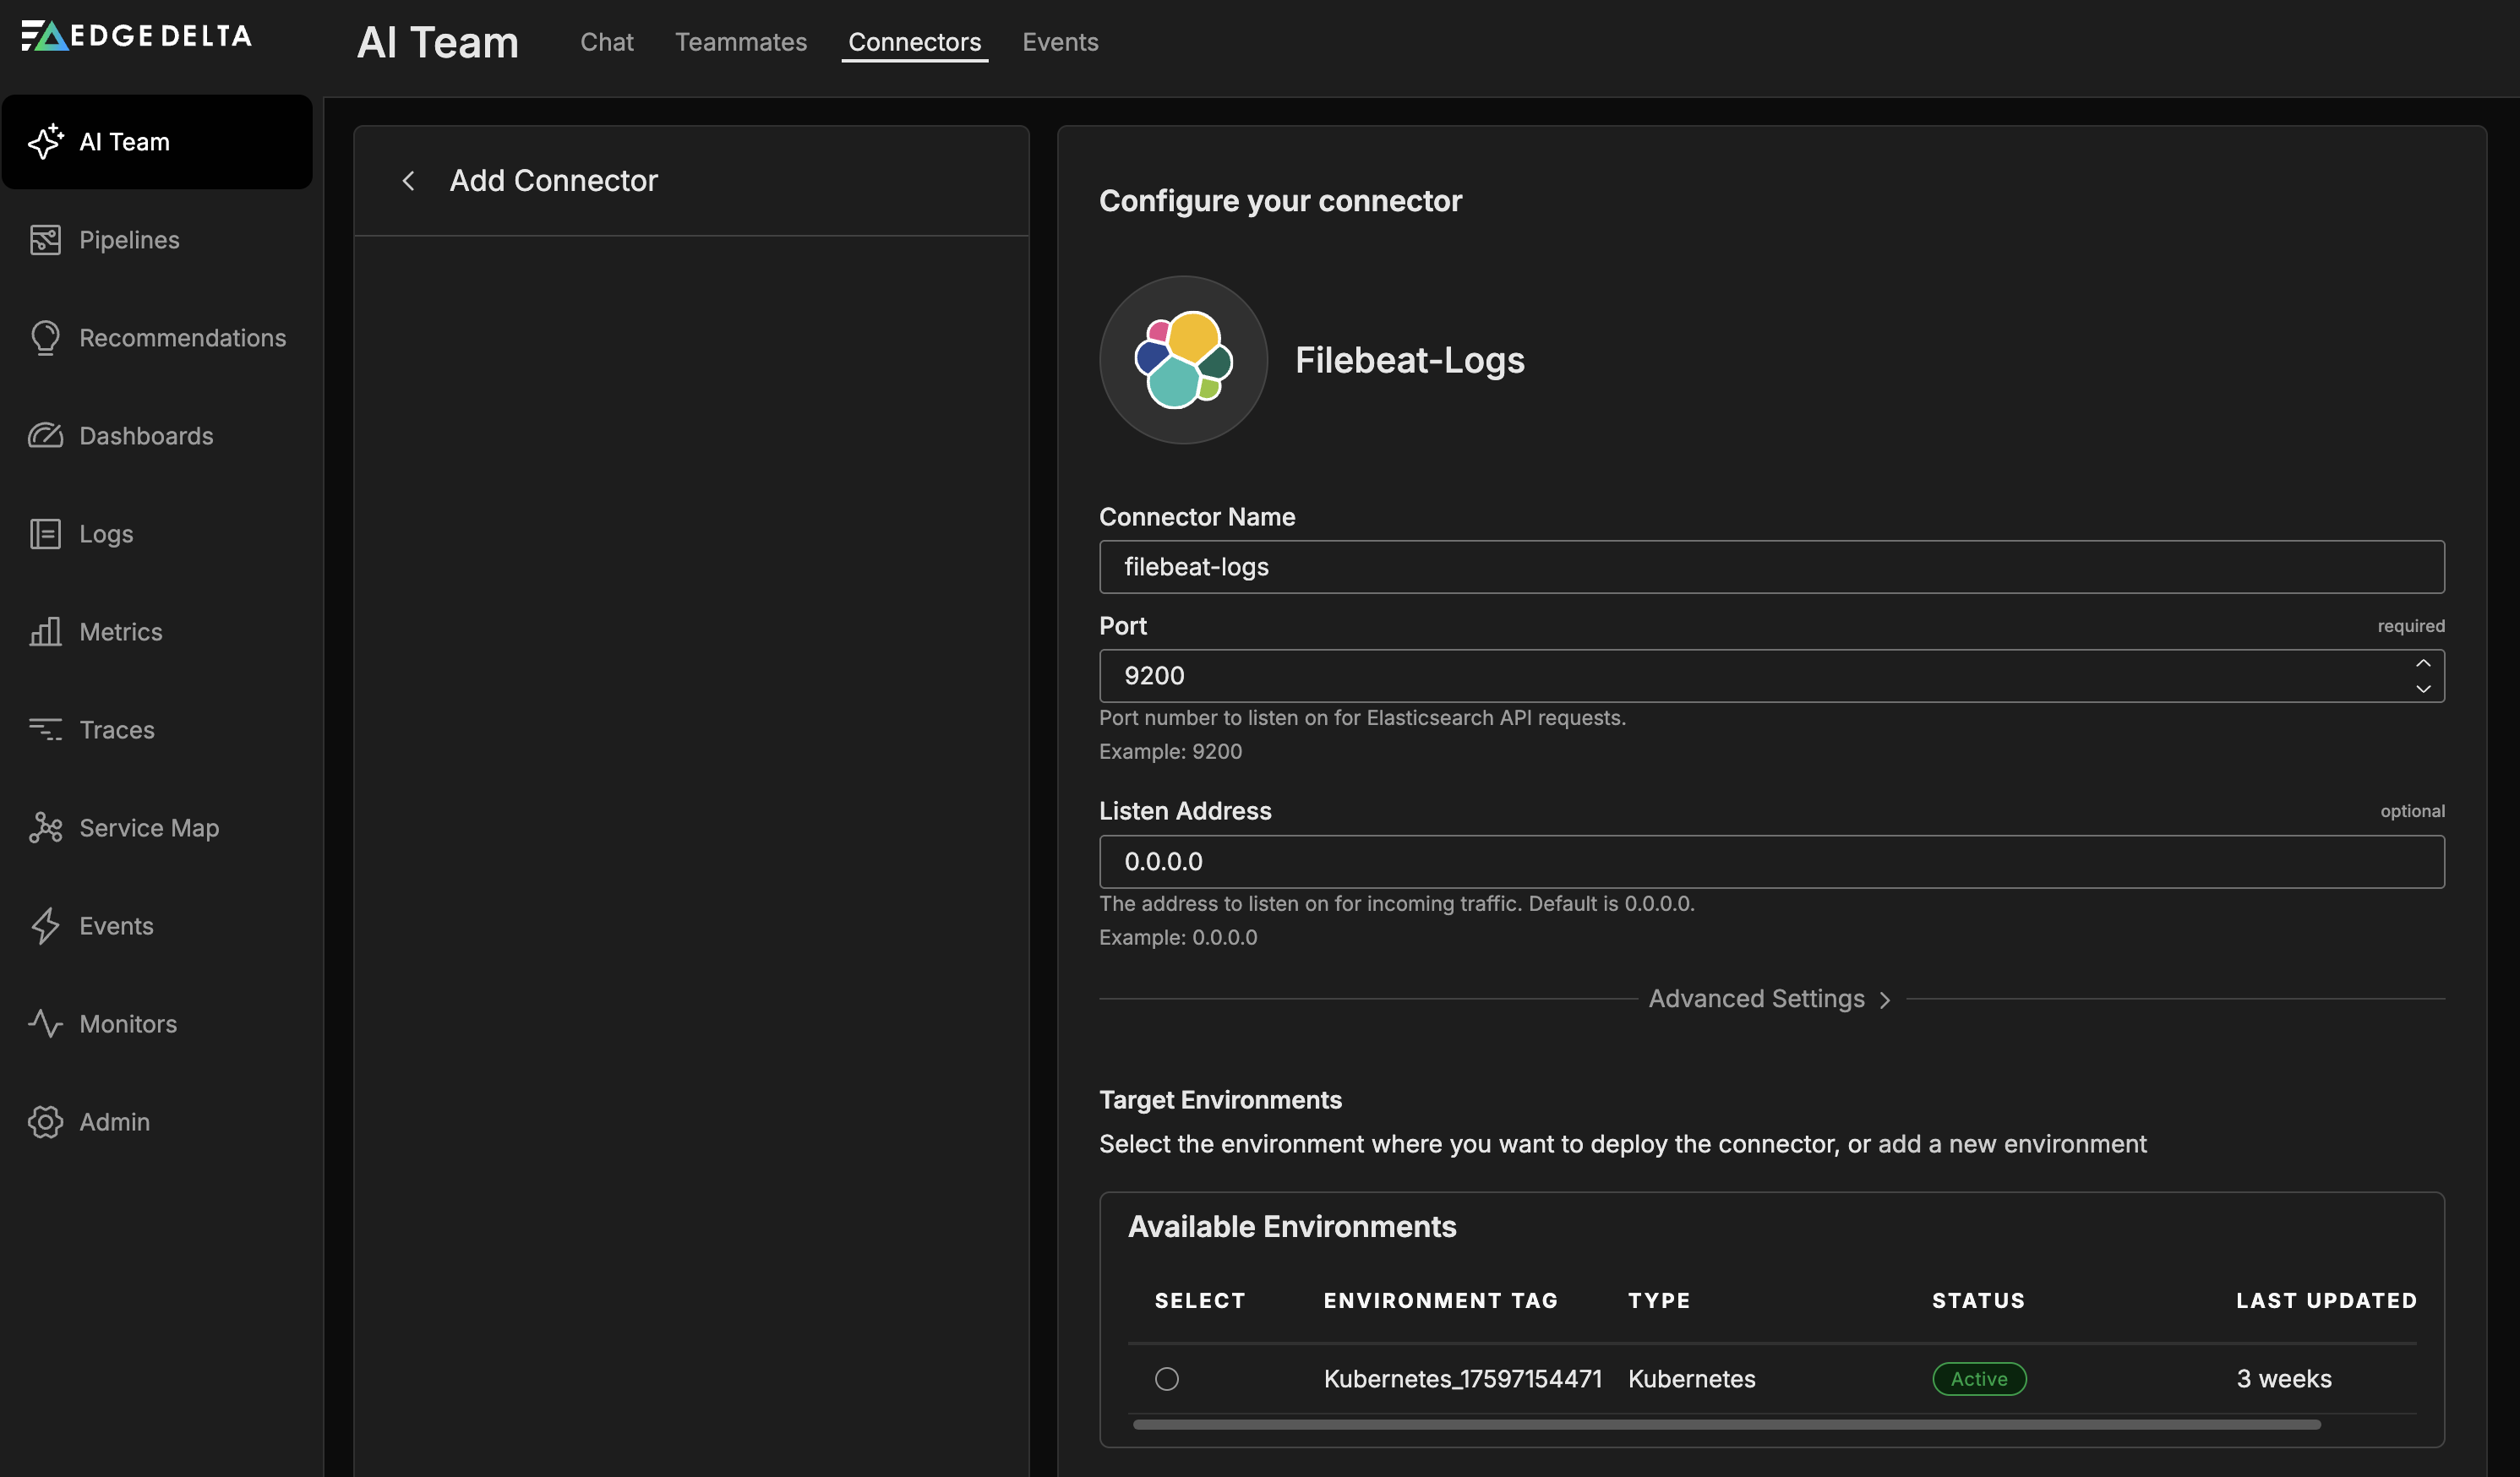
- Optionally configure Advanced Settings for authentication, TLS, health checks, and rate limiting
- Select a target environment
- Click Save
The connector deploys and begins listening for Elasticsearch Bulk API requests.
Configuration Options
Connector Name
Name to identify this Filebeat connector instance.
Listen
IP address to bind to for listening.
Format: IPv4 address
Default: 0.0.0.0 (all interfaces)
Examples:
0.0.0.0- Listen on all network interfaces192.168.1.100- Listen only on specific interface127.0.0.1- Localhost only (for testing)
Port
TCP port to listen on for incoming Elasticsearch Bulk API traffic.
Format: Integer between 1 and 65535
Default: 9200
Examples:
9200- Elasticsearch standard port (default for most Elastic clients)9201- Alternative Elasticsearch port8080- Custom HTTP port
Note: Port 9200 provides maximum compatibility with Elastic ecosystem tools that use this as their default. Ensure firewall rules allow inbound traffic on chosen port.
Advanced Settings
Endpoint
Elasticsearch Bulk API endpoint path that clients will connect to.
Format: URL path starting with /
Default: /_bulk
Examples:
/_bulk- Standard Elasticsearch bulk endpoint/edgedelta/_bulk- Custom endpoint path
When to customize: Change this if you need to use a non-standard path or want to distinguish Edge Delta from actual Elasticsearch endpoints.
Show Originating IP
Include the client’s IP address in ingested data as metadata.
Format: Boolean (true/false)
Default: false
Use Case: Enable for security analysis, tracking data sources, or identifying client locations. The originating IP is captured as a resource attribute.
Capture Request Headers
Capture and include HTTP request headers in the ingested data.
Format: Boolean (true/false)
Default: false
Use Case: Enable to preserve HTTP headers for debugging, correlation, or extracting custom metadata sent by clients. Headers become part of the data item metadata.
Enable Health Check
Enable the Elasticsearch health check endpoint at /_cluster/health.
Format: Boolean (true/false)
Default: true
Use Case: This endpoint allows monitoring tools and Elastic clients to verify connectivity and API compatibility. Disable only if you need to prevent health check probes or want to minimize exposed endpoints.
Health check response format:
{
  "cluster_name": "edge-delta-cluster",
  "status": "green",
  "version": {
    "number": "8.3.2"
  }
}
Active Request Limit
Maximum number of concurrent requests to handle simultaneously.
Format: Integer
Default: 256
Examples:
128- Lower limit for resource-constrained environments256- Default for typical workloads512- Higher limit for high-throughput scenarios
Purpose: Prevents resource exhaustion by limiting concurrent connections. Requests exceeding this limit are queued or rejected with HTTP 503 (Service Unavailable).
API Version
Elasticsearch API version to emulate and report in health check responses.
Format: Semantic version string
Default: 8.3.2
Examples:
7.17.0- For compatibility with Elasticsearch 7.x clients8.3.2- Modern Elasticsearch 8.x version (default)8.11.0- Latest Elasticsearch 8.x version
When to customize: Set this to match the Elasticsearch version your clients expect if they perform version compatibility checks.
Custom API Version Response
Custom JSON response for the Elasticsearch API version endpoint (root / endpoint).
Format: JSON object
Use Case: Provide a fully custom response for clients that query the root endpoint to check Elasticsearch version and cluster information.
Example:
{
  "name": "edge-delta-node",
  "cluster_name": "production-cluster",
  "cluster_uuid": "abc123",
  "version": {
    "number": "8.3.2",
    "build_flavor": "default",
    "build_type": "docker"
  },
  "tagline": "You Know, for Search"
}
Authentication
HTTP authentication settings for securing the endpoint.
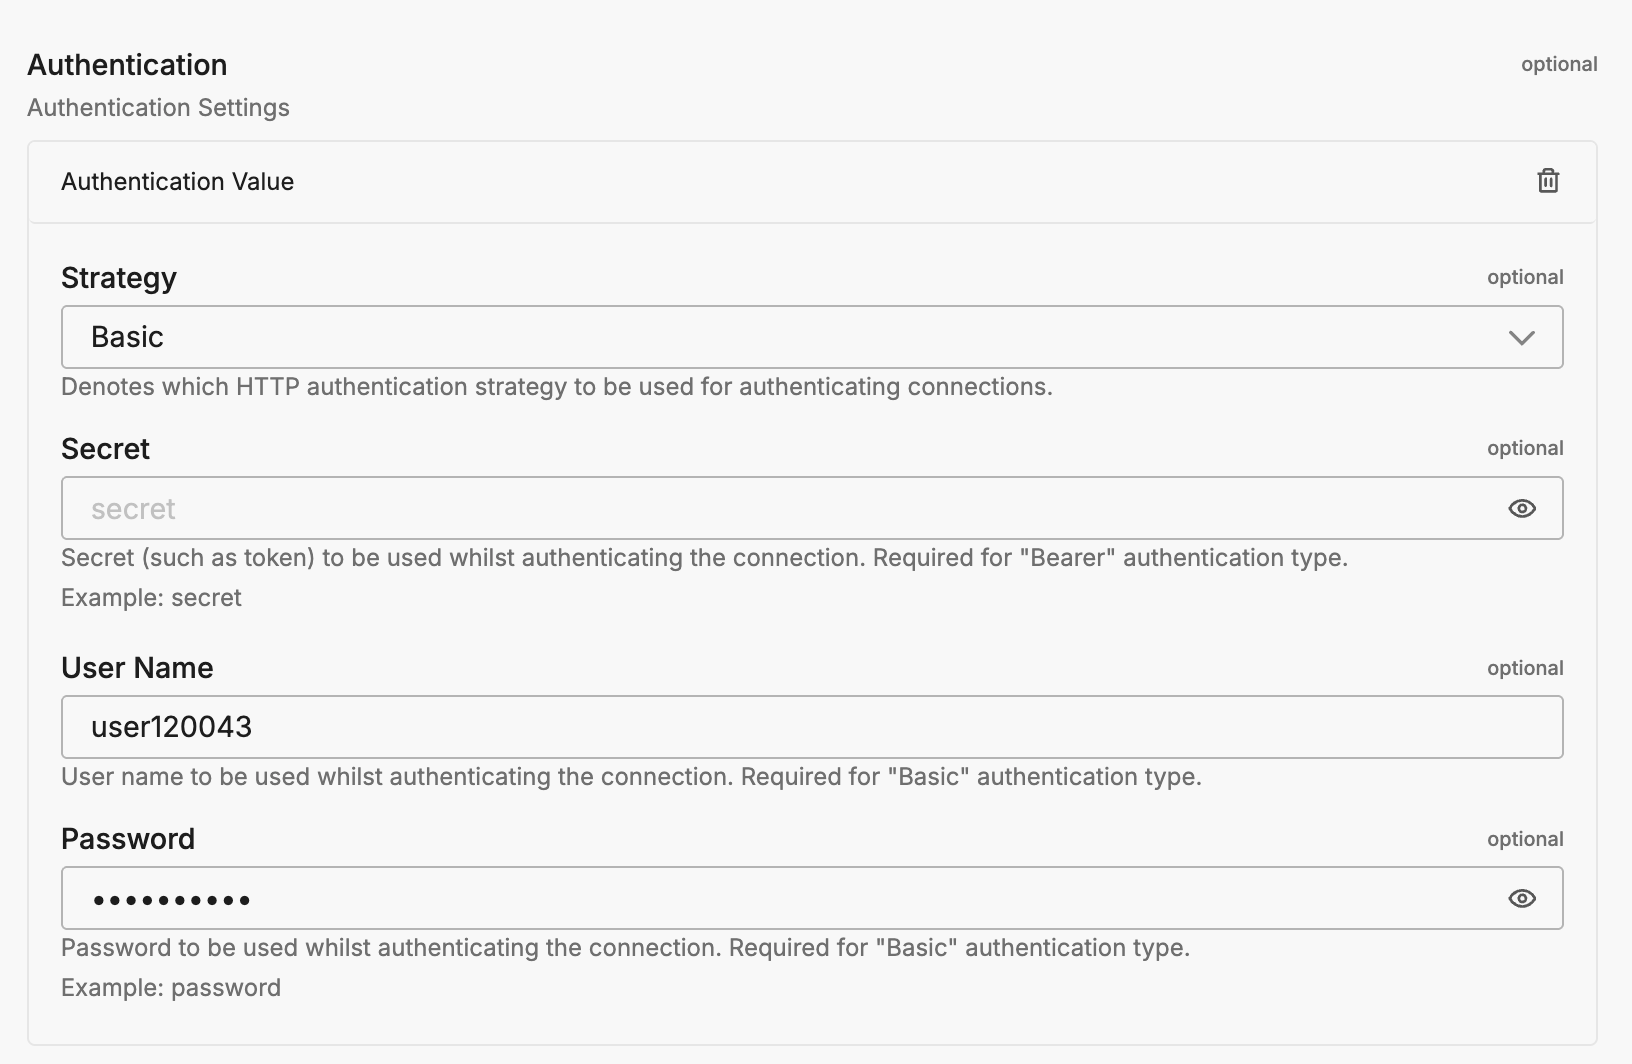
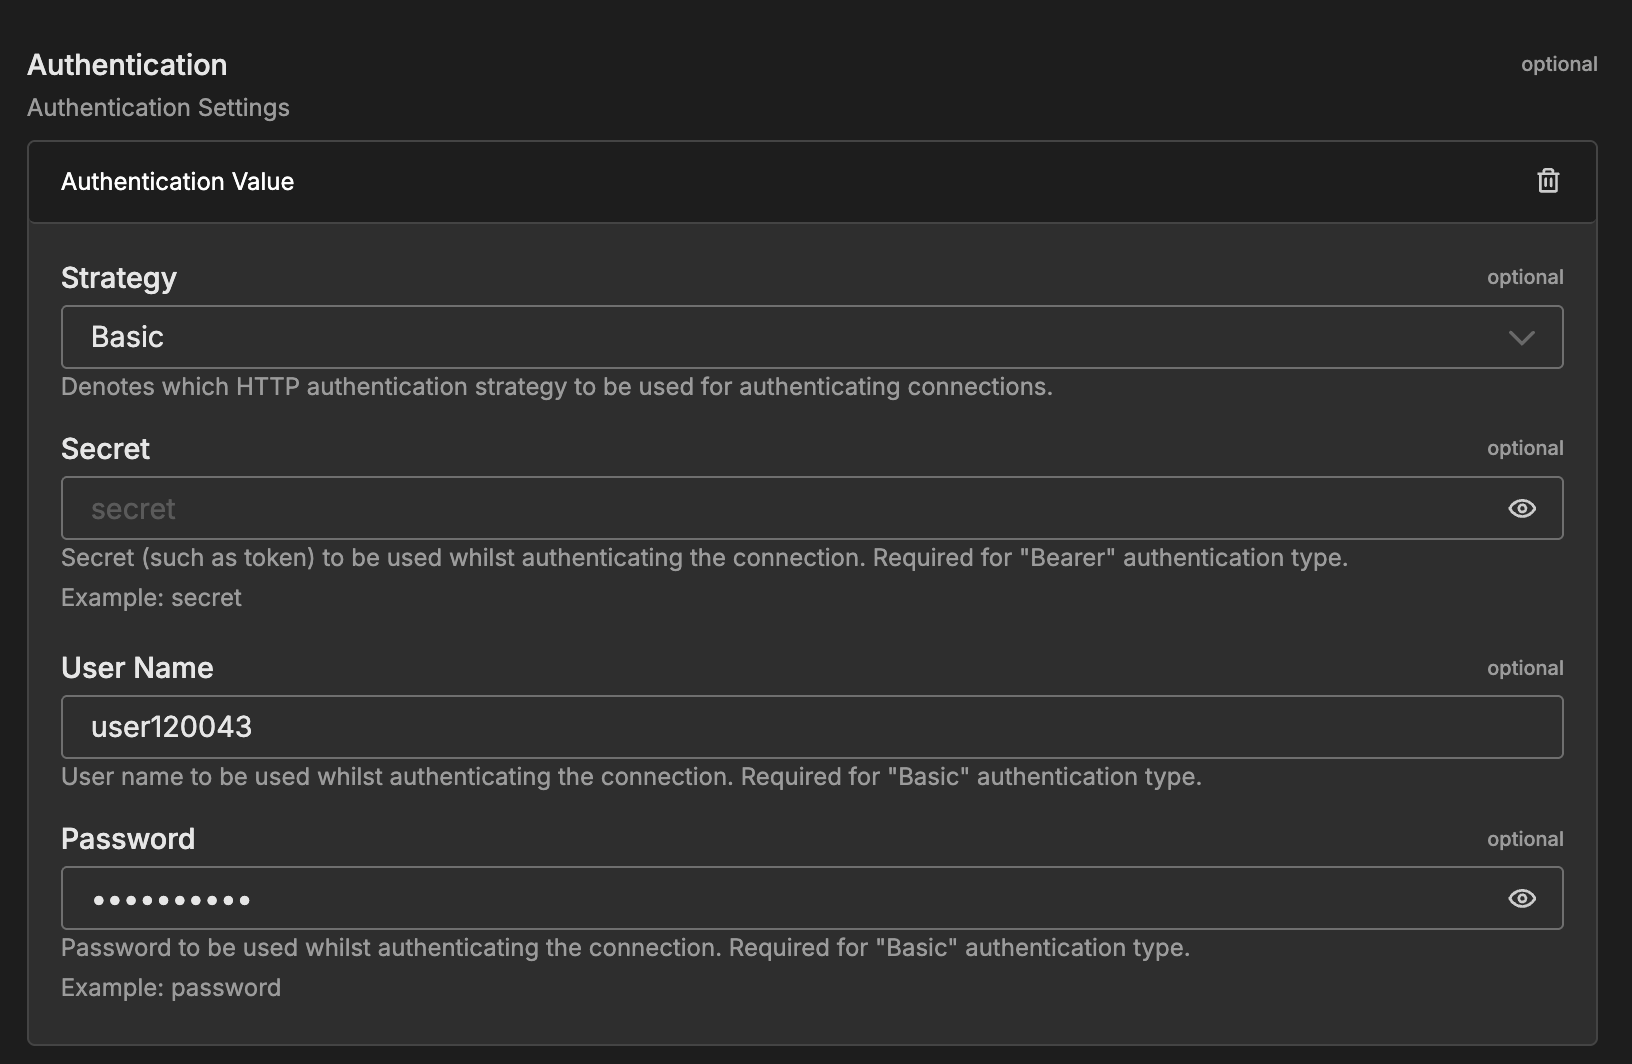
Configuration Options:
- Strategy: Authentication method (
BasicorBearer) - Username: Username for Basic authentication
- Password: Password for Basic authentication
- Secret: Bearer token for Bearer authentication
Authentication Types:
Basic Authentication: Username and password authentication compatible with Elasticsearch’s native authentication.
Example configuration:
- Strategy:
Basic - Username:
elastic - Password:
changeme
Client configuration (Filebeat):
output.elasticsearch:
  hosts: ["http://localhost:9200"]
  username: "elastic"
  password: "changeme"
Bearer Authentication: Token-based authentication using the Authorization header.
Example configuration:
- Strategy:
Bearer - Secret:
my-secret-token-12345
Client configuration (curl):
curl -H "Authorization: Bearer my-secret-token-12345" \
  http://localhost:9200/_bulk
When to Use: Enable authentication in production environments to prevent unauthorized access to your data ingestion endpoint.
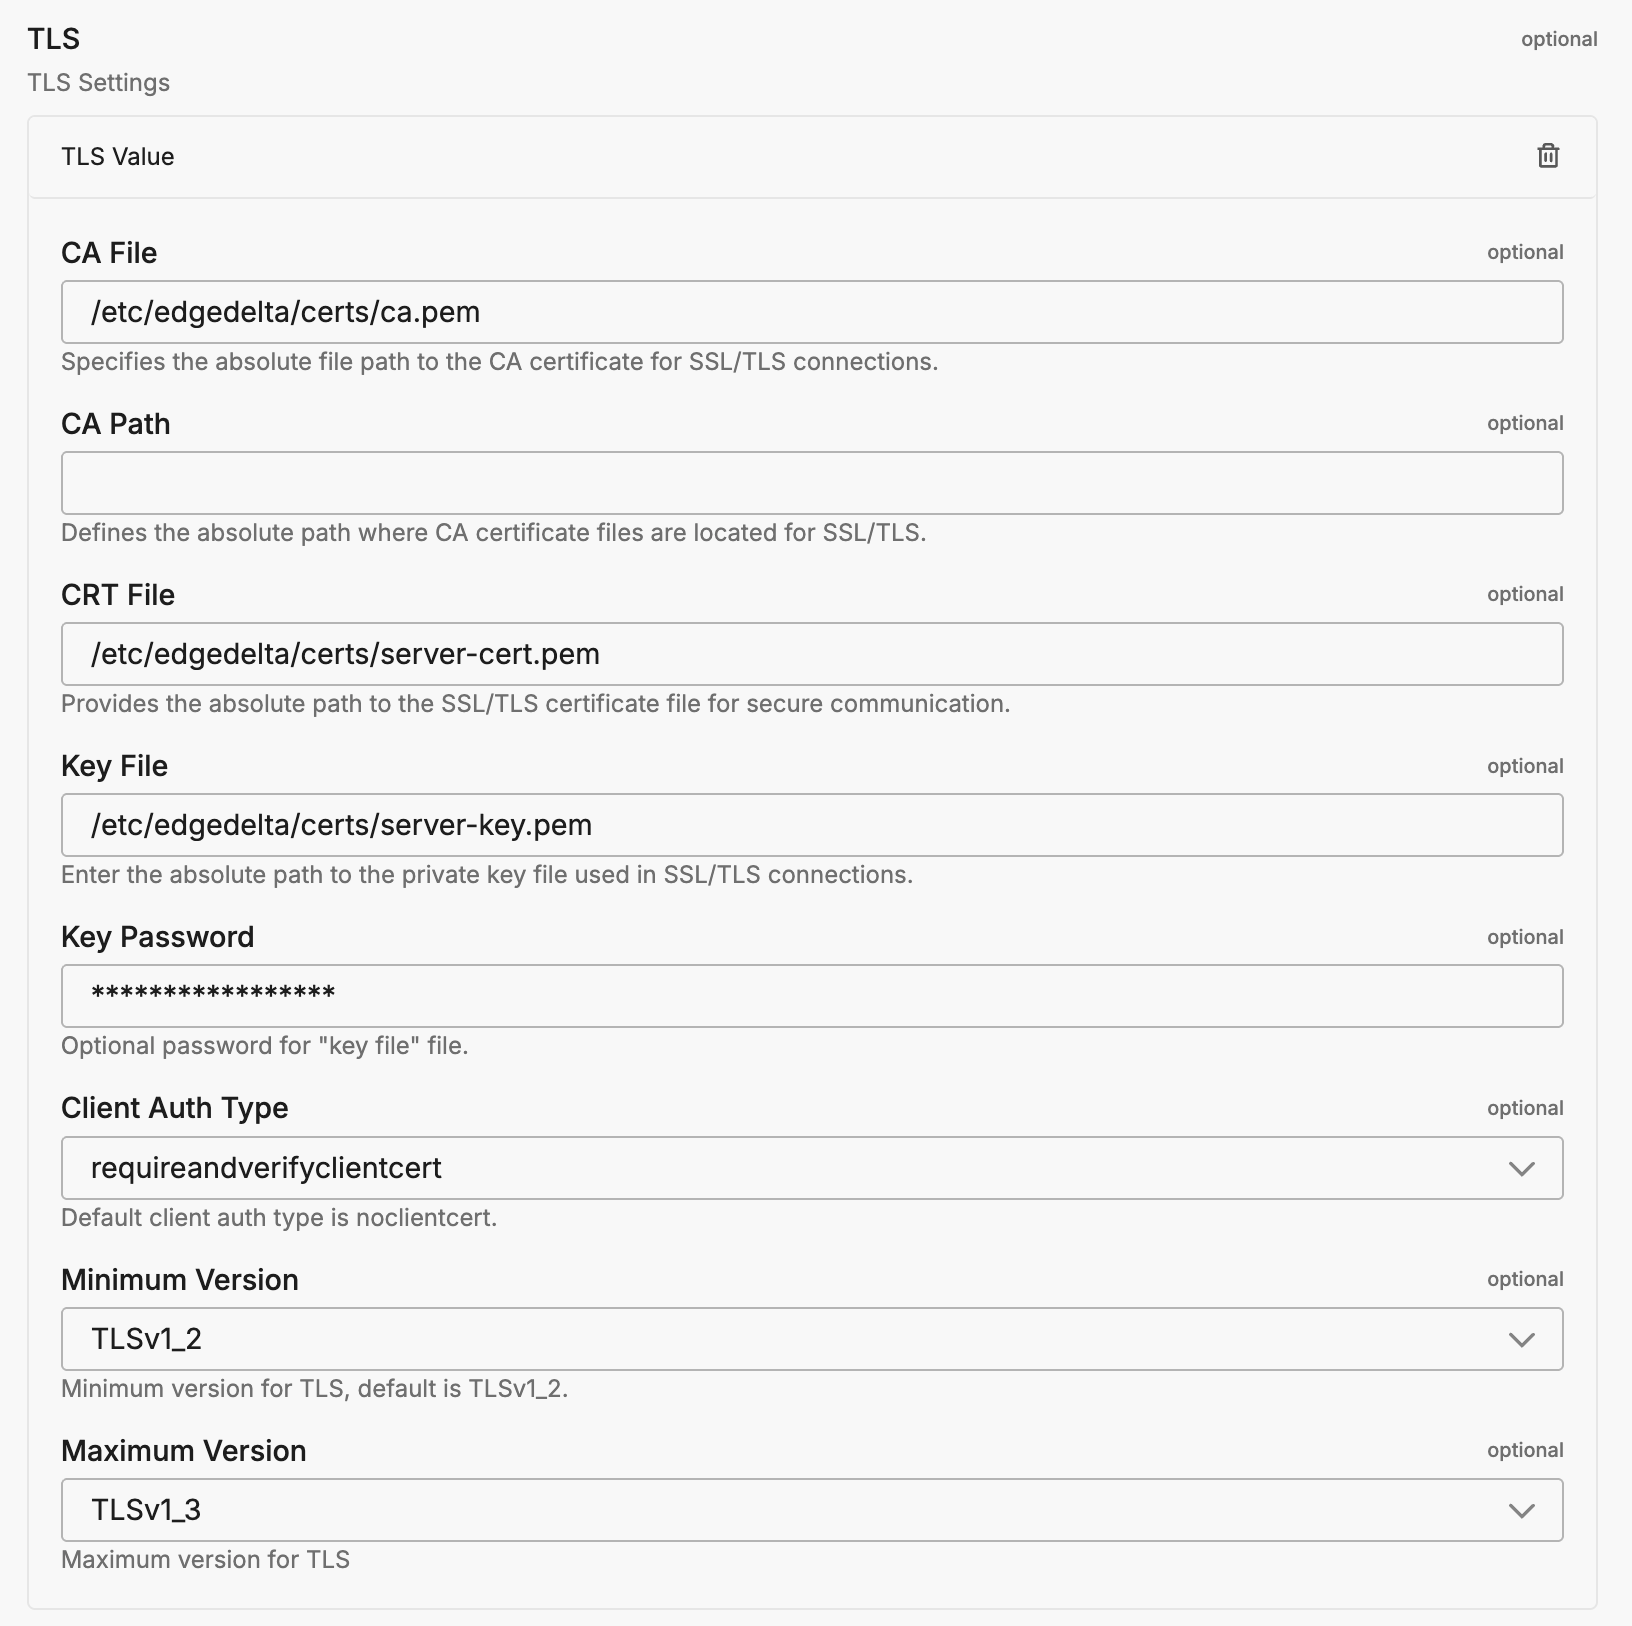
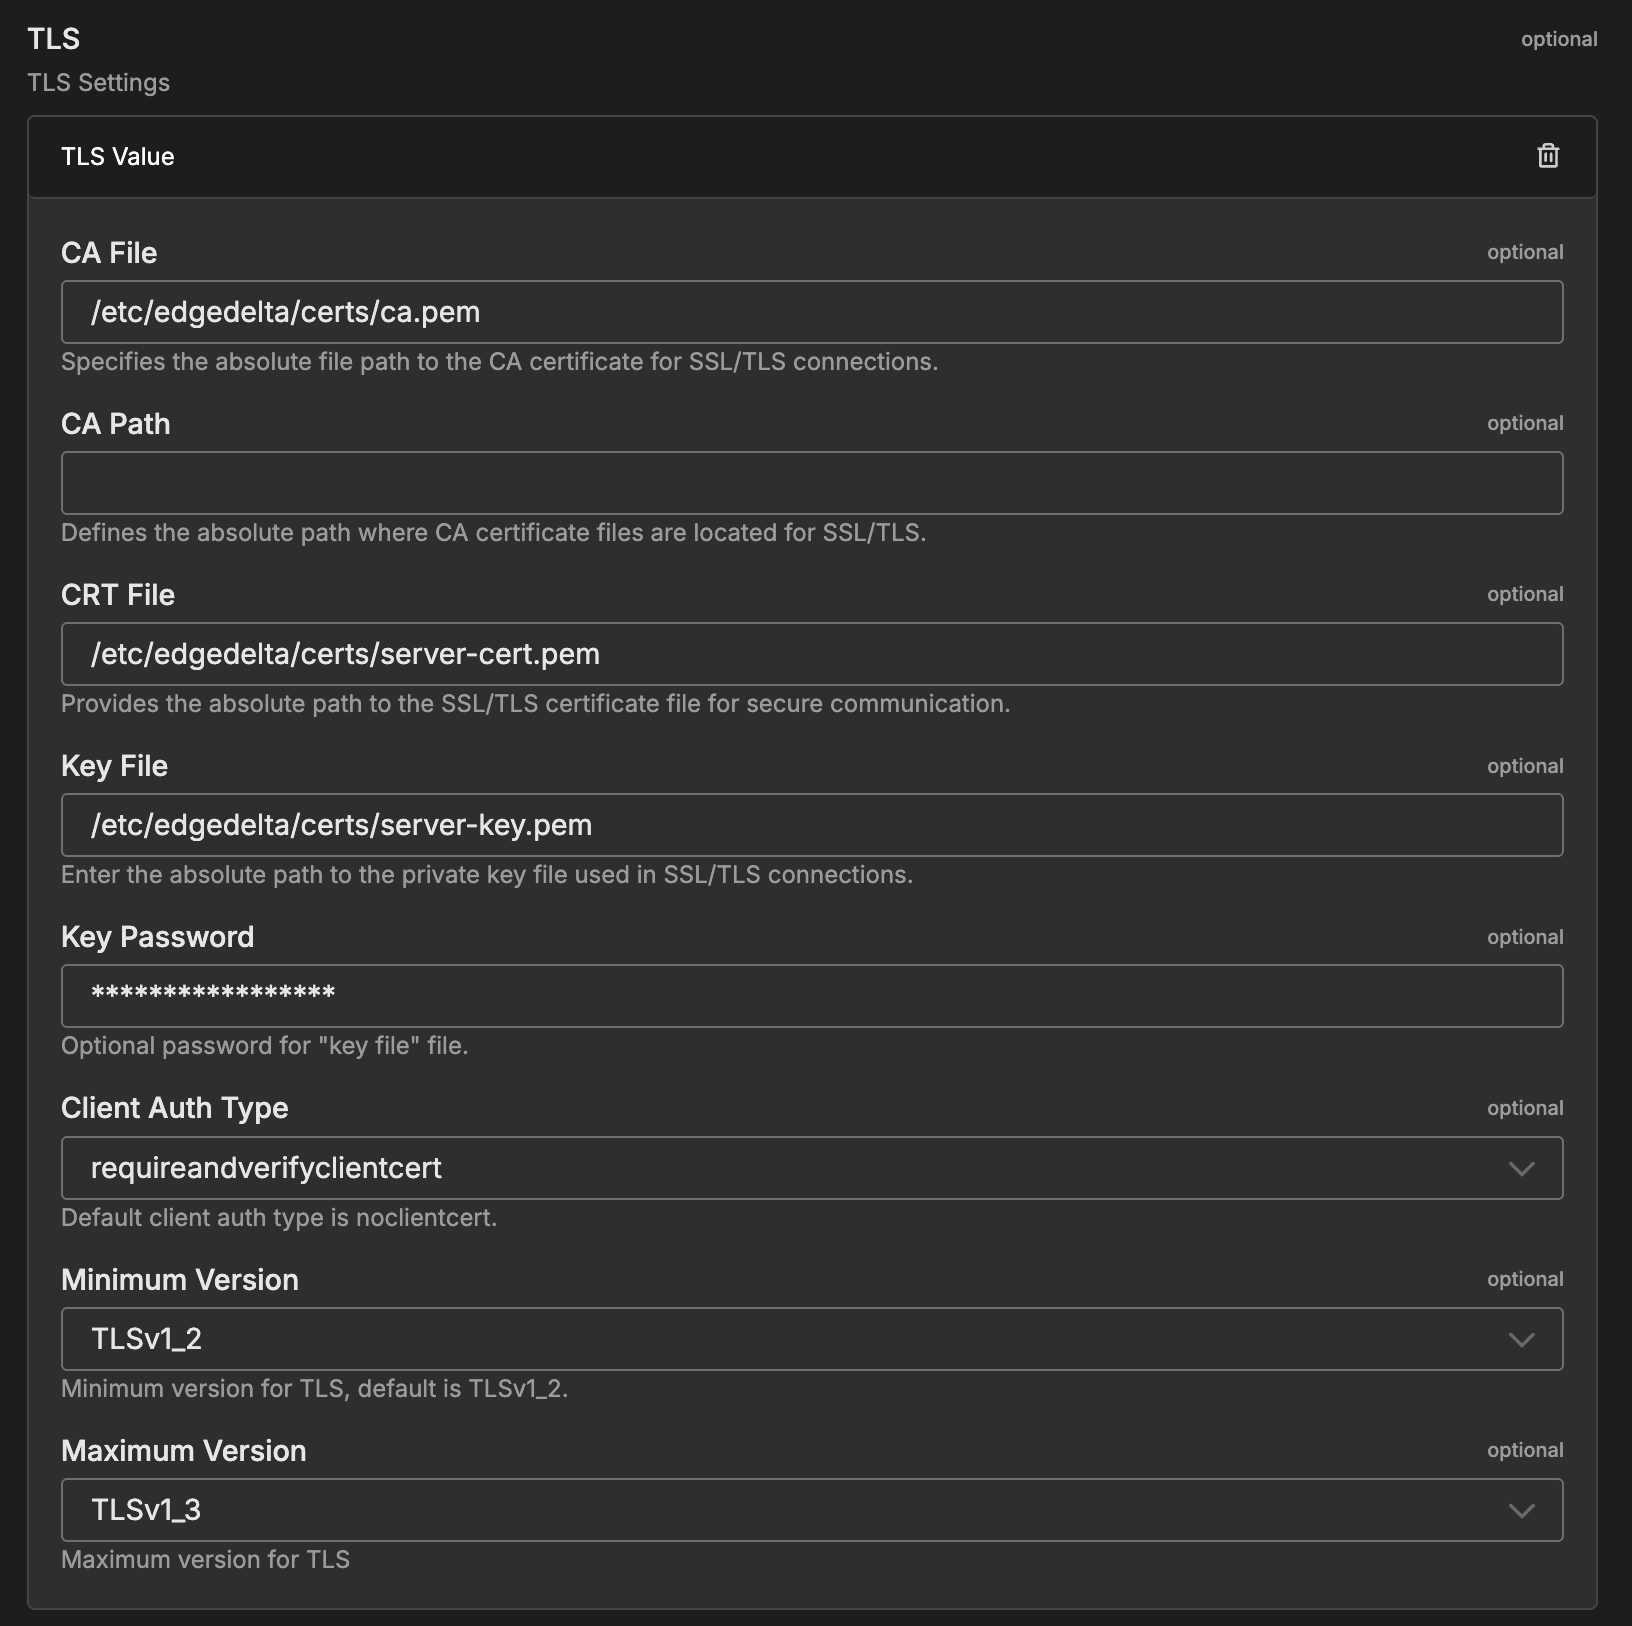
TLS
Configure TLS settings for secure connections to this source. TLS is optional and typically used when the source node needs to accept encrypted connections or perform mutual TLS authentication with clients.
YAML Configuration Example:
nodes:
  - name: <node name>
    type: <source type>
    tls:
      <tls options>
CA Certificate File
Specifies the absolute path to a single CA (Certificate Authority) certificate file used to verify client certificates during mutual TLS authentication. This file contains the trusted CA certificate that signed the client certificates. Use this when you have a single CA certificate. (YAML parameter: ca_file)
When to use: Required when client_auth_type is set to verifyclientcertifgiven or requireandverifyclientcert. Choose either ca_file or ca_path, not both.
YAML Configuration Example:
nodes:
  - name: <node name>
    type: <source type>
    tls:
      ca_file: /certs/ca.pem
      client_auth_type: requireandverifyclientcert
CA Certificate Path
Specifies a directory path containing one or more CA certificate files for client certificate verification. Use this when you need to trust multiple CAs or when managing CA certificates across multiple files. All certificate files in the directory will be loaded. (YAML parameter: ca_path)
When to use: Alternative to ca_file when you have multiple CA certificates. Required when client_auth_type is set to verifyclientcertifgiven or requireandverifyclientcert. Choose either ca_file or ca_path, not both.
YAML Configuration Example:
nodes:
  - name: <node name>
    type: <source type>
    tls:
      ca_path: /certs/ca-certificates/
      client_auth_type: requireandverifyclientcert
Certificate File
Path to the server certificate file (public key) that will be presented to connecting clients during the TLS handshake. This certificate identifies the server and must match the private key. The certificate should be in PEM format and can include the full certificate chain. (YAML parameter: crt_file)
When to use: Required for TLS/HTTPS connections. Must be used together with key_file. Obtain this from your certificate authority or generate a self-signed certificate for testing.
YAML Configuration Example:
nodes:
  - name: <node name>
    type: <source type>
    tls:
      crt_file: /certs/server-cert.pem
      key_file: /certs/server-key.pem
Private Key File
Path to the private key file corresponding to the server certificate. This key must match the public key in the certificate file and is used to decrypt communications encrypted with the public key. Keep this file secure and restrict access permissions. (YAML parameter: key_file)
When to use: Required for TLS/HTTPS connections. Must be used together with crt_file. If the key file is encrypted, also specify key_password.
YAML Configuration Example:
nodes:
  - name: <node name>
    type: <source type>
    tls:
      crt_file: /certs/server-cert.pem
      key_file: /certs/server-key.pem
      key_password: <password>  # Only if key is encrypted
Private Key Password
Password (passphrase) used to decrypt an encrypted private key file. Only needed if your private key file is password-protected. If your key file is unencrypted, omit this parameter. (YAML parameter: key_password)
When to use: Optional. Only required if key_file is encrypted/password-protected. For enhanced security, use encrypted keys in production environments.
YAML Configuration Example:
nodes:
  - name: <node name>
    type: <source type>
    tls:
      crt_file: /certs/server-cert.pem
      key_file: /certs/encrypted-server-key.pem
      key_password: mySecurePassword123
Client Authentication Type
Controls how client certificates are requested and validated during the TLS handshake. This setting is specific to server-side TLS and determines the mutual TLS (mTLS) behavior. Use this to enforce certificate-based authentication from connecting clients for enhanced security. (YAML parameter: client_auth_type)
Valid options:
noclientcert- No client certificate is requested; any sent certificates are ignored. Use for standard TLS encryption without client authentication.requestclientcert- Client certificate is requested but not required. Useful for optional client authentication where you want to accept both authenticated and unauthenticated clients.requireanyclientcert- Client must send a certificate, but it is not validated against a CA. Use when you need proof a client has a certificate but don’t need to verify its authenticity.verifyclientcertifgiven- Certificate is requested but not required; if sent, it must be valid and signed by a trusted CA. Balances security with flexibility for mixed client environments.requireandverifyclientcert- Client must send a valid certificate signed by a trusted CA (full mutual TLS). Use for maximum security when all clients can be provisioned with certificates.
Default: noclientcert
When to use: Set to verifyclientcertifgiven or requireandverifyclientcert for secure environments where you need to verify client identity. When using certificate verification options, you must also configure ca_file or ca_path to specify the trusted CA certificates.
YAML Configuration Example:
nodes:
  - name: <node name>
    type: <source type>
    tls:
      client_auth_type: requireandverifyclientcert
      ca_file: /certs/ca.pem  # Required for certificate validation
Minimum TLS Version
Minimum TLS protocol version that will be accepted from connecting clients. This enforces a baseline security level by rejecting connections from clients using older, less secure TLS versions. (YAML parameter: min_version)
Available versions:
TLSv1_0- Deprecated, not recommended (security vulnerabilities)TLSv1_1- Deprecated, not recommended (security vulnerabilities)TLSv1_2- Recommended minimum for production (default)TLSv1_3- Most secure, use when all clients support it
Default: TLSv1_2
When to use: Set to TLSv1_2 or higher for production deployments. Only use TLSv1_0 or TLSv1_1 if you must support legacy clients that cannot upgrade, and be aware of the security risks. TLS 1.0 and 1.1 are officially deprecated and should be avoided.
YAML Configuration Example:
nodes:
  - name: <node name>
    type: <source type>
    tls:
      min_version: TLSv1_2
Maximum TLS Version
Maximum TLS protocol version that will be accepted from connecting clients. This is typically used to restrict newer TLS versions if compatibility issues arise with specific client implementations. (YAML parameter: max_version)
Available versions:
TLSv1_0TLSv1_1TLSv1_2TLSv1_3
When to use: Usually left unset to allow the most secure version available. Only set this if you encounter specific compatibility issues with TLS 1.3 clients, or for testing purposes. In most cases, you should allow the latest TLS version.
YAML Configuration Example:
nodes:
  - name: <node name>
    type: <source type>
    tls:
      max_version: TLSv1_3
When to Use: Enable for production environments with sensitive data. Configure TLS in both the connector and your Elastic clients.
Client configuration (Filebeat with TLS):
output.elasticsearch:
  hosts: ["https://localhost:9200"]
  ssl.certificate_authorities: ["/etc/pki/root/ca.pem"]
  ssl.certificate: "/etc/pki/client/cert.pem"
  ssl.key: "/etc/pki/client/cert.key"
Metadata Level (Resource Attributes)
This option is used to define which detected resources and attributes to add to each data item as it is ingested by Edge Delta. You can select:
- Required Only: This option includes the minimum required resources and attributes for Edge Delta to operate.
- Default: This option includes the required resources and attributes plus those selected by Edge Delta
- High: This option includes the required resources and attributes along with a larger selection of common optional fields.
- Custom: With this option selected, you can choose which attributes and resources to include. The required fields are selected by default and can’t be unchecked.
Based on your selection in the GUI, the source_metadata YAML is populated as two dictionaries (resource_attributes and attributes) with Boolean values.
See Choose Data Item Metadata for more information on selecting metadata.
Elasticsearch API-specific metadata included:
- Host name - Edge Delta agent hostname
- Host IP - Edge Delta agent IP address
- Server port - Port connector is listening on
- Service name - Service identifier
- Source name - Connector instance name
- Source type - Filebeat connector type
- Client IP - Originating client IP (if
show_originating_ipenabled)
Elasticsearch metadata extracted from bulk payload:
- Index name (from
_indexfield) - Document ID (from
_idfield) - Document type (from
_typefield if present) - Timestamp fields
Metadata Level (Attributes)
Additional attribute-level metadata fields to include.
Default: ed.env.id
Rate Limit
The rate_limit parameter enables you to control data ingestion based on system resource usage. This advanced setting helps prevent source nodes from overwhelming the agent by automatically throttling or stopping data collection when CPU or memory thresholds are exceeded.
Use rate limiting to prevent runaway log collection from overwhelming the agent in high-volume sources, protect agent stability in resource-constrained environments with limited CPU/memory, automatically throttle during bursty traffic patterns, and ensure fair resource allocation across source nodes in multi-tenant deployments.
When rate limiting triggers, pull-based sources (File, S3, HTTP Pull) stop fetching new data, push-based sources (HTTP, TCP, UDP, OTLP) reject incoming data, and stream-based sources (Kafka, Pub/Sub) pause consumption. Rate limiting operates at the source node level, where each source with rate limiting enabled independently monitors and enforces its own thresholds.
Rate limiting vs backpressure: Rate limiting and backpressure are different mechanisms. Rate limiting controls data ingestion at the source based on CPU or memory thresholds. Backpressure controls data output at the destination when in-memory queues fill up. Backpressure logs such as
backpressure: dataCh at 92% capacitydo not appear when rate limiting triggers, and rate limiting logs do not appear during backpressure events.
Observability: When rate limiting is active in enforce mode, the agent does not produce INFO, WARN, or ERROR level logs. To confirm that rate limiting is triggering, check the source node’s Bytes I/O metrics in the Edge Delta app for gaps or drops that coincide with expected throttling periods.
Configuration Steps:
- Click Add New in the Rate Limit section
- Click Add New for Evaluation Policy
- Select Policy Type:
- CPU Usage: Monitors CPU consumption and rate limits when usage exceeds defined thresholds. Use for CPU-intensive sources like file parsing or complex transformations.
- Memory Usage: Monitors memory consumption and rate limits when usage exceeds defined thresholds. Use for memory-intensive sources like large message buffers or caching.
- AND (composite): Combines multiple sub-policies with AND logic. All sub-policies must be true simultaneously to trigger rate limiting. Use when you want conservative rate limiting (both CPU and memory must be high).
- OR (composite): Combines multiple sub-policies with OR logic. Any sub-policy can trigger rate limiting. Use when you want aggressive rate limiting (either CPU or memory being high triggers).
- Select Evaluation Mode. Choose how the policy behaves when thresholds are exceeded:
- Enforce (default): Actively applies rate limiting when thresholds are met. Pull-based sources (File, S3, HTTP Pull) stop fetching new data, push-based sources (HTTP, TCP, UDP, OTLP) reject incoming data, and stream-based sources (Kafka, Pub/Sub) pause consumption. Use in production to protect agent resources.
- Monitor: Logs when rate limiting would occur without actually limiting data flow. Use for testing thresholds before enforcing them in production.
- Passthrough: Disables rate limiting entirely while keeping the configuration in place. Use to temporarily disable rate limiting without removing configuration.
- Set Absolute Limits and Relative Limits (for CPU Usage and Memory Usage policies)
Note: If you specify both absolute and relative limits, the system evaluates both conditions and rate limiting triggers when either condition is met (OR logic). For example, if you set absolute limit to
1.0CPU cores and relative limit to50%, rate limiting triggers when the source uses either 1 full core OR 50% of available CPU, whichever happens first.
For CPU Absolute Limits: Enter value in full core units:
0.1= one-tenth of a CPU core0.5= half a CPU core1.0= one full CPU core2.0= two full CPU cores
For CPU Relative Limits: Enter percentage of total available CPU (0-100):
50= 50% of available CPU75= 75% of available CPU85= 85% of available CPU
For Memory Absolute Limits: Enter value in bytes
104857600= 100Mi (100 × 1024 × 1024)536870912= 512Mi (512 × 1024 × 1024)1073741824= 1Gi (1 × 1024 × 1024 × 1024)
For Memory Relative Limits: Enter percentage of total available memory (0-100)
60= 60% of available memory75= 75% of available memory80= 80% of available memory
- Set Refresh Interval (for CPU Usage and Memory Usage policies). Specify how frequently the system checks resource usage:
- Recommended Values:
10sto30sfor most use cases5sto10sfor high-volume sources requiring quick response1mor higher for stable, low-volume sources
The system fetches current CPU/memory usage at the specified refresh interval and uses that value for evaluation until the next refresh. Shorter intervals provide more responsive rate limiting but incur slightly higher overhead, while longer intervals are more efficient but slower to react to sudden resource spikes.
The GUI generates YAML as follows:
# Simple CPU-based rate limiting
nodes:
  - name: <node name>
    type: <node type>
    rate_limit:
      evaluation_policy:
        policy_type: cpu_usage
        evaluation_mode: enforce
        absolute_limit: 0.5  # Limit to half a CPU core
        refresh_interval: 10s
# Simple memory-based rate limiting
nodes:
  - name: <node name>
    type: <node type>
    rate_limit:
      evaluation_policy:
        policy_type: memory_usage
        evaluation_mode: enforce
        absolute_limit: 536870912  # 512Mi in bytes
        refresh_interval: 30s
Composite Policies (AND / OR)
When using AND or OR policy types, you define sub-policies instead of limits. Sub-policies must be siblings (at the same level)—do not nest sub-policies within other sub-policies. Each sub-policy is independently evaluated, and the parent policy’s evaluation mode applies to the composite result.
- AND Logic: All sub-policies must evaluate to true at the same time to trigger rate limiting. Use when you want conservative rate limiting (limit only when CPU AND memory are both high).
- OR Logic: Any sub-policy evaluating to true triggers rate limiting. Use when you want aggressive protection (limit when either CPU OR memory is high).
Configuration Steps:
- Select AND (composite) or OR (composite) as the Policy Type
- Choose the Evaluation Mode (typically Enforce)
- Click Add New under Sub-Policies to add the first condition
- Configure the first sub-policy by selecting policy type (CPU Usage or Memory Usage), selecting evaluation mode, setting absolute and/or relative limits, and setting refresh interval
- In the parent policy (not within the child), click Add New again to add a sibling sub-policy
- Configure additional sub-policies following the same pattern
The GUI generates YAML as follows:
# AND composite policy - both CPU AND memory must exceed limits
nodes:
  - name: <node name>
    type: <node type>
    rate_limit:
      evaluation_policy:
        policy_type: and
        evaluation_mode: enforce
        sub_policies:
          # First sub-policy (sibling)
          - policy_type: cpu_usage
            evaluation_mode: enforce
            absolute_limit: 0.75  # Limit to 75% of one core
            refresh_interval: 15s
          # Second sub-policy (sibling)
          - policy_type: memory_usage
            evaluation_mode: enforce
            absolute_limit: 1073741824  # 1Gi in bytes
            refresh_interval: 15s
# OR composite policy - either CPU OR memory can trigger
nodes:
  - name: <node name>
    type: <node type>
    rate_limit:
      evaluation_policy:
        policy_type: or
        evaluation_mode: enforce
        sub_policies:
          - policy_type: cpu_usage
            evaluation_mode: enforce
            relative_limit: 85  # 85% of available CPU
            refresh_interval: 20s
          - policy_type: memory_usage
            evaluation_mode: enforce
            relative_limit: 80  # 80% of available memory
            refresh_interval: 20s
# Monitor mode for testing thresholds
nodes:
  - name: <node name>
    type: <node type>
    rate_limit:
      evaluation_policy:
        policy_type: memory_usage
        evaluation_mode: monitor  # Only logs, doesn't limit
        relative_limit: 70  # Test at 70% before enforcing
        refresh_interval: 30s
How to Use the Filebeat Connector
The Filebeat connector integrates seamlessly with AI Team, enabling data ingestion from any Elasticsearch-compatible source. AI teammates automatically leverage ingested data to analyze application logs, investigate errors, monitor infrastructure, and detect anomalies.
Use Case: Filebeat Log Collection
Collect logs from files, containers, and system logs using Filebeat. Applications and services write logs to files or stdout, Filebeat tails these logs and sends them to Edge Delta via the Elasticsearch Bulk API. AI teammates analyze log patterns, identify errors, and provide insights on application behavior.
Configuration:
- Listen:
0.0.0.0 - Port:
9200 - Enable Health Check:
true - Authentication: Basic (username:
elastic, password:secure-password)
Filebeat configuration (filebeat.yml):
filebeat.inputs:
  - type: filestream
    paths:
      - /var/log/*.log
      - /var/log/app/*.log

output.elasticsearch:
  hosts: ["http://edge-delta-host:9200"]
  username: "elastic"
  password: "secure-password"
AI teammate capabilities:
- Identify error patterns across multiple log files
- Detect anomalies in application behavior
- Correlate errors with deployments or infrastructure changes
- Generate summaries of log activity
Use Case: Logstash Pipeline Integration
Process and transform logs with Logstash before sending to Edge Delta. Logstash collects logs from multiple sources, applies filters and transformations, then forwards structured data to Edge Delta. AI teammates work with enriched, normalized data for more accurate analysis.
Configuration:
- Listen:
0.0.0.0 - Port:
9200 - Active Request Limit:
512 - TLS: Enabled
Logstash pipeline configuration:
input {
  file {
    path => "/var/log/apache/*.log"
    type => "apache"
  }
}

filter {
  grok {
    match => { "message" => "%{COMBINEDAPACHELOG}" }
  }
  date {
    match => [ "timestamp", "dd/MMM/yyyy:HH:mm:ss Z" ]
  }
}

output {
  elasticsearch {
    hosts => ["https://edge-delta-host:9200"]
    ssl => true
    cacert => "/etc/logstash/ca.pem"
    index => "apache-%{+YYYY.MM.dd}"
  }
}
AI teammate capabilities:
- Analyze parsed Apache access logs
- Identify suspicious access patterns
- Monitor response codes and latencies
- Detect potential security threats
Use Case: Kubernetes Logs with Metricbeat
Monitor Kubernetes infrastructure metrics and events using Metricbeat. Metricbeat collects metrics from Kubernetes API, pods, nodes, and system resources, sending metrics to Edge Delta. AI teammates correlate metrics with logs for comprehensive observability and identify performance bottlenecks.
Configuration:
- Listen:
0.0.0.0 - Port:
9200 - Enable Health Check:
true - Show Originating IP:
true
Metricbeat configuration (metricbeat.yml):
metricbeat.modules:
  - module: kubernetes
    metricsets:
      - container
      - node
      - pod
      - system
      - volume
    period: 10s
    hosts: ["localhost:10255"]

output.elasticsearch:
  hosts: ["http://edge-delta-host:9200"]
AI teammate capabilities:
- Detect resource exhaustion (CPU, memory, disk)
- Identify pod restart patterns
- Correlate metrics with log events
- Predict capacity issues
Use Case: Vector-Based Multi-Source Aggregation
Use Vector to aggregate logs from multiple sources and formats before forwarding to Edge Delta. Vector collects from files, syslog, journald, and other sources, transforms data into consistent format, and sends to Edge Delta Elasticsearch API. AI teammates analyze unified data regardless of original source format.
Configuration:
- Listen:
0.0.0.0 - Port:
9200 - Capture Request Headers:
true - Authentication: Bearer (token:
vector-token-abc123)
Vector configuration (vector.toml):
[sources.files]
type = "file"
include = ["/var/log/*.log"]

[sources.journald]
type = "journald"

[transforms.parse]
type = "remap"
inputs = ["files", "journald"]
source = '''
  .timestamp = now()
  .source_type = .source_type
'''

[sinks.edge_delta]
type = "elasticsearch"
inputs = ["parse"]
endpoint = "http://edge-delta-host:9200"
mode = "bulk"
api_version = "v8"
auth.strategy = "bearer"
auth.token = "vector-token-abc123"
AI teammate capabilities:
- Unified analysis across diverse log formats
- Cross-source correlation
- Consistent querying regardless of log origin
- Holistic system understanding
Troubleshooting
Connection refused errors: Verify Edge Delta listening on configured port with netstat -tuln | grep 9200. Check connector deployed to target environment. Test connectivity with curl http://edge-delta-host:9200/_cluster/health. Review firewall rules allow inbound traffic on configured port. Ensure listen address set to 0.0.0.0 for remote connections.
Authentication failures (401 Unauthorized): Verify authentication strategy matches connector configuration (Basic or Bearer). Check username/password correct for Basic auth or token valid for Bearer auth. Ensure client sends correct Authorization header format. For Basic auth: Authorization: Basic <base64(username:password)>. For Bearer: Authorization: Bearer <token>. Review Edge Delta logs for authentication error details.
High latency or timeouts: Check network bandwidth between clients and Edge Delta. Monitor Edge Delta resource usage (CPU, memory). Reduce batch sizes in Filebeat/Logstash if sending very large batches. Increase active_request_limit if consistently at maximum. Implement rate limiting if Edge Delta consistently overwhelmed. Consider deploying multiple Edge Delta agents and load balancing.
TLS handshake failures: Verify TLS enabled in connector configuration with valid certificates. Check server certificate not expired and includes correct hostname. Ensure clients trust certificate authority or configure to trust self-signed certificate. Verify clients using HTTPS URLs not HTTP. Check TLS protocol versions compatible (TLS 1.2 or 1.3 preferred). For mutual TLS, ensure clients presenting valid certificates matching client_auth_type setting.
Bulk requests rejected with 400 Bad Request: Verify NDJSON payload valid and properly formatted. Ensure using newline-delimited JSON (NDJSON), not JSON array. Each bulk action must be on separate line with newline after last action. Check Content-Type header set to application/x-ndjson or application/json. Review Elasticsearch Bulk API specification format. Use -v flag with curl to see detailed error response.
Example valid bulk format:
curl -X POST "http://localhost:9200/_bulk" \
  -H "Content-Type: application/x-ndjson" \
  -d $'{"index":{"_index":"logs"}}\n{"message":"test log","@timestamp":"2024-10-27T12:00:00Z"}\n'
Events missing metadata: Enable capture_request_headers to capture HTTP headers as metadata. Enable show_originating_ip to include client IP addresses. Check client sending standard Elasticsearch fields (_index, _id, _type). Verify timestamp fields present in documents. Review metadata level settings for resource attributes. Ensure custom fields properly structured within documents.
Health check endpoint not responding: Verify enable_health_check set to true in connector configuration. Test health endpoint with curl http://localhost:9200/_cluster/health. Check Edge Delta agent running and connector successfully deployed. Review Edge Delta logs for startup errors. Ensure no firewall blocking health check endpoint specifically.
API version mismatch warnings: Set api_version to match Elasticsearch version your clients expect. Configure custom_api_version_response for clients requiring specific version response format. Check client logs for version compatibility warnings. Update client configuration to accept Edge Delta’s emulated version. Use Elasticsearch 8.x-compatible clients for best compatibility.
Dropping events or rate limit errors: Review rate limit configuration appropriate for traffic volume. Monitor Edge Delta resource utilization for sufficient capacity. Implement batching in clients to send multiple events per bulk request efficiently. Use HTTP keep-alive for persistent connections to reduce overhead. Deploy additional Edge Delta agents and distribute load if hitting capacity limits. Check active_request_limit and increase if needed.
Filebeat/Logstash showing “no Elasticsearch nodes available”: Verify Edge Delta listening on correct host and port. Check network connectivity with telnet edge-delta-host 9200. Ensure health check endpoint enabled and responding. Review client logs for connection error details. Test with curl before configuring clients. Check DNS resolution if using hostnames.
Next Steps
- Learn about Filebeat source configuration for advanced pipeline integration
- Learn about Edge Delta MCP connector for querying Elasticsearch data
- Learn about creating custom teammates that can use Elasticsearch data
- Filebeat Reference - Official Filebeat documentation
- Logstash Documentation - Official Logstash documentation
- Vector Documentation - Official Vector documentation
For additional help, visit AI Team Support.