Elastic Connector
Configure the Elastic connector to enable AI teammates to query Elasticsearch data during investigations using ES|QL.
4 minute read
Overview
The Elastic connector enables AI teammates to query Elasticsearch data in real-time during investigations. When telemetry is distributed across systems (logs stored in Elasticsearch, metrics and traces in Edge Delta), this connector allows teammates to pull data from both sources without manual tool switching.
AI teammates construct and execute ES|QL queries to retrieve relevant log data, then correlate findings with metrics and traces from Edge Delta. This integration supports cross-platform investigations where complete context requires data from multiple observability backends.
Add the Elastic Connector
To add the Elastic connector, you provide your Kibana URL and an API key with query permissions. Once configured, you grant the connector to teammates who need access to Elasticsearch data during their investigations.
Prerequisites
Before configuring the connector, ensure you have:
- A Kibana instance accessible from Edge Delta
- An API key with query permissions for the Elasticsearch indices you want AI teammates to access
Configuration steps
- Navigate to AI Team > Connectors in the Edge Delta application
- Click Add Connector and select Elastic
- Provide your Kibana URL and API key
- Click Save or Connect
Grant connector access to teammates
After configuring the connector, grant access to the teammates that need it:
- Navigate to the teammate configuration page (e.g., SRE Teammate)
- Click Manage Connectors
- Click the plus icon next to the Elastic connector to grant access
General options
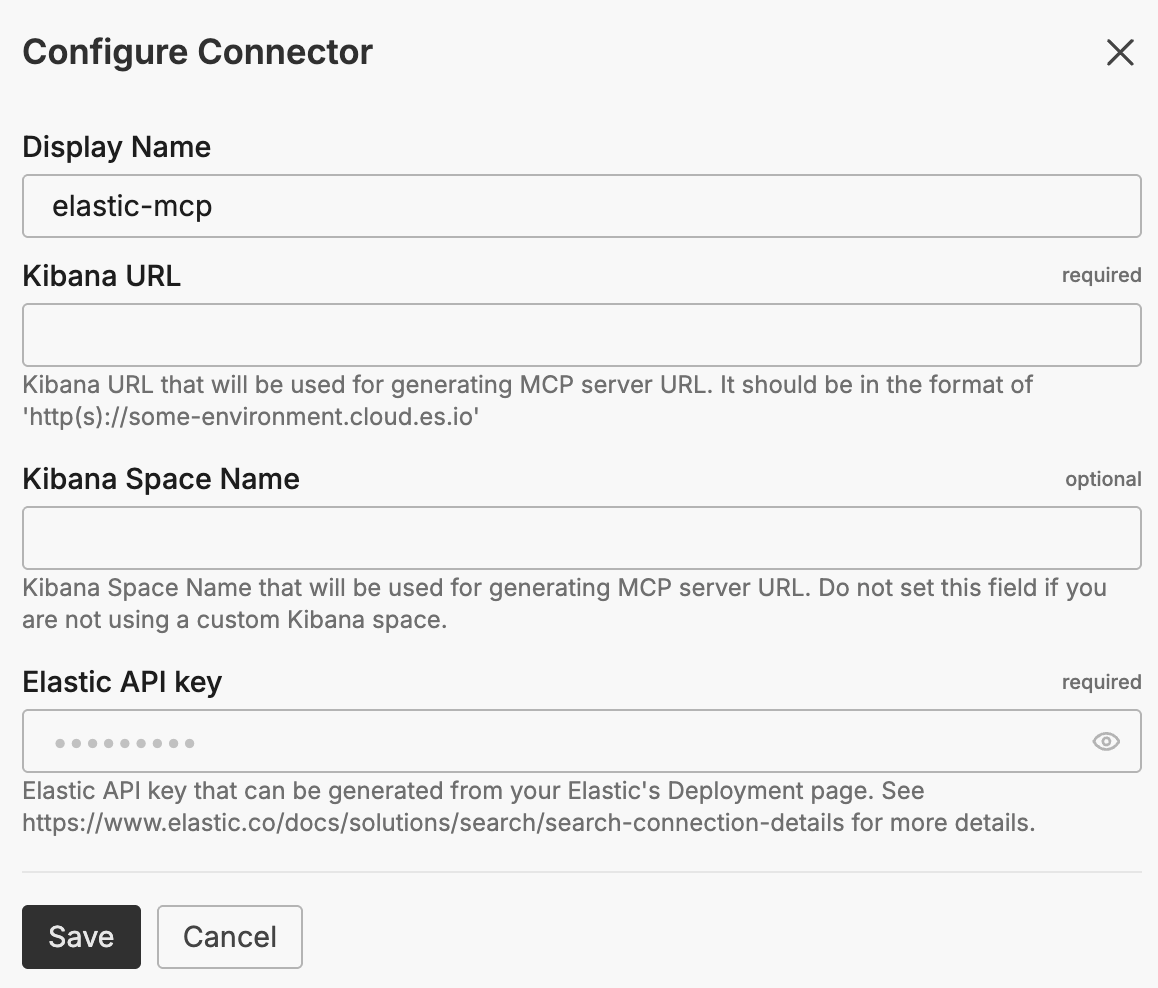
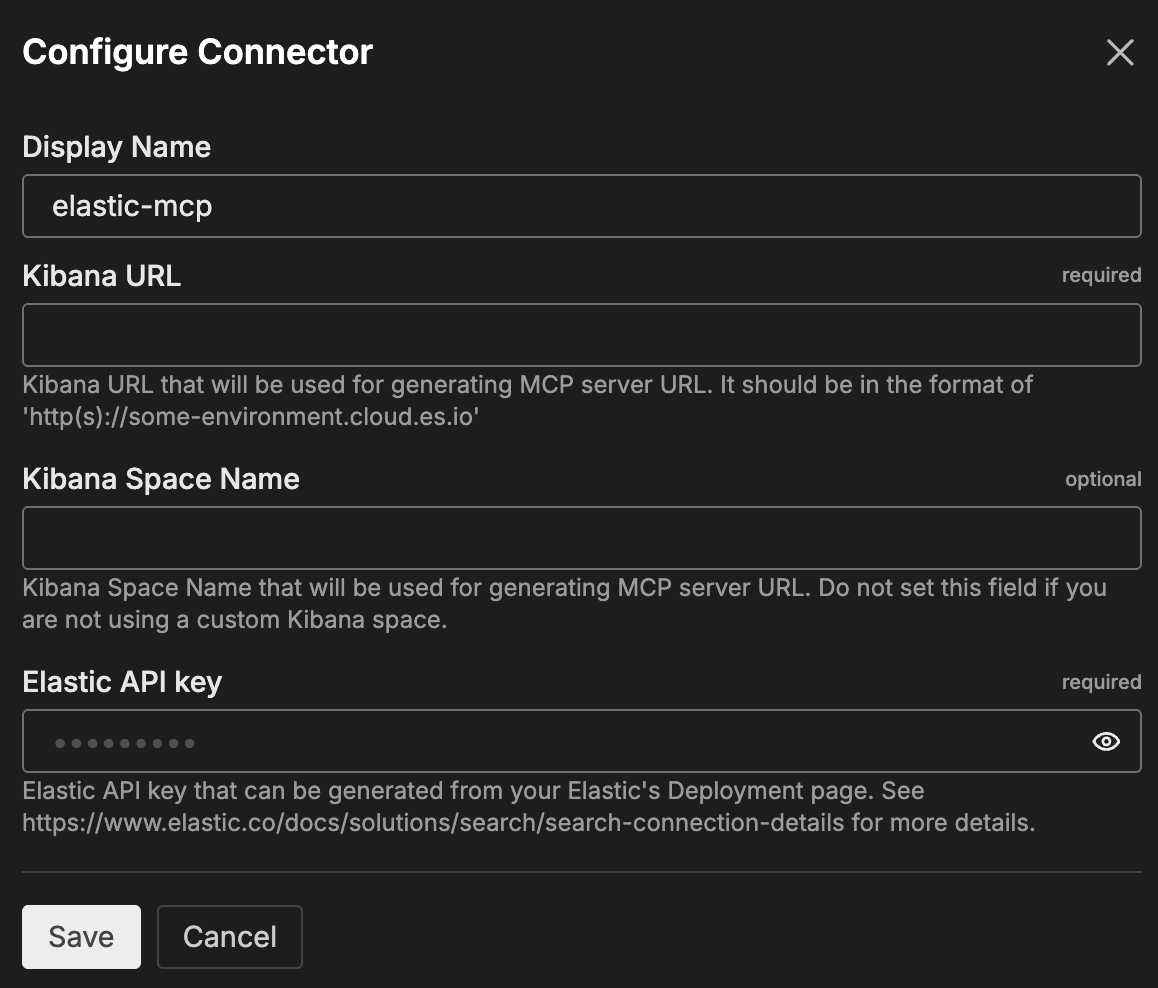
Display Name
A friendly name for this connector instance. Defaults to elastic-mcp.
Kibana URL
The URL of your Elastic Kibana instance used to generate the MCP server URL. Use the format https://your-environment.cloud.es.io.
Example: https://your-deployment.kb.us-east-1.aws.found.io
Kibana Space Name
The Kibana space name used when generating the MCP server URL. Leave this field empty if you are not using a custom Kibana space.
Elastic API Key
API key used to authenticate query requests. Generate this key from your Elastic deployment page.
For details on generating API keys, see Search connection details in the Elastic documentation.
How to use the Elastic connector
The Elastic connector integrates with AI Team, enabling teammates to retrieve log data from Elasticsearch as part of their investigation workflows. Teammates construct ES|QL queries based on the investigation context, retrieve matching logs, and correlate findings with other telemetry sources.
Use case: Cross-platform service investigation
When an investigation begins with metrics or traces in Edge Delta showing error patterns, teammates can use the Elastic connector to retrieve related logs:
- Edge Delta telemetry shows 504 responses in the frontend-proxy service
- The SRE teammate uses the Elastic connector to query logs from the same service and time window
- ES|QL queries identify patterns in the log data:
- Specific endpoints returning errors (e.g.,
/api/products/{id}) - Repeated connections to problematic upstream instances
- Timeout indicators and connection failure messages
- Specific endpoints returning errors (e.g.,
- The teammate correlates log findings with trace data to identify root cause
- Investigation concludes with remediation steps: pod health checks, service configuration validation, upstream dependency verification
This pattern eliminates context switching between tools. Teammates autonomously pull telemetry from each platform and synthesize findings into actionable recommendations.
Use case: Error pattern analysis
When investigating error spikes, teammates query Elasticsearch for log patterns matching the error window:
- Filter logs by service, timestamp, and severity
- Identify recurring error messages or exception patterns
- Correlate with deployment events or configuration changes
Use case: Historical log retrieval
For post-incident analysis, teammates can retrieve historical logs that extend beyond Edge Delta’s retention window, correlating past events with current patterns.
Troubleshooting
Authentication errors: Verify that your API key is valid and has query permissions for the indices being accessed. Check that the key hasn’t expired or been revoked.
Connection errors: Confirm the Kibana URL is correct and accessible from Edge Delta. Verify network connectivity and any firewall rules that might block access.
Query failures: Ensure the indices exist and the API key has read access. Check that ES|QL syntax is correct for your Elasticsearch version.
Empty results: Verify that the time range and filters match data that exists in your indices. Check index patterns and field names.
Next steps
- Learn about creating custom teammates that can use the Elastic connector
- Explore other connectors to integrate additional tools and services
For additional help, visit AI Team Support.