Edge Delta Monitor Events Explorer
2 minute read
Overview
Edge Delta’s Monitor Events explorer is powered by the Common Query Language (CQL). Edge Delta pipelines send logs, metrics and events to your configured data destinations. To enable the Monitor Event functions, Monitors also generate events in the Edge Delta back end and you explore them on this page.
Monitor Events
Click Events and select the Monitor Events tab.
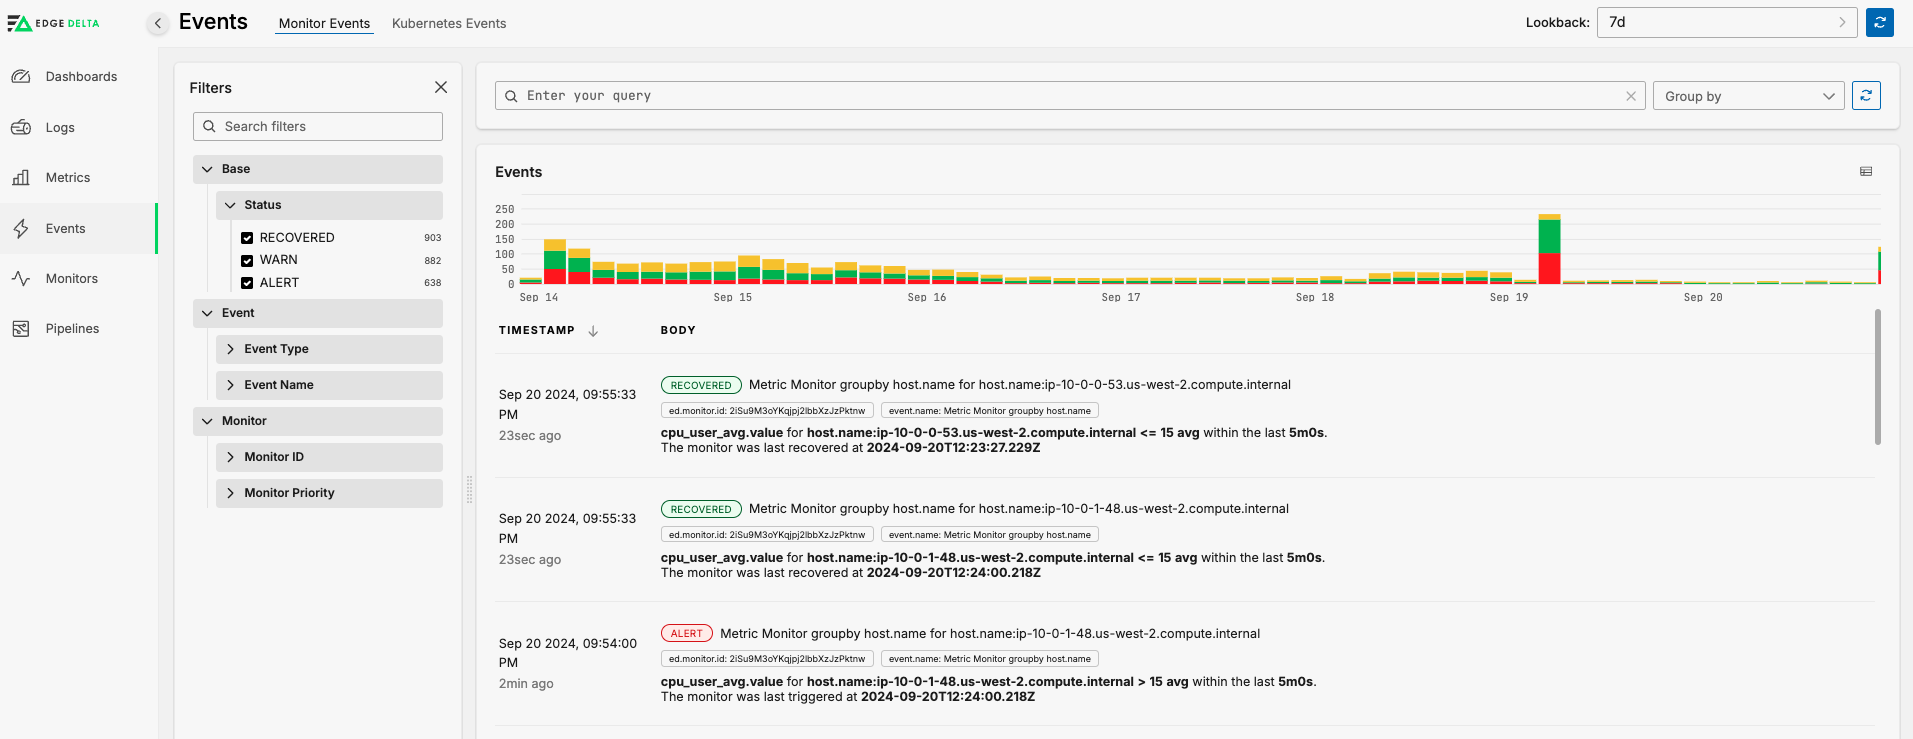
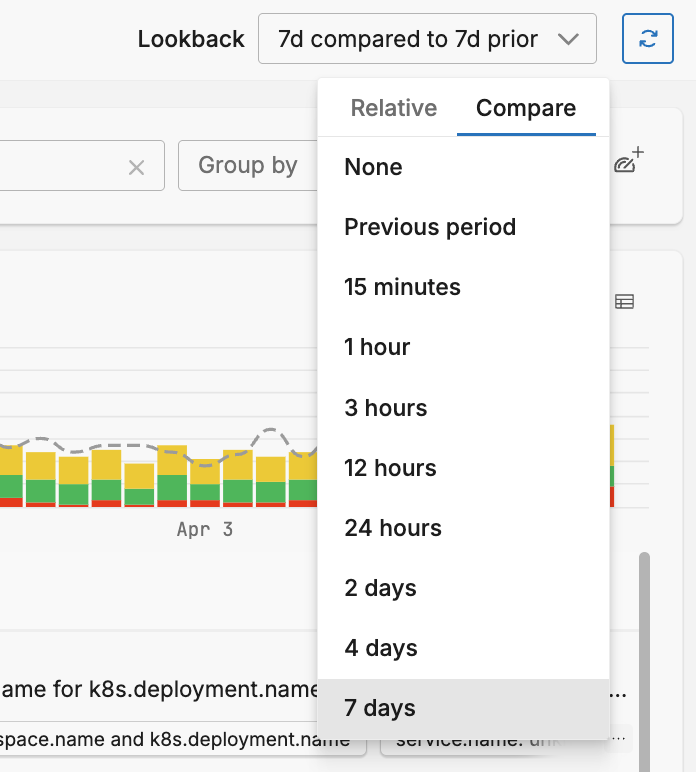
You can select the Lookback period and the comparison period. The comparison period takes the average of lookback intervals for the given period and this is rendered as the line in the graph:
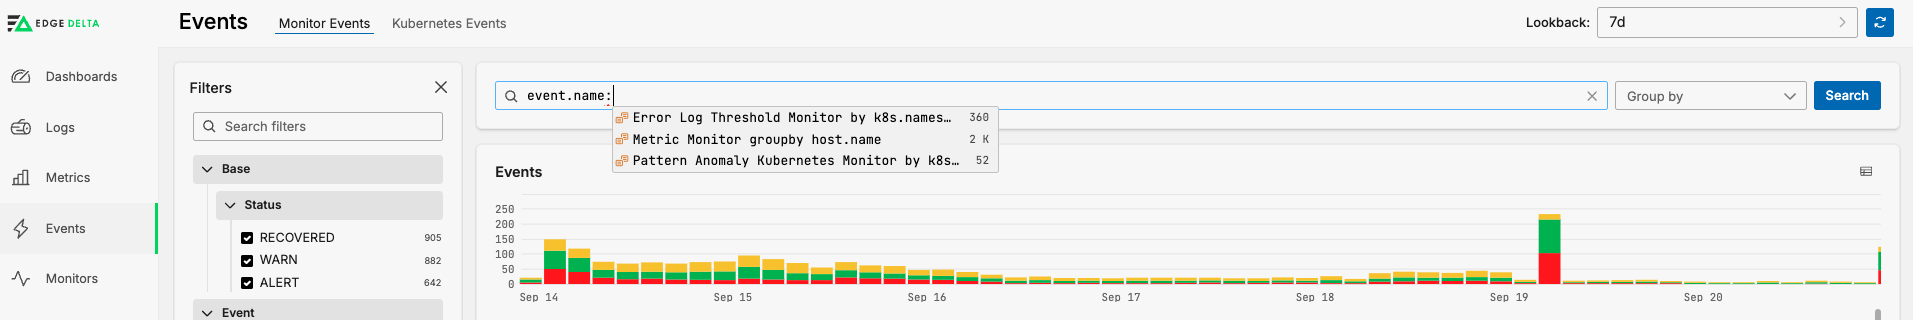
Search
You can search for particular events using autocomplete.
Filter
You can also filter results using the Filters pane. Selecting all the checkboxes shows results from all the selected options. You can choose one specific filter, such as a Namespace to view results from only that namespace. If you select none of the filters, no results will be shown.
You can click and drag a time period on the histogram to filter the lookback period on it.
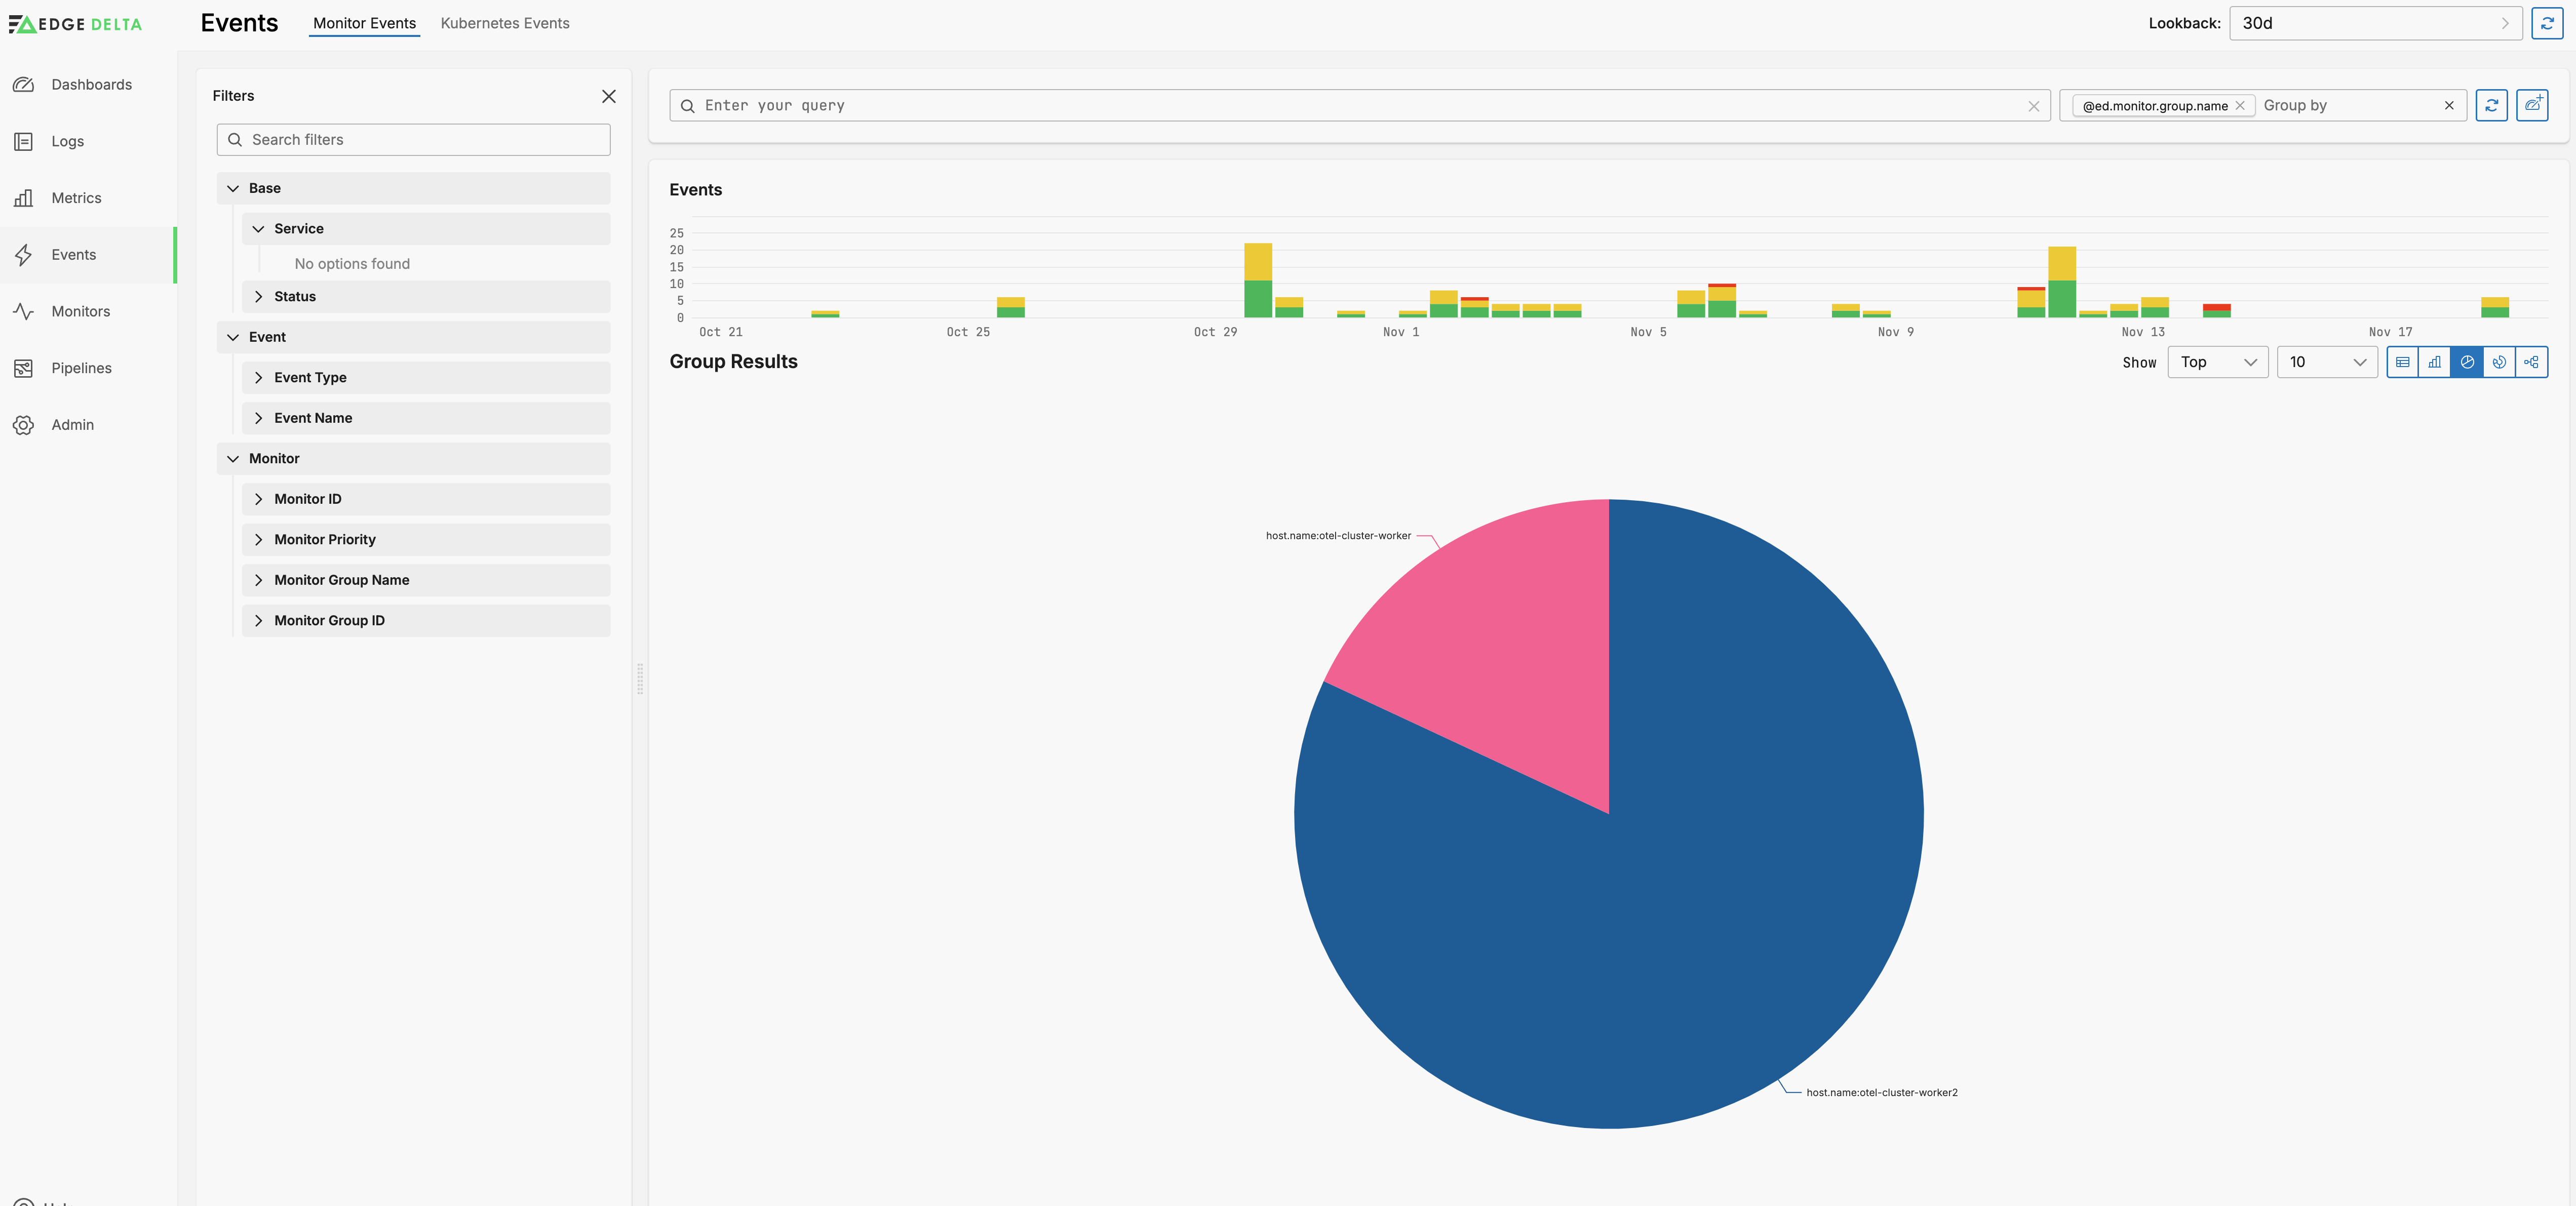
Group by
You can group the graph by any of the facets listed in the Filter Pane using the Group By option. With a group selected you can view the table as a pie chart:
Add Facet
See Add Facets.
You can select the facet in the Group By list, and you can filter by the facet in the Filters pane.
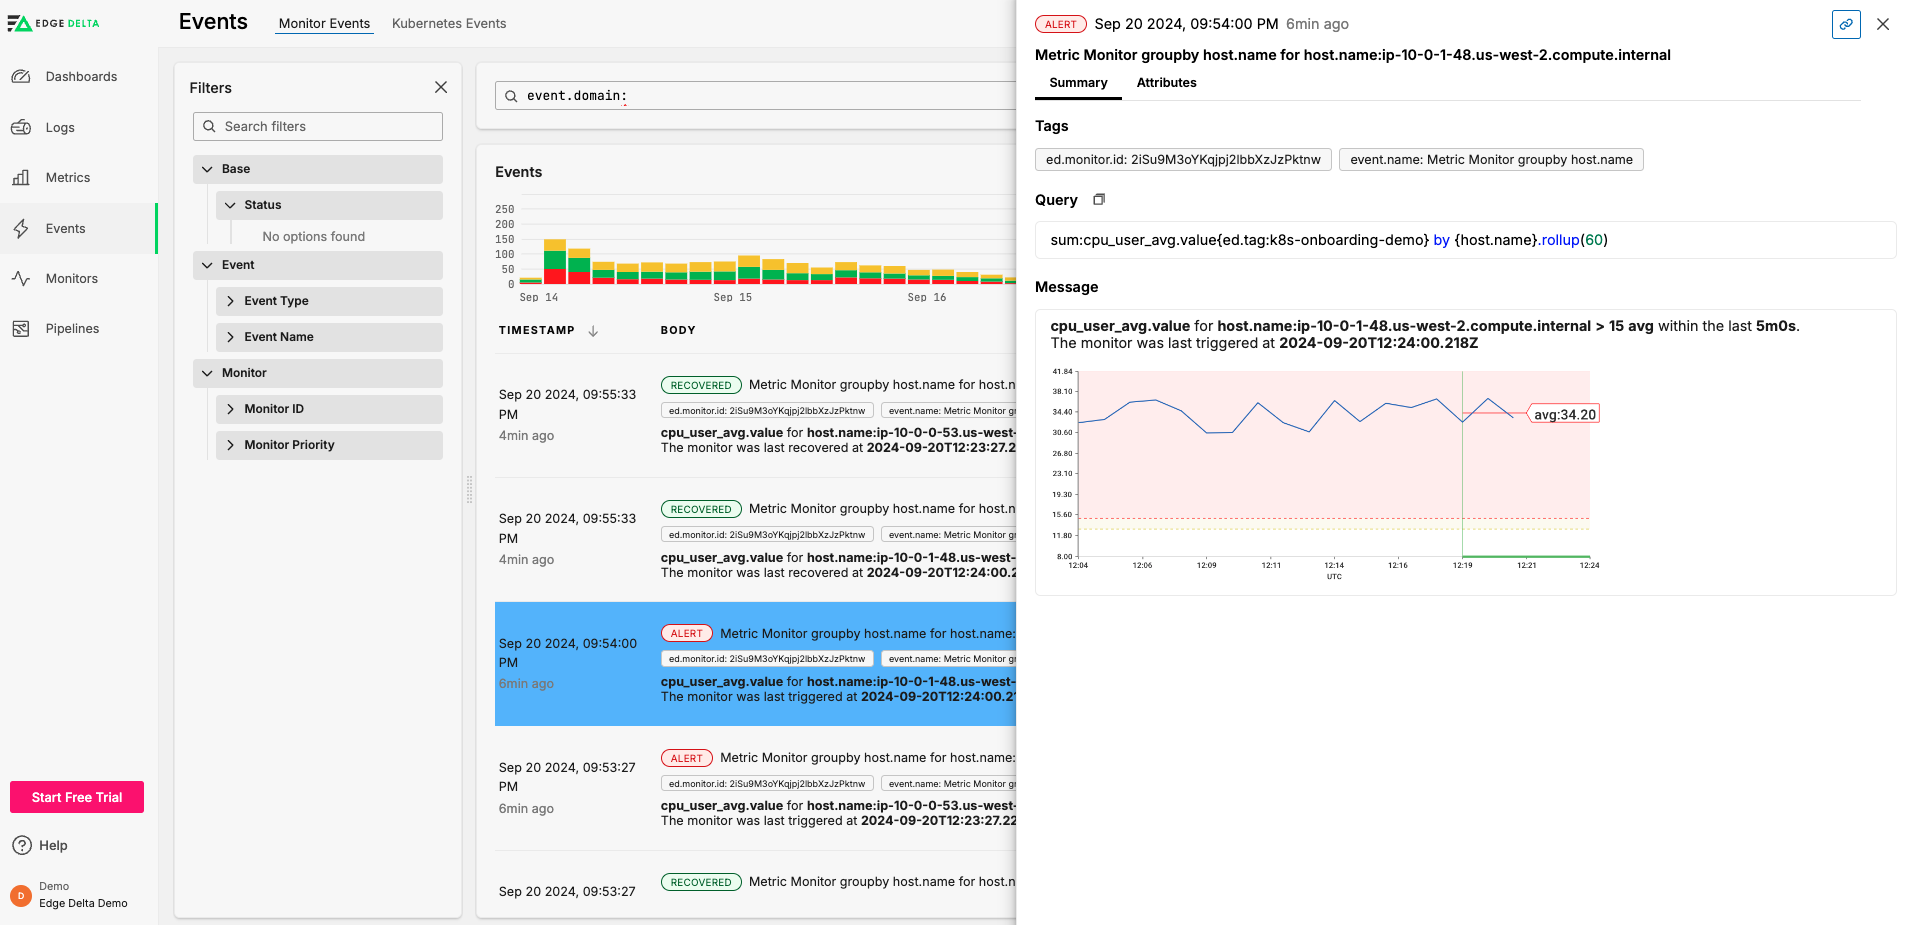
Event Details
Click an event in the search results to see more details about it in a side pane.