Exec Connector
Configure the Exec connector to collect output from periodically executed commands and scripts for analysis by AI teammates.
10 minute read
Overview
The Exec connector collects output from periodically executed commands and scripts. It runs custom commands or shell scripts at specified intervals on hosts where Edge Delta agents are deployed, capturing stdout and stderr into Edge Delta Pipelines for analysis by AI teammates through the Edge Delta MCP connector.
When you add this streaming connector, it appears as a Exec source in your selected pipeline. AI teammates access this data by querying the Edge Delta backend with the Edge Delta MCP connector.
Add the Exec Connector
To add the Exec connector, you configure a command or script to execute at regular intervals, then deploy to an environment.
Prerequisites
Before configuring the connector, ensure you have:
- Edge Delta agent deployed with permissions to execute commands
- Commands, scripts, or binaries accessible from the agent host
- Required command-line tools installed (curl, psql, jq, custom binaries)
Configuration Steps
- Navigate to AI Team > Connectors in the Edge Delta application
- Find the Exec connector in Streaming Connectors
- Click the connector card
- Configure the Command to execute (absolute path with arguments)
- Set the Run Interval for execution frequency
- Optionally add a Script if using shell executables
- Select a Linux, macOS, or Windows environment
- Click Save
The connector is now executing the command at the specified interval.
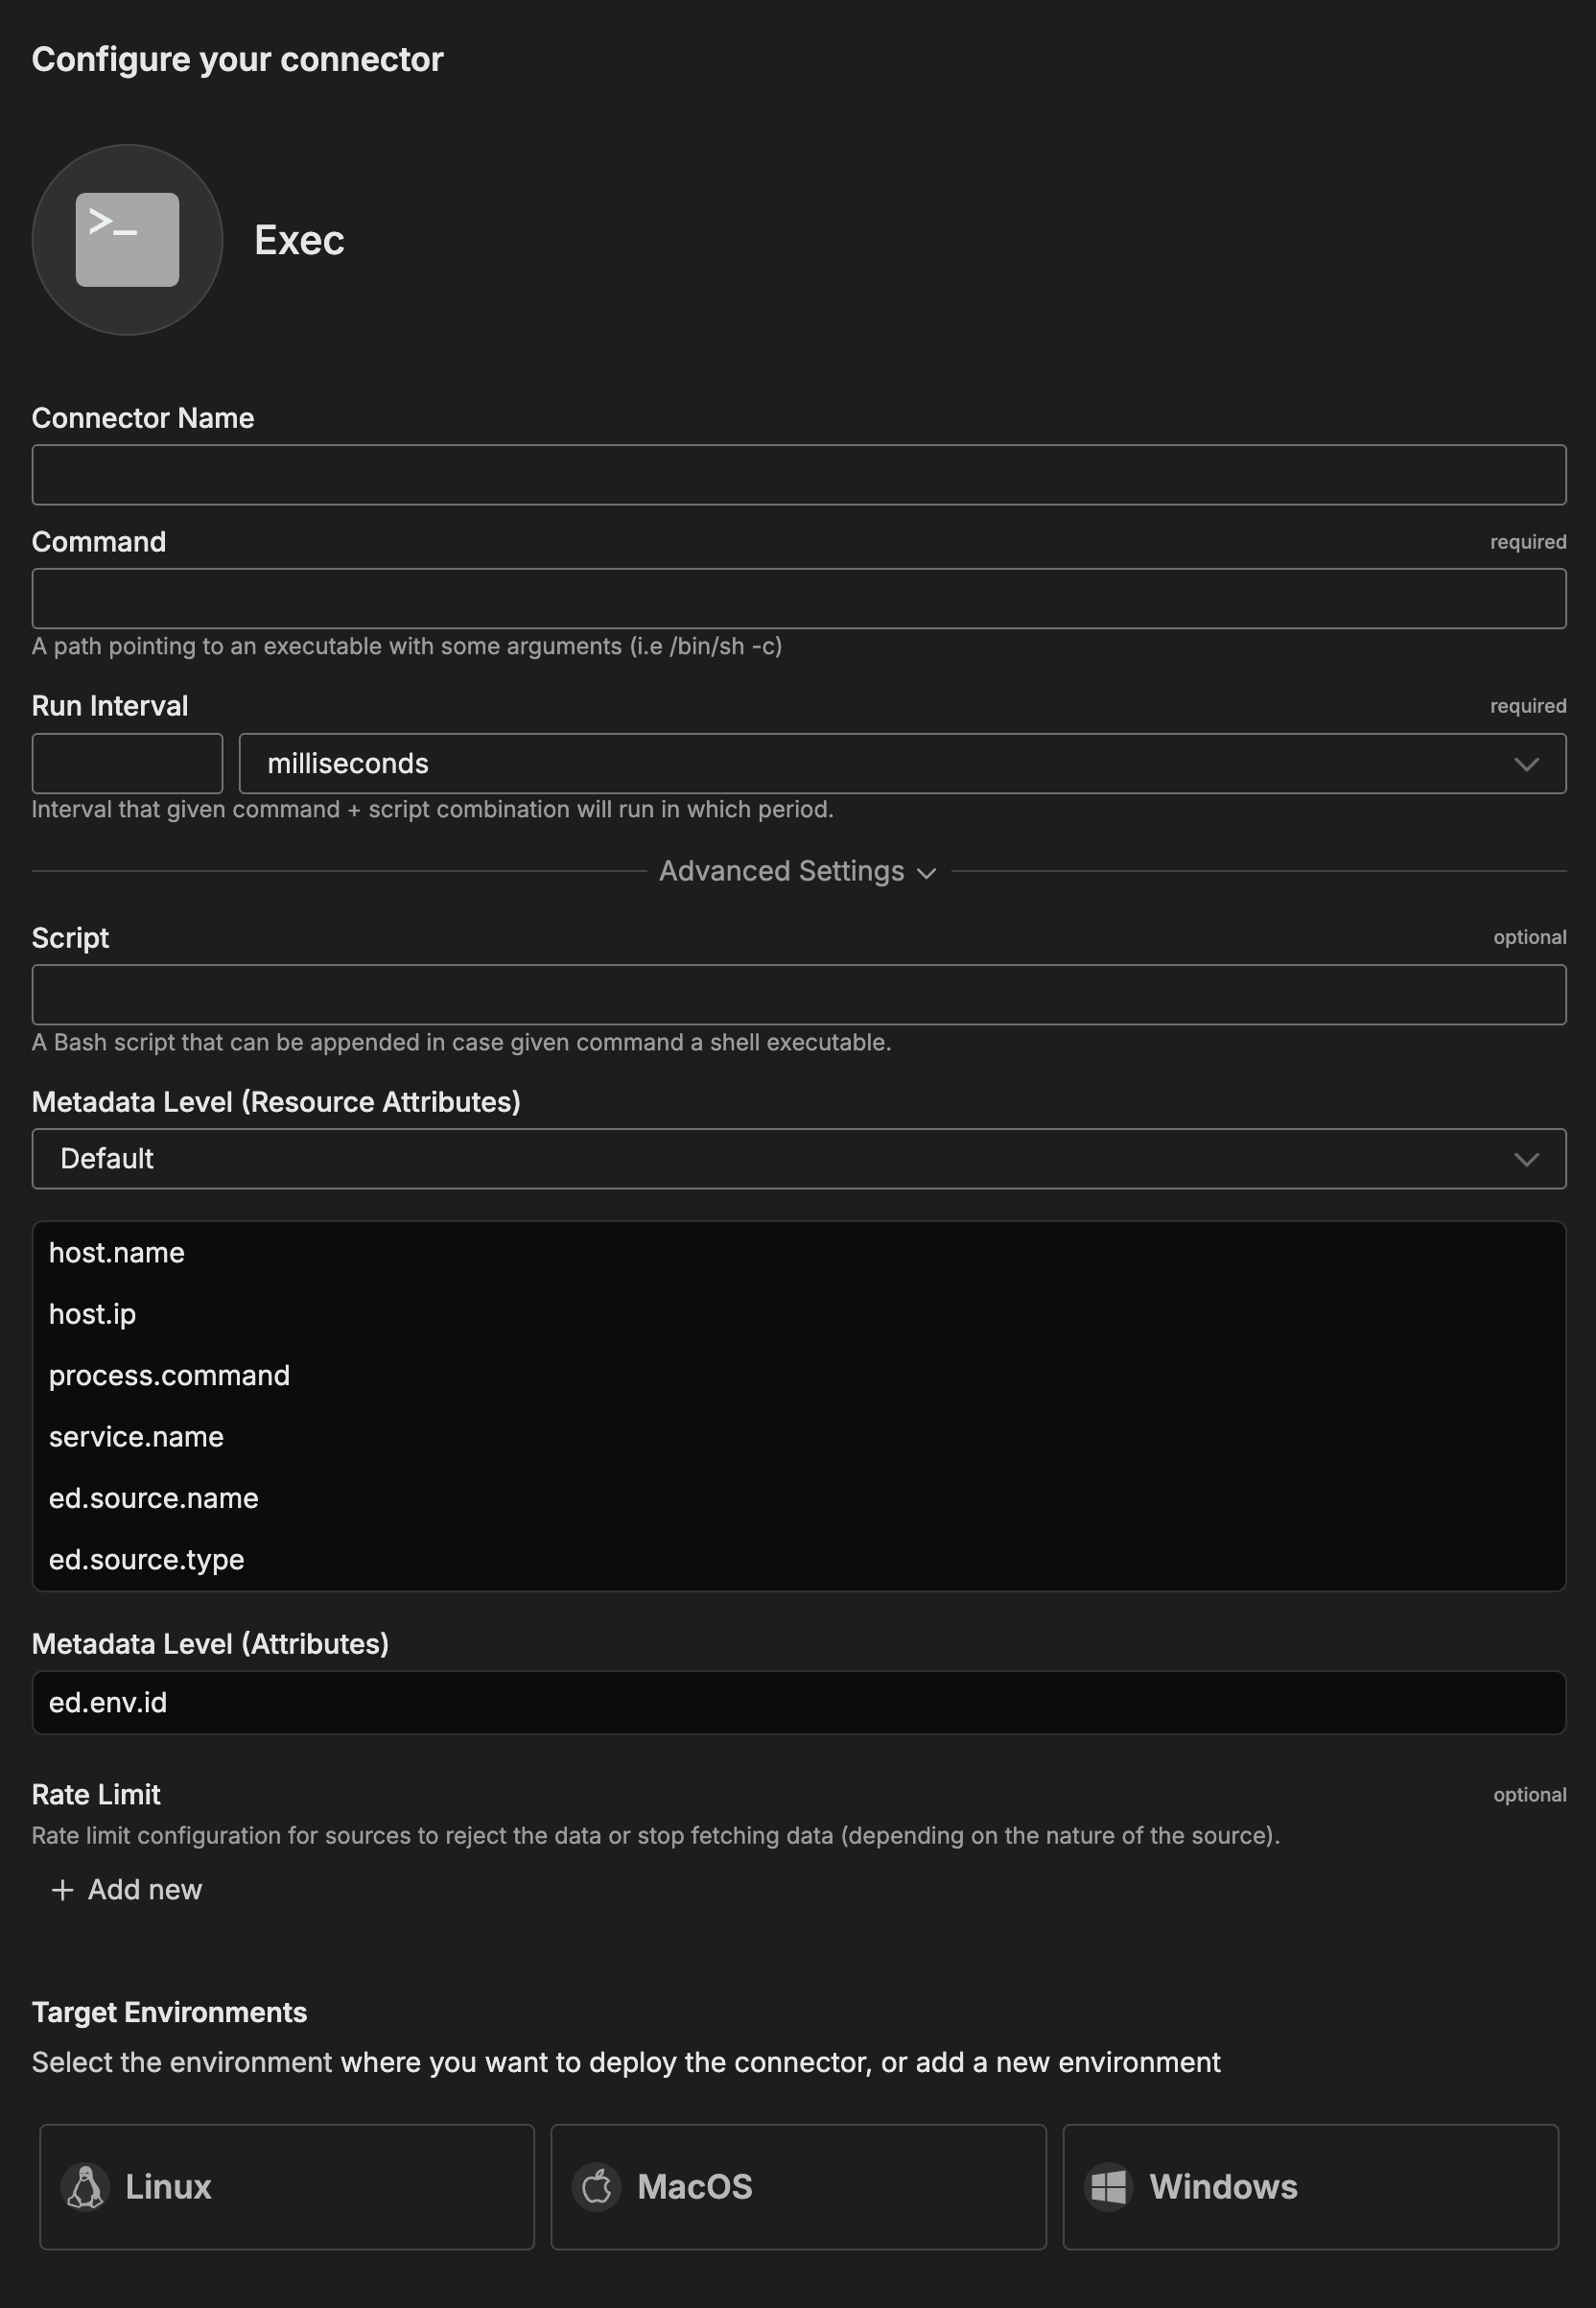
Configuration Options
Connector Name
Name to identify this Exec connector instance.
Command
Absolute path to an executable with optional arguments.
Format: /path/to/executable [arguments]
Examples:
/bin/bash -c- Execute bash commands (use with Script field)/usr/bin/python3 /opt/scripts/health_check.py- Run Python script/usr/bin/psql -h localhost -U postgres -c "SELECT count(*) FROM users"- Database query
Run Interval
How frequently the command executes. Balance data freshness against system resource consumption.
Format: Duration with unit (ms, s, m, h)
Examples:
30s- Every 30 seconds (critical health checks)1m- Every minute (application metrics)5m- Every 5 minutes (less time-sensitive diagnostics)
Script
Bash script content to execute when Command points to a shell executable (/bin/bash -c or /bin/sh -c). Allows multi-line scripts with complex logic.
Example:
#!/bin/bash
echo "Checking application health..."
curl -s http://localhost:8080/health | jq .
Advanced Settings
Metadata Level
This option is used to define which detected resources and attributes to add to each data item as it is ingested by Edge Delta. You can select:
- Required Only: This option includes the minimum required resources and attributes for Edge Delta to operate.
- Default: This option includes the required resources and attributes plus those selected by Edge Delta
- High: This option includes the required resources and attributes along with a larger selection of common optional fields.
- Custom: With this option selected, you can choose which attributes and resources to include. The required fields are selected by default and can’t be unchecked.
Based on your selection in the GUI, the source_metadata YAML is populated as two dictionaries (resource_attributes and attributes) with Boolean values.
See Choose Data Item Metadata for more information on selecting metadata.
Additional metadata automatically included:
- Exit code - Command exit status
- Execution duration - Time taken to execute
- Command output - Captured stdout and stderr
Rate Limit
The rate_limit parameter enables you to control data ingestion based on system resource usage. This advanced setting helps prevent source nodes from overwhelming the agent by automatically throttling or stopping data collection when CPU or memory thresholds are exceeded.
Use rate limiting to prevent runaway log collection from overwhelming the agent in high-volume sources, protect agent stability in resource-constrained environments with limited CPU/memory, automatically throttle during bursty traffic patterns, and ensure fair resource allocation across source nodes in multi-tenant deployments.
When rate limiting triggers, pull-based sources (File, S3, HTTP Pull) stop fetching new data, push-based sources (HTTP, TCP, UDP, OTLP) reject incoming data, and stream-based sources (Kafka, Pub/Sub) pause consumption. Rate limiting operates at the source node level, where each source with rate limiting enabled independently monitors and enforces its own thresholds.
Rate limiting vs backpressure: Rate limiting and backpressure are different mechanisms. Rate limiting controls data ingestion at the source based on CPU or memory thresholds. Backpressure controls data output at the destination when in-memory queues fill up. Backpressure logs such as
backpressure: dataCh at 92% capacitydo not appear when rate limiting triggers, and rate limiting logs do not appear during backpressure events.
Observability: When rate limiting is active in enforce mode, the agent does not produce INFO, WARN, or ERROR level logs. To confirm that rate limiting is triggering, check the source node’s Bytes I/O metrics in the Edge Delta app for gaps or drops that coincide with expected throttling periods.
Configuration Steps:
- Click Add New in the Rate Limit section
- Click Add New for Evaluation Policy
- Select Policy Type:
- CPU Usage: Monitors CPU consumption and rate limits when usage exceeds defined thresholds. Use for CPU-intensive sources like file parsing or complex transformations.
- Memory Usage: Monitors memory consumption and rate limits when usage exceeds defined thresholds. Use for memory-intensive sources like large message buffers or caching.
- AND (composite): Combines multiple sub-policies with AND logic. All sub-policies must be true simultaneously to trigger rate limiting. Use when you want conservative rate limiting (both CPU and memory must be high).
- OR (composite): Combines multiple sub-policies with OR logic. Any sub-policy can trigger rate limiting. Use when you want aggressive rate limiting (either CPU or memory being high triggers).
- Select Evaluation Mode. Choose how the policy behaves when thresholds are exceeded:
- Enforce (default): Actively applies rate limiting when thresholds are met. Pull-based sources (File, S3, HTTP Pull) stop fetching new data, push-based sources (HTTP, TCP, UDP, OTLP) reject incoming data, and stream-based sources (Kafka, Pub/Sub) pause consumption. Use in production to protect agent resources.
- Monitor: Logs when rate limiting would occur without actually limiting data flow. Use for testing thresholds before enforcing them in production.
- Passthrough: Disables rate limiting entirely while keeping the configuration in place. Use to temporarily disable rate limiting without removing configuration.
- Set Absolute Limits and Relative Limits (for CPU Usage and Memory Usage policies)
Note: If you specify both absolute and relative limits, the system evaluates both conditions and rate limiting triggers when either condition is met (OR logic). For example, if you set absolute limit to
1.0CPU cores and relative limit to50%, rate limiting triggers when the source uses either 1 full core OR 50% of available CPU, whichever happens first.
For CPU Absolute Limits: Enter value in full core units:
0.1= one-tenth of a CPU core0.5= half a CPU core1.0= one full CPU core2.0= two full CPU cores
For CPU Relative Limits: Enter percentage of total available CPU (0-100):
50= 50% of available CPU75= 75% of available CPU85= 85% of available CPU
For Memory Absolute Limits: Enter value in bytes
104857600= 100Mi (100 × 1024 × 1024)536870912= 512Mi (512 × 1024 × 1024)1073741824= 1Gi (1 × 1024 × 1024 × 1024)
For Memory Relative Limits: Enter percentage of total available memory (0-100)
60= 60% of available memory75= 75% of available memory80= 80% of available memory
- Set Refresh Interval (for CPU Usage and Memory Usage policies). Specify how frequently the system checks resource usage:
- Recommended Values:
10sto30sfor most use cases5sto10sfor high-volume sources requiring quick response1mor higher for stable, low-volume sources
The system fetches current CPU/memory usage at the specified refresh interval and uses that value for evaluation until the next refresh. Shorter intervals provide more responsive rate limiting but incur slightly higher overhead, while longer intervals are more efficient but slower to react to sudden resource spikes.
The GUI generates YAML as follows:
# Simple CPU-based rate limiting
nodes:
  - name: <node name>
    type: <node type>
    rate_limit:
      evaluation_policy:
        policy_type: cpu_usage
        evaluation_mode: enforce
        absolute_limit: 0.5  # Limit to half a CPU core
        refresh_interval: 10s
# Simple memory-based rate limiting
nodes:
  - name: <node name>
    type: <node type>
    rate_limit:
      evaluation_policy:
        policy_type: memory_usage
        evaluation_mode: enforce
        absolute_limit: 536870912  # 512Mi in bytes
        refresh_interval: 30s
Composite Policies (AND / OR)
When using AND or OR policy types, you define sub-policies instead of limits. Sub-policies must be siblings (at the same level)—do not nest sub-policies within other sub-policies. Each sub-policy is independently evaluated, and the parent policy’s evaluation mode applies to the composite result.
- AND Logic: All sub-policies must evaluate to true at the same time to trigger rate limiting. Use when you want conservative rate limiting (limit only when CPU AND memory are both high).
- OR Logic: Any sub-policy evaluating to true triggers rate limiting. Use when you want aggressive protection (limit when either CPU OR memory is high).
Configuration Steps:
- Select AND (composite) or OR (composite) as the Policy Type
- Choose the Evaluation Mode (typically Enforce)
- Click Add New under Sub-Policies to add the first condition
- Configure the first sub-policy by selecting policy type (CPU Usage or Memory Usage), selecting evaluation mode, setting absolute and/or relative limits, and setting refresh interval
- In the parent policy (not within the child), click Add New again to add a sibling sub-policy
- Configure additional sub-policies following the same pattern
The GUI generates YAML as follows:
# AND composite policy - both CPU AND memory must exceed limits
nodes:
  - name: <node name>
    type: <node type>
    rate_limit:
      evaluation_policy:
        policy_type: and
        evaluation_mode: enforce
        sub_policies:
          # First sub-policy (sibling)
          - policy_type: cpu_usage
            evaluation_mode: enforce
            absolute_limit: 0.75  # Limit to 75% of one core
            refresh_interval: 15s
          # Second sub-policy (sibling)
          - policy_type: memory_usage
            evaluation_mode: enforce
            absolute_limit: 1073741824  # 1Gi in bytes
            refresh_interval: 15s
# OR composite policy - either CPU OR memory can trigger
nodes:
  - name: <node name>
    type: <node type>
    rate_limit:
      evaluation_policy:
        policy_type: or
        evaluation_mode: enforce
        sub_policies:
          - policy_type: cpu_usage
            evaluation_mode: enforce
            relative_limit: 85  # 85% of available CPU
            refresh_interval: 20s
          - policy_type: memory_usage
            evaluation_mode: enforce
            relative_limit: 80  # 80% of available memory
            refresh_interval: 20s
# Monitor mode for testing thresholds
nodes:
  - name: <node name>
    type: <node type>
    rate_limit:
      evaluation_policy:
        policy_type: memory_usage
        evaluation_mode: monitor  # Only logs, doesn't limit
        relative_limit: 70  # Test at 70% before enforcing
        refresh_interval: 30s
Target Environments
Select a Linux, macOS, or Windows environment where you want to deploy this connector.
How to Use the Exec Connector
The Exec connector integrates seamlessly with AI Team, enabling analysis of custom metrics, health checks, and system diagnostics. AI teammates automatically leverage the ingested data based on the queries they receive and the context of the conversation.
Use Case: Application Health Check Monitoring
Periodically query application health endpoints to track service status, database connectivity, and cache availability. AI teammates analyze health check output to identify degraded services, correlate health issues with other telemetry, and investigate incidents. When combined with PagerDuty alerts, teammates automatically query recent health check results during incident investigation.
Configuration: Command: /bin/bash -c, Script: curl -s http://localhost:8080/health | jq ., Run Interval: 30s
Use Case: Custom Database Metrics
Execute SQL queries via CLI tools to collect metrics unavailable through standard exporters. AI teammates analyze query results to identify capacity concerns, detect connection leaks, and predict when intervention is needed. This works for PostgreSQL, MySQL, Oracle, and legacy databases with CLI access.
Configuration: Command: /usr/bin/psql -h localhost -U metrics_user -t -c "SELECT 'active_connections', count(*) FROM pg_stat_activity", Run Interval: 1m
Use Case: Disk Space Monitoring
Monitor critical mount points across server fleets using standard disk commands. AI teammates identify hosts approaching capacity limits, track usage trends, and prioritize cleanup efforts. This lightweight approach is ideal when full node exporters aren’t feasible.
Configuration: Command: /bin/bash -c, Script: df -h | grep -E '/$|/data|/var' | awk '{print $6, $5, $4}', Run Interval: 5m
Troubleshooting
Command not found errors: Use absolute paths for all commands. Verify command exists at specified path (ls -l /path/to/command).
Scripts fail when run by connector: Use absolute paths within scripts. Set required environment variables explicitly in the script. Include proper shebang line (#!/bin/bash).
Permission denied errors: Ensure execute permissions (chmod +x /path/to/script.sh). Verify Edge Delta agent user can execute the command.
No output appearing: Verify script writes to stdout. Check Edge Delta logs for errors. Ensure proper shebang line.
High system load: Increase run interval. Optimize scripts for performance. Use rate limiting settings.
Agent unresponsive: Implement timeouts within scripts. Limit script output size. Ensure scripts terminate properly.
Next Steps
- Learn about creating custom teammates that can use Exec output
- Explore the Edge Delta MCP connector for querying command output
For additional help, visit AI Team Support.