Edge Delta Extract Metric Processor
14 minute read
Overview
The extract metric processor converts a data item into a metric item and uses one of its fields as the metric. This is useful if your data item already contains a useful metric.
See Extract and Aggregate Metrics for more information about using the extract metric processor.
Use the configuration wizard below to generate a starter YAML configuration.
Log-to-Metrics Use Case
Organizations often have comprehensive logging in place but lack dedicated metrics collection. The extract metric processor enables you to derive metric insights from existing log data without deploying additional APM agents or metrics infrastructure. This approach reduces operational complexity and cost while providing the telemetry needed for effective monitoring.
Common log-to-metrics scenarios include extracting HTTP response codes from web server logs, deriving latency metrics from application logs, and calculating error rates from service logs. By processing logs at the edge and extracting metrics pre-index, you reduce data volume while maintaining observability coverage.
Example Input
Consider this log:
{
  "_type": "log",
  "timestamp": 1744873926928,
  "body": "{\"timestamp\": \"2025-04-17T07:12:05.923408Z\", \"level\": \"Alert\", \"msg\": \"processing failed\", \"user\": {\"email\": \"wang.xiu@mymailservice.com\", \"id\": \"96dd851f-e791-4388-98c7-cbb7e3df50b2\", \"name\": \"08ecbb0d-a961-4c8a-8db0-040e537257af\"}, \"request\": {\"ip\": \"172.24.16.218\", \"method\": \"DELETE\", \"path\": \"/json/view\"}, \"status\": 500, \"response_time_ms\": 7837}",
  "resource": {
    ...
  },
  "attributes": {
    "level": "Alert",
    "msg": "processing failed",
    "request": {
      "ip": "172.24.16.218",
      "method": "DELETE",
      "path": "/json/view"
    },
    "response_time_ms": 7837,
    "status": 500,
    "timestamp": "2025-04-17T07:12:05.923408Z",
    "user": {
      "email": "wang.xiu@mymailservice.com",
      "id": "96dd851f-e791-4388-98c7-cbb7e3df50b2",
      "name": "08ecbb0d-a961-4c8a-8db0-040e537257af"
    }
  }
}
Note: The body is JSON that has been parsed into attributes.
Note: The extract metric processor can consume doubles or integers.
Suppose you want to monitor the count of HTTP response codes across all logs. You can convert the log into a metric focused on the status attribute.
Example Configuration
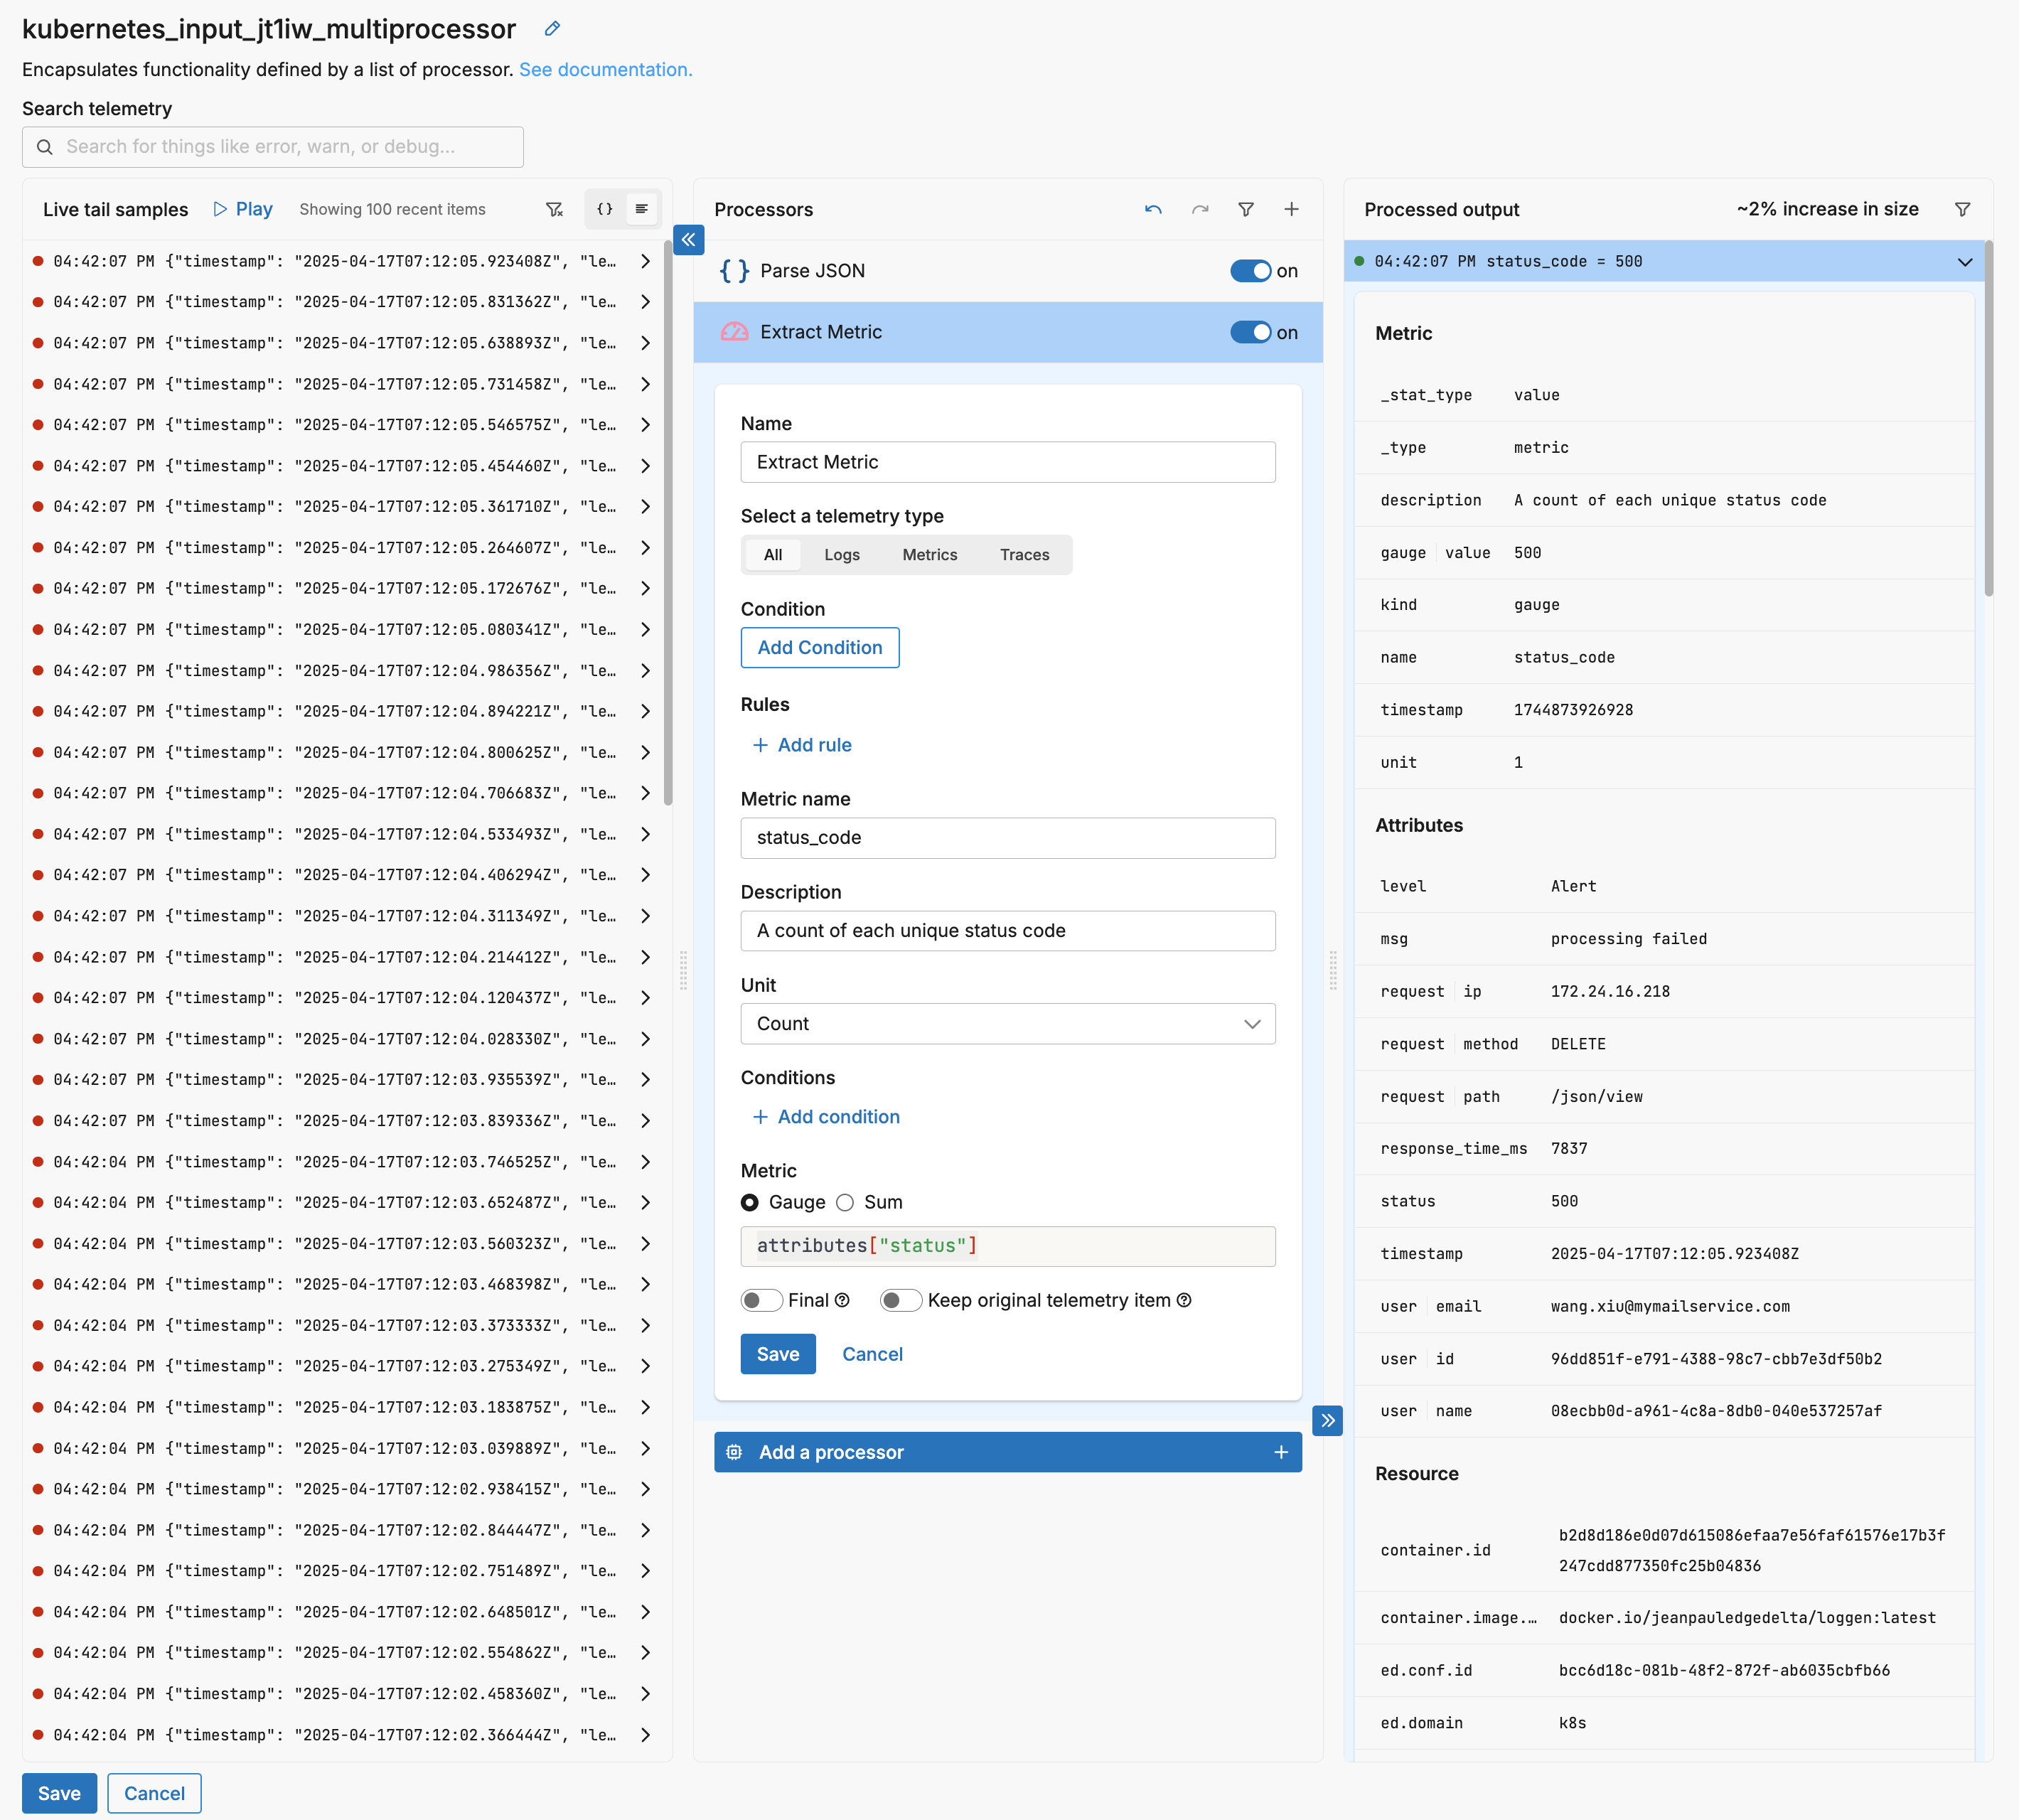
In this example, the extract metric processor creates a gauge type metric with a count of unique values found in the attributes["status"] field.
Note: The status attribute is an integer. If it was a string, you have the opportunity to convert the data type using the target field with the OTTL convertor. You should convert it into a double (
Double(attributes["status"])), but integers (Int(attributes["status"])) are also accepted by the processor.
The corresponding YAML is as follows (without the parse JSON processor).
- name: kubernetes_input_jt1iw_multiprocessor
  type: sequence
  processors:
  - type: extract_metric
    metadata: '{"id":"_rK4ucX4G8oDcrXWwXh2r","type":"extract_metric","name":"Extract
      Metric"}'
    extract_metric_rules:
    - name: status_code
      description: A count of each unique status code
      unit: "1"
      gauge:
        value: attributes["status"]
Example Output
This results in metrics such as the following:
{
  "_type": "metric",
  "timestamp": 1744875106543,
  "resource": {
    ...
  },
  "attributes": {
    "level": "Info",
    "msg": "processing succeeded",
    "request": {
      "ip": "10.192.49.15",
      "method": "GET",
      "path": "/json/view"
    },
    "response_time_ms": 255,
    "status": 200,
    "timestamp": "2025-04-17T07:31:43.684354Z",
    "user": {
      "email": "jane.smith@demomail.com",
      "id": "110abee8-d4e5-4a80-8984-54dc1c04930f",
      "name": "7b982abe-a8fe-4429-9c8f-30e3692f8caa"
    }
  },
  "description": "A count of each unique status code",
  "gauge": {
    "value": 200
  },
  "kind": "gauge",
  "name": "status_code",
  "unit": "1",
  "_stat_type": "value"
}
Note how the attributes have been adopted from the parent log. This will be useful for later aggregation with dimension groups, for example, using the aggregate metric processor.
Apache Web Server Example
A practical application of log-to-metrics is monitoring web server health without deploying separate metrics agents. Apache access logs contain valuable metrics like response codes, request counts, and response times that can be extracted for monitoring and alerting.
Consider a standard Apache access log entry that has been ingested and parsed into structured attributes:
{
  "_type": "log",
  "timestamp": 1744965983285,
  "body": "10.0.0.1 - - [18/Apr/2025:08:46:21 +0000] \"GET /api/users HTTP/1.1\" 200 2326 \"https://example.com\" \"Mozilla/5.0\"",
  "attributes": {
    "client_ip": "10.0.0.1",
    "request_method": "GET",
    "request_path": "/api/users",
    "response_code": 200,
    "response_size": 2326,
    "referrer": "https://example.com",
    "user_agent": "Mozilla/5.0"
  }
}
To extract metrics from Apache logs, configure the extract metric processor to generate multiple metrics from each log entry. This configuration creates both response code counts and response size metrics:
- type: extract_metric
  metadata: '{"name":"Apache Metrics Extraction"}'
  extract_metric_rules:
  - name: apache_response_codes
    description: Count of HTTP response codes from Apache
    unit: "1"
    gauge:
      value: attributes["response_code"]
    condition: attributes["response_code"] != nil

  - name: apache_response_size
    description: Response size in bytes from Apache
    unit: "By"
    gauge:
      value: attributes["response_size"]
    condition: attributes["response_size"] != nil
The extracted metrics retain the original log attributes, enabling dimensional analysis. You can group these metrics by request_path to identify high-traffic endpoints, by response_code to monitor error rates, or by client_ip to track per-client usage patterns.
For production deployments, combine this with the Aggregate Metric processor to create time-windowed summaries. For example, aggregate response codes per minute grouped by path to identify endpoints experiencing errors, or calculate average response sizes per endpoint to detect performance degradation.
This log-to-metrics approach provides APM-like visibility into your Apache servers without additional agent deployments, reducing infrastructure complexity while maintaining comprehensive observability.
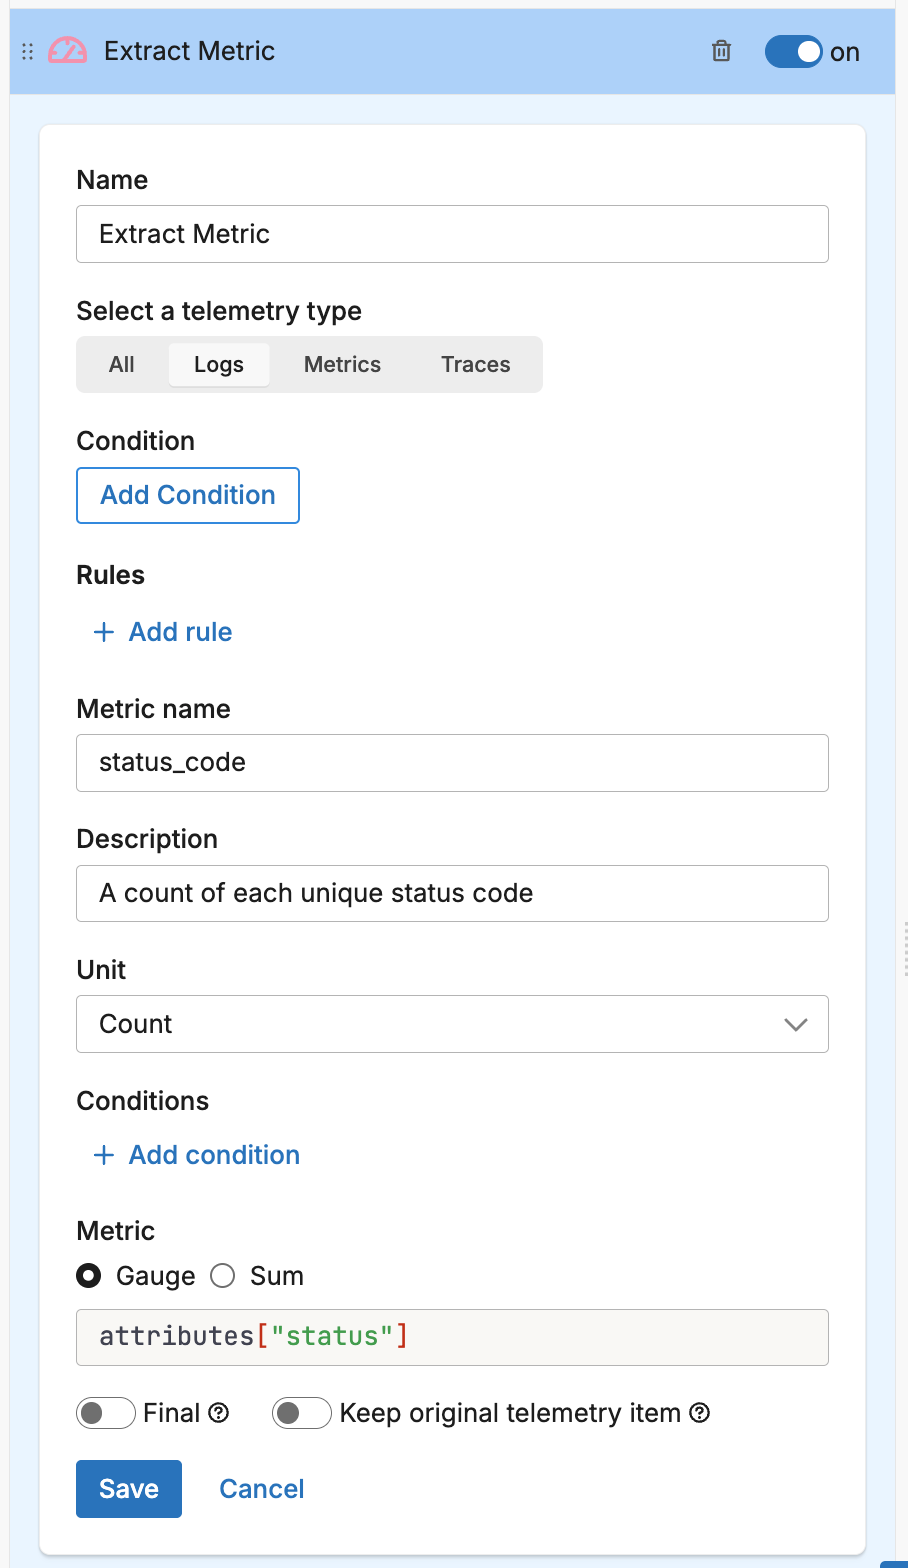
Options
Select a telemetry type
You can specify, log, metric, trace or all. It is specified using the interface, which generates a YAML list item for you under the data_types parameter. This defines the data item types against which the processor must operate. If data_types is not specified, the default value is all. It is optional.
It is defined in YAML as follows:
- name: multiprocessor
  type: sequence
  processors:
  - type: <processor type>
    data_types:
    - log
Condition
The condition parameter contains a conditional phrase of an OTTL statement. It restricts operation of the processor to only data items where the condition is met. Those data items that do not match the condition are passed without processing. You configure it in the interface and an OTTL condition is generated. It is optional.
Important: All conditions must be written on a single line in YAML. Multi-line conditions are not supported.
Comparison Operators
| Operator | Name | Description | Example |
|---|---|---|---|
== | Equal to | Returns true if both values are exactly the same | attributes["status"] == "OK" |
!= | Not equal to | Returns true if the values are not the same | attributes["level"] != "debug" |
> | Greater than | Returns true if the left value is greater than the right | attributes["duration_ms"] > 1000 |
>= | Greater than or equal | Returns true if the left value is greater than or equal to the right | attributes["score"] >= 90 |
< | Less than | Returns true if the left value is less than the right | attributes["load"] < 0.75 |
<= | Less than or equal | Returns true if the left value is less than or equal to the right | attributes["retries"] <= 3 |
matches | Regex match | Returns true if the string matches a regular expression (generates IsMatch function) | IsMatch(attributes["name"], ".*\\.log$") |
Logical Operators
Important: Use lowercase and, or, not - uppercase operators will cause errors!
| Operator | Description | Example |
|---|---|---|
and | Both conditions must be true | attributes["level"] == "ERROR" and attributes["status"] >= 500 |
or | At least one condition must be true | attributes["log_type"] == "TRAFFIC" or attributes["log_type"] == "THREAT" |
not | Negates the condition | not IsMatch(attributes["path"], "^/health") |
Functions
| Function | Description | Example |
|---|---|---|
IsMatch | Returns true if string matches the regex pattern | IsMatch(attributes["message"], "ERROR\|FATAL") |
Field Existence Checks
| Check | Description | Example |
|---|---|---|
!= nil | Field exists (not null) | attributes["user_id"] != nil |
== nil | Field doesn’t exist | attributes["optional_field"] == nil |
!= "" | Field is not empty string | attributes["message"] != "" |
Common Examples
- name: _multiprocessor
  type: sequence
  processors:
  - type: <processor type>
    # Simple equality check
    condition: attributes["request"]["path"] == "/json/view"

  - type: <processor type>
    # Multiple values with OR
    condition: attributes["log_type"] == "TRAFFIC" or attributes["log_type"] == "THREAT"

  - type: <processor type>
    # Excluding multiple values (NOT equal to multiple values)
    condition: attributes["log_type"] != "TRAFFIC" and attributes["log_type"] != "THREAT"

  - type: <processor type>
    # Complex condition with AND/OR/NOT
    condition: (attributes["level"] == "ERROR" or attributes["level"] == "FATAL") and attributes["env"] != "test"

  - type: <processor type>
    # Field existence and value check
    condition: attributes["user_id"] != nil and attributes["user_id"] != ""

  - type: <processor type>
    # Regex matching on attributes
    condition: IsMatch(attributes["path"], "^/api/") and not IsMatch(attributes["path"], "^/api/health")

  - type: <processor type>
    # Regex matching on body (case-insensitive)
    condition: IsMatch(body, "(?i)error")
Common Mistakes to Avoid
# WRONG - Cannot use OR/AND with values directly
condition: attributes["log_type"] != "TRAFFIC" OR "THREAT"

# CORRECT - Must repeat the full comparison
condition: attributes["log_type"] != "TRAFFIC" and attributes["log_type"] != "THREAT"

# WRONG - Uppercase operators
condition: attributes["status"] == "error" AND attributes["level"] == "critical"

# CORRECT - Lowercase operators
condition: attributes["status"] == "error" and attributes["level"] == "critical"

# WRONG - Multi-line conditions
condition: |
  attributes["level"] == "ERROR" and
  attributes["status"] >= 500

# CORRECT - Single line (even if long)
condition: attributes["level"] == "ERROR" and attributes["status"] >= 500
Add Rule
Click to add additional metrics to extract. One metric is generated for each rule per data item.
Metric Name
Define a name for the metric.
Description
Provide a description for the metric. This is added to the metric item in the description field.
Unit
Select Count or Bytes as the unit of measurement.
Conditions
The conditions parameter is a child of the metric definition. It contains a conditional phrase of an OTTL statement. It restricts operation of the processor to only data items where the condition is met, for the parent metric. This is different to the condition parameter which toggles the entire processor. Those data items that do not match the condition are passed without a metric being generated (other metrics in the same processor might still be created). It is specified by the tool as an OTTL condition when you select the condition fields in the interface and it is optional.
It is defined in YAML as follows:
- name: _multiprocessor
  type: sequence
  processors:
  - type: <processor type>
    aggregate_metric_rules:
    - name: <metric name>
      conditions:
      - attributes["level"] = Error
Metric
Specify which target field to use as the metric in this section. You specify the OTTL path and if necessary convert the data type with the OTTL convertor. You should convert it into a double (Double(attributes["status"])).
Note: The extract metric processor can consume doubles or integers.
You also specify the metric type:
- Gauge: A gauge is a metric that represents a value at a single point in time. It can go up or down. For example, CPU usage (e.g., 57%), memory usage, number of active sessions. Think of it like a speedometer, it shows the current value, not an accumulation over time.
- Sum: A sum represents a total or accumulated value over time. It’s used to track things that only go up (usually), such as total requests served, bytes sent, etc. When defining a sum, you can further specify how it’s recorded:
- Cumulative: A cumulative sum is an ever-increasing counter (unless reset). Each new value includes all previous values. For example, a web server might report a cumulative total of bytes sent (e.g., 1000 → 2000 → 3000). It is useful for tracking long-term totals, and systems can compute rates from this.
- Delta: A delta sum represents the change in value since the last report. Each value is independent and represents a slice in time. For example, if 500 bytes were sent in the last 5 seconds, the log reports 500. This is easier to process directly when you just want the change in a given period.
- Monotonic: This is a flag that applies to a sum. A monotonic sum means the value should never decrease, only stay the same or increase. If a drop is observed, it may indicate a reset or error. For example if bytes sent goes from 2000 to 1500, and it’s marked as monotonic, the system will treat this as a reset.
Final
Determines whether successfully processed data items should continue through the remaining processors in the same processor stack. If final is set to true, data items output by this processor are not passed to subsequent processors within the node—they are instead emitted to downstream nodes in the pipeline (e.g., a destination). Failed items are always passed to the next processor, regardless of this setting.
The UI provides a slider to configure this setting. The default is false. It is defined in YAML as follows:
- name: multiprocessor
  type: sequence
  processors:
    - type: <processor type>
    final: true
Keep original telemetry item
Controls whether the original, unmodified telemetry item is preserved after processing. If keep_item is set to true, the processor emits both:
- The original telemetry item (e.g., a log), and
- Any new item generated by the processor (e.g., a metric extracted from the log)
Both items are passed to the next processor in the stack unless final is also set.
Interaction with final
If final: true is enabled, any successfully processed data items, whether original, newly created, or both, exit the processor stack or node immediately. No subsequent processors within the same node are evaluated, although downstream processing elsewhere in the pipeline continues. This means:
- If
keep_item: trueandfinal: true, both the original and processed items bypass the remaining processors in the current node and are forwarded to downstream nodes (such as destinations). - If
keep_item: falseandfinal: true, only the processed item continues beyond this processor, skipping subsequent processors in the stack, and the original item is discarded.
Note: If the data item fails to be processed, final has no effect, the item continues through the remaining processors in the node regardless of the keep_item setting.
The app provides a slider to configure keep_item. The default is false.
- name: ed_gateway_output_a3fa_multiprocessor
  type: sequence
  processors:
    - type: <processor_type>
      keep_item: true
      final: true
Configuration Wizard
Use this interactive wizard to generate a starter configuration:
What type of metric do you want to extract?
Choose between gauge and sum metric types.
See Also
- For an overview and to understand processor sequence flow, see Processors Overview
- To learn how to configure a processor, see Configure a Processor.
- For optimization strategies, see Best Practices for Edge Delta Processors.
- If you’re new to pipelines, start with the Pipeline Quickstart Overview or learn how to Configure a Pipeline.
- Looking to understand how processors interact with sources and destinations? Visit the Pipeline Overview.