File Connector
Configure the File connector to monitor and collect log data from files and directories for analysis by AI teammates.
10 minute read
Overview
The File connector monitors and collects log data from files and directories on hosts where Edge Delta agents are deployed. It tails log files, watches for new files matching patterns, and streams content into Edge Delta Pipelines for analysis by AI teammates through the Edge Delta MCP connector.
When you add this streaming connector, it appears as a File source in your selected pipeline. AI teammates access this data by querying the Edge Delta backend with the Edge Delta MCP connector.
Add the File Connector
To add the File connector, you specify file paths or glob patterns to monitor, then deploy to an environment.
Prerequisites
Before configuring the connector, ensure you have:
- Edge Delta agent deployed with read access to log files
- Log files or directories accessible from the agent host
- File paths or glob patterns identified for monitoring
Configuration Steps
- Navigate to AI Team > Connectors in the Edge Delta application
- Find the File connector in Streaming Connectors
- Click the connector card
- Configure the Path with file location or glob pattern
- Optionally add File Exclude patterns
- Select a target environment
- Click Save
The connector is now monitoring files and streaming content.
Configuration Options
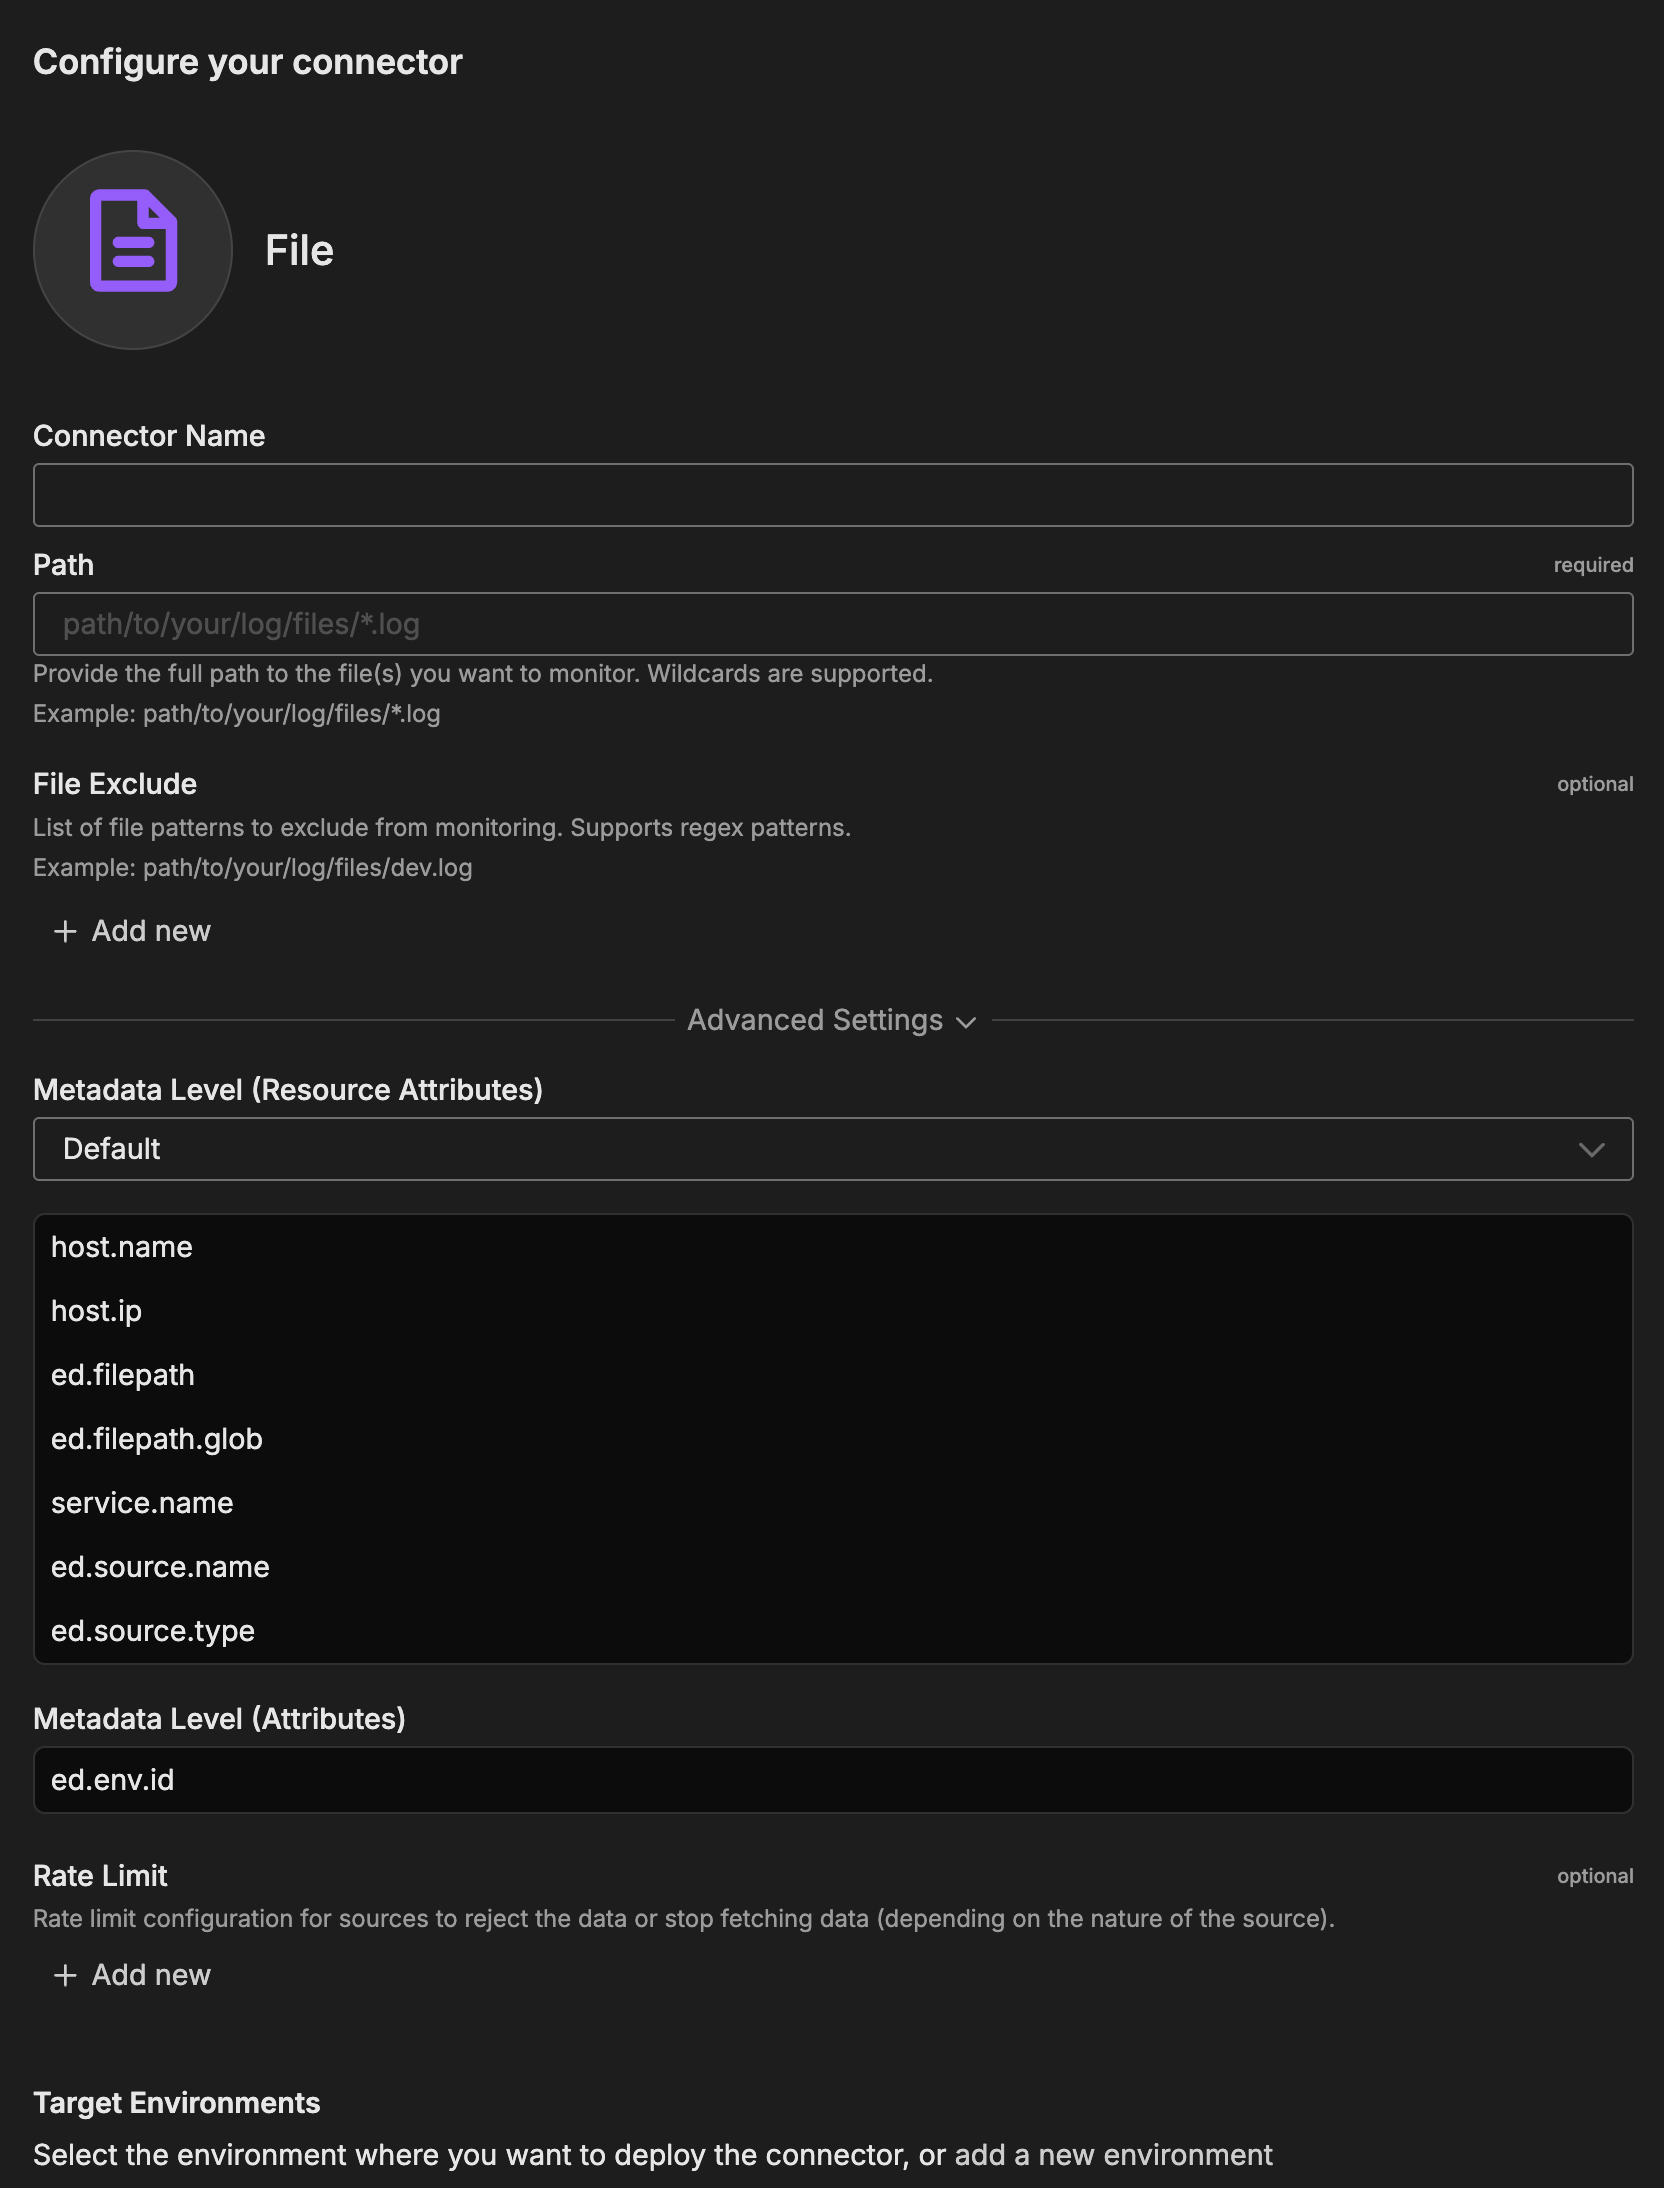
Connector Name
Name to identify this File connector instance.
Path
Full path to the file(s) to monitor. Supports wildcards and glob patterns for matching multiple files.
Format: Absolute or relative path with optional wildcards
Examples:
path/to/your/log/files/*.log- All .log files in directory/var/log/application/*.log- Absolute path with wildcard/var/log/nginx/access.log- Specific file/var/log/**/error.log- Recursive pattern matching
File Exclude
Optional list of file patterns to exclude from monitoring. Supports regex patterns to filter out unwanted files.
Format: File path or regex pattern
Examples:
path/to/your/log/files/dev.log- Exclude specific file.*\.gz- Exclude compressed files.*/archive/.*- Exclude archive directories
Advanced Settings
Metadata Level
This option is used to define which detected resources and attributes to add to each data item as it is ingested by Edge Delta. You can select:
- Required Only: This option includes the minimum required resources and attributes for Edge Delta to operate.
- Default: This option includes the required resources and attributes plus those selected by Edge Delta
- High: This option includes the required resources and attributes along with a larger selection of common optional fields.
- Custom: With this option selected, you can choose which attributes and resources to include. The required fields are selected by default and can’t be unchecked.
Based on your selection in the GUI, the source_metadata YAML is populated as two dictionaries (resource_attributes and attributes) with Boolean values.
See Choose Data Item Metadata for more information on selecting metadata.
File-specific metadata included:
ed.filepath- Full path to the file being monitoreded.filepath.glob- Glob pattern used to match the file
Rate Limit
The rate_limit parameter enables you to control data ingestion based on system resource usage. This advanced setting helps prevent source nodes from overwhelming the agent by automatically throttling or stopping data collection when CPU or memory thresholds are exceeded.
Use rate limiting to prevent runaway log collection from overwhelming the agent in high-volume sources, protect agent stability in resource-constrained environments with limited CPU/memory, automatically throttle during bursty traffic patterns, and ensure fair resource allocation across source nodes in multi-tenant deployments.
When rate limiting triggers, pull-based sources (File, S3, HTTP Pull) stop fetching new data, push-based sources (HTTP, TCP, UDP, OTLP) reject incoming data, and stream-based sources (Kafka, Pub/Sub) pause consumption. Rate limiting operates at the source node level, where each source with rate limiting enabled independently monitors and enforces its own thresholds.
Rate limiting vs backpressure: Rate limiting and backpressure are different mechanisms. Rate limiting controls data ingestion at the source based on CPU or memory thresholds. Backpressure controls data output at the destination when in-memory queues fill up. Backpressure logs such as
backpressure: dataCh at 92% capacitydo not appear when rate limiting triggers, and rate limiting logs do not appear during backpressure events.
Observability: When rate limiting is active in enforce mode, the agent does not produce INFO, WARN, or ERROR level logs. To confirm that rate limiting is triggering, check the source node’s Bytes I/O metrics in the Edge Delta app for gaps or drops that coincide with expected throttling periods.
Configuration Steps:
- Click Add New in the Rate Limit section
- Click Add New for Evaluation Policy
- Select Policy Type:
- CPU Usage: Monitors CPU consumption and rate limits when usage exceeds defined thresholds. Use for CPU-intensive sources like file parsing or complex transformations.
- Memory Usage: Monitors memory consumption and rate limits when usage exceeds defined thresholds. Use for memory-intensive sources like large message buffers or caching.
- AND (composite): Combines multiple sub-policies with AND logic. All sub-policies must be true simultaneously to trigger rate limiting. Use when you want conservative rate limiting (both CPU and memory must be high).
- OR (composite): Combines multiple sub-policies with OR logic. Any sub-policy can trigger rate limiting. Use when you want aggressive rate limiting (either CPU or memory being high triggers).
- Select Evaluation Mode. Choose how the policy behaves when thresholds are exceeded:
- Enforce (default): Actively applies rate limiting when thresholds are met. Pull-based sources (File, S3, HTTP Pull) stop fetching new data, push-based sources (HTTP, TCP, UDP, OTLP) reject incoming data, and stream-based sources (Kafka, Pub/Sub) pause consumption. Use in production to protect agent resources.
- Monitor: Logs when rate limiting would occur without actually limiting data flow. Use for testing thresholds before enforcing them in production.
- Passthrough: Disables rate limiting entirely while keeping the configuration in place. Use to temporarily disable rate limiting without removing configuration.
- Set Absolute Limits and Relative Limits (for CPU Usage and Memory Usage policies)
Note: If you specify both absolute and relative limits, the system evaluates both conditions and rate limiting triggers when either condition is met (OR logic). For example, if you set absolute limit to
1.0CPU cores and relative limit to50%, rate limiting triggers when the source uses either 1 full core OR 50% of available CPU, whichever happens first.
For CPU Absolute Limits: Enter value in full core units:
0.1= one-tenth of a CPU core0.5= half a CPU core1.0= one full CPU core2.0= two full CPU cores
For CPU Relative Limits: Enter percentage of total available CPU (0-100):
50= 50% of available CPU75= 75% of available CPU85= 85% of available CPU
For Memory Absolute Limits: Enter value in bytes
104857600= 100Mi (100 × 1024 × 1024)536870912= 512Mi (512 × 1024 × 1024)1073741824= 1Gi (1 × 1024 × 1024 × 1024)
For Memory Relative Limits: Enter percentage of total available memory (0-100)
60= 60% of available memory75= 75% of available memory80= 80% of available memory
- Set Refresh Interval (for CPU Usage and Memory Usage policies). Specify how frequently the system checks resource usage:
- Recommended Values:
10sto30sfor most use cases5sto10sfor high-volume sources requiring quick response1mor higher for stable, low-volume sources
The system fetches current CPU/memory usage at the specified refresh interval and uses that value for evaluation until the next refresh. Shorter intervals provide more responsive rate limiting but incur slightly higher overhead, while longer intervals are more efficient but slower to react to sudden resource spikes.
The GUI generates YAML as follows:
# Simple CPU-based rate limiting
nodes:
  - name: <node name>
    type: <node type>
    rate_limit:
      evaluation_policy:
        policy_type: cpu_usage
        evaluation_mode: enforce
        absolute_limit: 0.5  # Limit to half a CPU core
        refresh_interval: 10s
# Simple memory-based rate limiting
nodes:
  - name: <node name>
    type: <node type>
    rate_limit:
      evaluation_policy:
        policy_type: memory_usage
        evaluation_mode: enforce
        absolute_limit: 536870912  # 512Mi in bytes
        refresh_interval: 30s
Composite Policies (AND / OR)
When using AND or OR policy types, you define sub-policies instead of limits. Sub-policies must be siblings (at the same level)—do not nest sub-policies within other sub-policies. Each sub-policy is independently evaluated, and the parent policy’s evaluation mode applies to the composite result.
- AND Logic: All sub-policies must evaluate to true at the same time to trigger rate limiting. Use when you want conservative rate limiting (limit only when CPU AND memory are both high).
- OR Logic: Any sub-policy evaluating to true triggers rate limiting. Use when you want aggressive protection (limit when either CPU OR memory is high).
Configuration Steps:
- Select AND (composite) or OR (composite) as the Policy Type
- Choose the Evaluation Mode (typically Enforce)
- Click Add New under Sub-Policies to add the first condition
- Configure the first sub-policy by selecting policy type (CPU Usage or Memory Usage), selecting evaluation mode, setting absolute and/or relative limits, and setting refresh interval
- In the parent policy (not within the child), click Add New again to add a sibling sub-policy
- Configure additional sub-policies following the same pattern
The GUI generates YAML as follows:
# AND composite policy - both CPU AND memory must exceed limits
nodes:
  - name: <node name>
    type: <node type>
    rate_limit:
      evaluation_policy:
        policy_type: and
        evaluation_mode: enforce
        sub_policies:
          # First sub-policy (sibling)
          - policy_type: cpu_usage
            evaluation_mode: enforce
            absolute_limit: 0.75  # Limit to 75% of one core
            refresh_interval: 15s
          # Second sub-policy (sibling)
          - policy_type: memory_usage
            evaluation_mode: enforce
            absolute_limit: 1073741824  # 1Gi in bytes
            refresh_interval: 15s
# OR composite policy - either CPU OR memory can trigger
nodes:
  - name: <node name>
    type: <node type>
    rate_limit:
      evaluation_policy:
        policy_type: or
        evaluation_mode: enforce
        sub_policies:
          - policy_type: cpu_usage
            evaluation_mode: enforce
            relative_limit: 85  # 85% of available CPU
            refresh_interval: 20s
          - policy_type: memory_usage
            evaluation_mode: enforce
            relative_limit: 80  # 80% of available memory
            refresh_interval: 20s
# Monitor mode for testing thresholds
nodes:
  - name: <node name>
    type: <node type>
    rate_limit:
      evaluation_policy:
        policy_type: memory_usage
        evaluation_mode: monitor  # Only logs, doesn't limit
        relative_limit: 70  # Test at 70% before enforcing
        refresh_interval: 30s
Target Environments
Select the Edge Delta pipeline (environment) where you want to deploy this connector.
How to Use the File Connector
The File connector integrates seamlessly with AI Team, enabling analysis of log data from files across your infrastructure. AI teammates automatically leverage the ingested data based on the queries they receive and the context of the conversation.
Use Case: Application Log Monitoring
Monitor application logs across multiple hosts to track errors, performance issues, and user activity. AI teammates can analyze log patterns, identify error spikes, and correlate issues across application instances. When combined with PagerDuty alerts, teammates automatically query recent application logs during incident investigation to identify root causes.
Configuration: Path: /var/log/application/*.log, File Exclude: /var/log/application/debug.log
Use Case: Web Server Access Log Analysis
Collect access logs from web servers like Nginx or Apache to analyze traffic patterns, identify suspicious activity, and track performance metrics. AI teammates can detect anomalies in request patterns, identify bot traffic, and analyze endpoint performance across your server fleet.
Configuration: Path: /var/log/nginx/access.log*, File Exclude: /var/log/nginx/access.log.*.gz (exclude rotated compressed logs)
Use Case: System Log Aggregation
Gather system logs from critical infrastructure components to monitor system health, track configuration changes, and identify security events. AI teammates analyze syslog data to detect authentication failures, system errors, and resource warnings, providing proactive infrastructure monitoring.
Configuration: Path: /var/log/syslog, File Exclude: /var/log/syslog.*.gz
Troubleshooting
No logs appearing: Verify file paths are correct and files exist (ls /var/log/application/*.log). Check Edge Delta agent has read permissions (ls -l /path/to/logfile).
Permission denied errors: Ensure Edge Delta agent user can read the files. Adjust file permissions if needed (chmod 644 /path/to/logfile).
Missing some log files: Check glob patterns match expected files. Verify exclude patterns aren’t filtering out desired files.
Duplicate log entries: Check that exclude patterns filter out rotated/compressed files (*.gz, *.bz2). Ensure no multiple connectors monitoring same files.
Rotated logs not detected: Connector follows active log files. Use glob patterns to match rotated files (e.g., /var/log/app.log*).
High memory usage: Limit the number of files monitored. Use exclude patterns to filter out unnecessary files. Adjust rate limiting settings.
Next Steps
- Learn about creating custom teammates that can use log data
- Explore the Edge Delta MCP connector for querying log data
For additional help, visit AI Team Support.