Edge Delta Architecture
11 minute read
Architectural Overview
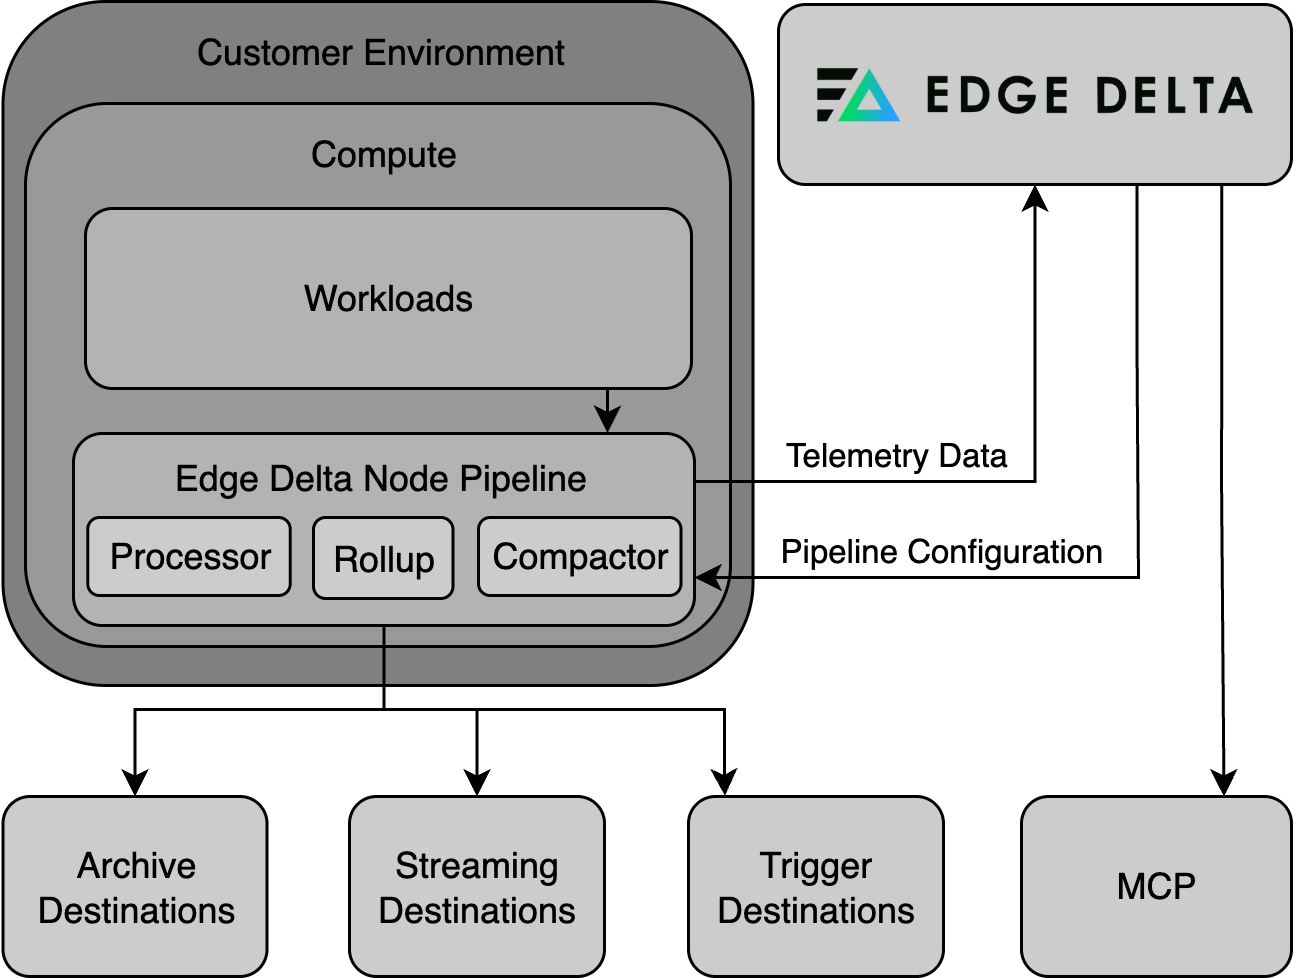
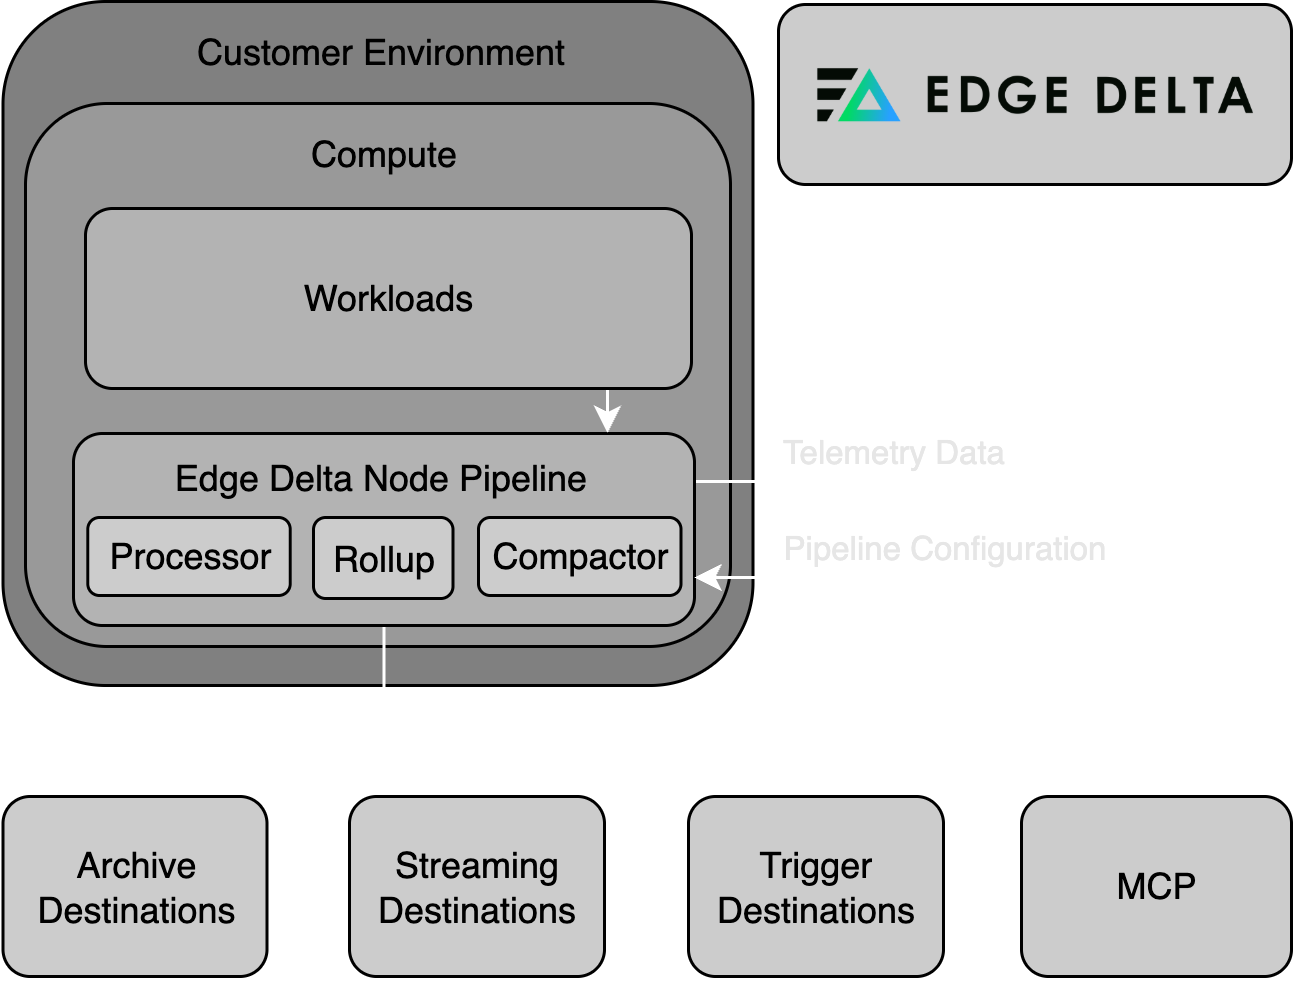
Edge Delta provides a modular telemetry processing system made up of pipelines and agents that work across Kubernetes and non-Kubernetes environments, including Linux, Docker, Amazon ECS, macOS, Windows, and more. Its architecture is designed to optimize observability and security data workflows with flexibility, scalability, and operational clarity.
Core Components
Agents and Integrations
Edge Delta deploys lightweight agents within a wide variety of environments such as Kubernetes, Linux, Docker, ECS, macOS, Windows, and OpenShift. It also supports SELinux-enforced clusters. These agents collect telemetry data from a variety of sources including infrastructure, applications, and cloud-native services. Optionally, Cloud Pipeline integrations allow for ingestion from agentless, serverless, or third party agents without the need to deploy Edge Delta agents in every environment.
Processing Pipelines
A pipeline in Edge Delta is a collection of agents that share a common configuration. You configure the pipeline, and it governs how telemetry data is parsed, filtered, enriched, and routed by all associated agents. Processing occurs within agents and includes metric extraction, anomaly detection, and pattern recognition — all in near real time. This ensures that only relevant and optimized data is forwarded.
Note: Deploy only one pipeline per host or cluster. Installing multiple pipelines on the same host causes duplicate data collection, increased resource consumption, and potential conflicts. If you need to process different data sources differently, configure multiple source nodes within a single pipeline rather than deploying separate pipelines.
Destinations
Data is routed to one or more destinations for storage, alerting, or further analysis. These include observability platforms, SIEM tools, object stores like Amazon S3, and Edge Delta’s own Observability Platform.
Pipeline Types
Node Pipeline
A Node Pipeline is deployed per cluster and runs agents on each node in a Kubernetes environment. These agents collect and process telemetry data locally, standardize it on open formats like OpenTelemetry and OCSF, extract insights, compress data, and generate alerts in real time. The data is then sent to the configured outputs such as third-party tools or to Edge Delta.
Node pipelines run as DaemonSets in Kubernetes, deploying one agent per node. They excel at collecting node-local data:
- Container logs from
/var/log - Host-level metrics
- Kubernetes events
- eBPF-based traces and service maps
Edge Delta supports multiple types of agents:
- Processing Agent: Executes the pipeline logic.
- Compactor Agent: Compresses and encodes telemetry data into efficient formats.
- Rollup Agent: Aggregates metric data to reduce frequency and cardinality, improving performance and reducing storage needs.
Gateway Pipeline
A Gateway Pipeline is a shared pipeline that provides centralized aggregation and advanced processing in Kubernetes clusters. It collects telemetry data from Node Pipelines and external sources, performing service-level metric aggregation, log deduplication, and trace tail sampling. The Gateway sees the full picture of incoming telemetry data, making it ideal for holistic processing.
Gateway pipelines run as Deployments that scale horizontally based on load. They serve as centralized aggregation points for:
- Receiving data from multiple node pipelines
- Collecting telemetry from OTLP collectors and third-party agents
- Performing cross-source operations like deduplication
- Enabling trace tail sampling with full trace context
- Calculating service-level metrics
It is typically deployed as a set of scalable agents and connected to Node Pipelines through dedicated input/output configurations.
When to use Gateway Pipelines for third-party agents: When ingesting telemetry from OTLP collectors or other third-party agents, send data directly to a gateway pipeline rather than routing through node pipelines. This avoids unnecessary hops and enables trace correlation. See Routing Third-Party Agents to Gateway Pipelines.
Coordinator Pipeline
The Coordinator Pipeline is a control component of the pipeline that manages backend communication and agent coordination within a cluster. Deployed as a singleton in each Kubernetes cluster, it manages communication between Edge Delta agents and the Observability Platform, reducing overhead in large environments. It handles tasks like discovery, agent grouping, and live capture coordination.
Coordinator pipelines:
- Handle backend communication on behalf of node agents
- Manage heartbeats and control messages
- Perform leader election for processor agents
- Coordinate live capture across multiple nodes
A coordinator is required for live tail to work in clusters with more than 20 nodes. For smaller clusters, a coordinator is optional but recommended for production deployments—it reduces backend overhead and improves live capture coverage across nodes.
Node Pipelines collect telemetry data at the source, Gateway Pipelines aggregate and process it at the cluster level, and Coordinator Pipelines manage environment-wide agent communication and control — together forming a robust foundation for efficient telemetry operations at scale.
With them, teams can intelligently collect, process, and route telemetry data to filter out noise and preserve high-value signals, reducing telemetry costs and enhancing downstream analysis.
Cloud Pipelines (Agentless Option)
Edge Delta also offers cloud-hosted pipelines that do not require teams to deploy agents into their infrastructure. These are ideal for serverless workloads (e.g., AWS Lambda), streaming platforms (e.g., Amazon Kinesis), IoT systems, or environments with tight security or resource constraints.
You can push telemetry data to Cloud Pipelines using HTTP, HTTPS, or gRPC, or configure them to pull data using supported source nodes like HTTP Pull. For third-party agent integration options, see Third Party Agents or Agentless.
This deployment model is fully managed by Edge Delta and requires no additional infrastructure provisioning on your side. For troubleshooting Cloud Pipelines, see Troubleshoot Cloud Pipelines.
Note: Gateway and Coordinator Pipelines are currently only supported within Kubernetes environments.
Choosing Pipeline Types
Use this decision matrix to select the right pipeline type:
| Data Source | Recommended Pipeline | Reason |
|---|---|---|
| Container logs | Node Pipeline | Data is node-local |
| Host metrics | Node Pipeline | Data is node-local |
| Kubernetes events | Node Pipeline | Collected via K8s API |
| OTLP collectors | Gateway Pipeline | Pushed telemetry, needs aggregation |
| Third-party agents | Gateway Pipeline | Pushed telemetry, needs aggregation |
| Distributed traces | Gateway Pipeline | Requires full trace context for tail sampling |
| Service-level metrics | Gateway Pipeline | Requires cross-node visibility |
| Serverless functions (AWS Lambda) | Cloud Pipeline | Agentless, no infrastructure to deploy |
| Streaming platforms (Kinesis, Pub/Sub) | Cloud Pipeline | Cloud-hosted ingestion |
| IoT or constrained environments | Cloud Pipeline | Cannot deploy agents |
Cluster Name Assignment
The Kubernetes Cluster Name you specify when creating pipelines provides logical grouping in the UI. Pipelines sharing the same cluster name appear together in the Pipelines table when grouped by cluster.
When node and gateway pipelines share the same cluster name, the gateway automatically appears in the dropdown list when configuring the Gateway Connection destination, simplifying integration.
Deployment Patterns
Edge Delta supports deployment patterns ranging from single-node setups to global multi-region architectures. Each pattern combines pipeline types to match your infrastructure scale and operational requirements.
| Pattern | Pipelines Used | Best For |
|---|---|---|
| Single Node | Node only | POC, dev sandboxes, k3s, lightweight VMs |
| Multi-Node Cluster | Node + Coordinator | Production clusters needing centralized control and live capture |
| Shared Platform | Node + Coordinator + Gateway | Multi-team clusters requiring deduplication and cluster-wide metrics |
| Multi-Cluster | Node per cluster + shared Gateway | Branch offices, retail sites, edge locations with central aggregation |
| Global Multi-Region | Node + Coordinator per region + regional/global Gateway | Geographic distribution with optional regional or global aggregation |
| Hybrid Cloud | Node at edge + cloud Gateway | On-prem clusters syncing to centralized cloud processing |
| High Compliance | Isolated Node + Coordinator + Gateway per environment | Strict isolation between dev, staging, production |
| Multi-Tenant (MSP) | Per-customer Node + Coordinator + centralized multi-tenant Gateway | Service providers managing multiple customer environments |
For detailed diagrams and configuration guidance for each pattern, see Federation with Gateway Pipelines.
Pipeline Organization
Organize your pipelines for clarity and maintainability at scale. Edge Delta provides several mechanisms for managing configuration across multiple clusters and environments.
Organizational Strategies
| Strategy | Approach | Best For |
|---|---|---|
| Packs | Reusable configuration modules shared across pipelines | Common processing logic across environments |
| Metadata Tags | Custom attributes added at deployment time (edCustomTags) | Identifying region, cluster, or stage in telemetry |
| Tag Overrides | Shared configuration with per-cluster naming (edTagOverride) | Same config across clusters with unique pipeline names |
For detailed implementation of each strategy, see Multi-Tenant and Multi-Cluster Deployments.
Configuration Reuse with Packs
Packs allow you to define reusable configuration components:
- Create environment-specific packs (DEV, UAT, PROD) with appropriate processing logic
- Apply packs to multiple pipelines for consistent configuration
- Modify a pack once to propagate changes across all pipelines using it
- Combine with pipeline-specific nodes for regional customization
Pipeline Selection Wizard
Use this wizard to determine the right pipeline architecture for your deployment:
How do you want to send data to Edge Delta?
Choose between installing an agent in your environment or sending data directly to Edge Delta's backend.
Related Documentation
Deployment Strategies
- Multi-Tenant and Multi-Cluster Deployments
- Federation with Gateway Pipelines
- Integrate Node, Coordinator, and Gateway Pipelines
- Edge Delta Pipeline Installation
Operations and Monitoring
- Monitoring and Visibility - Track pipeline health
- Flow Control - Manage data volume dynamically
- Troubleshooting and Diagnostics - Debug pipeline issues
Configuration
- Pipeline Settings - Agent configuration options
- Effective Pipeline Design - Design patterns and best practices