Edge Delta Gateway Connection
20 minute read
Overview
The Gateway Connection Node is designed to send various data types, such as logs, metrics, and traces, to an Edge Delta gateway pipeline. This node supports advanced TLS configurations for secure data transmission.
See:
- Kubernetes Deployment Examples
- Integrate Edge Delta’s Node, Coordinator, and Gateway Pipelines
- Edge Delta Pipeline Source
Note: The ED Gateway destination is available for all OS environment types. For Kubernetes edge pipelines, the gateway appears in an auto-populated dropdown list. For non-Kubernetes OS environments (Linux, Windows), the destination is available but requires manual configuration using DNS or static endpoints (such as via Kubernetes Ingress or NodePort).
This node requires Edge Delta agent version v2.0.0 or higher.
Example Configuration
In this example, the gateway connection node is configured to connect to an in-cluster gateway using its name. This automatically sets the node to use the k8s_service_name of the gateway to handle communication on port 442 using the gRPC protocol.
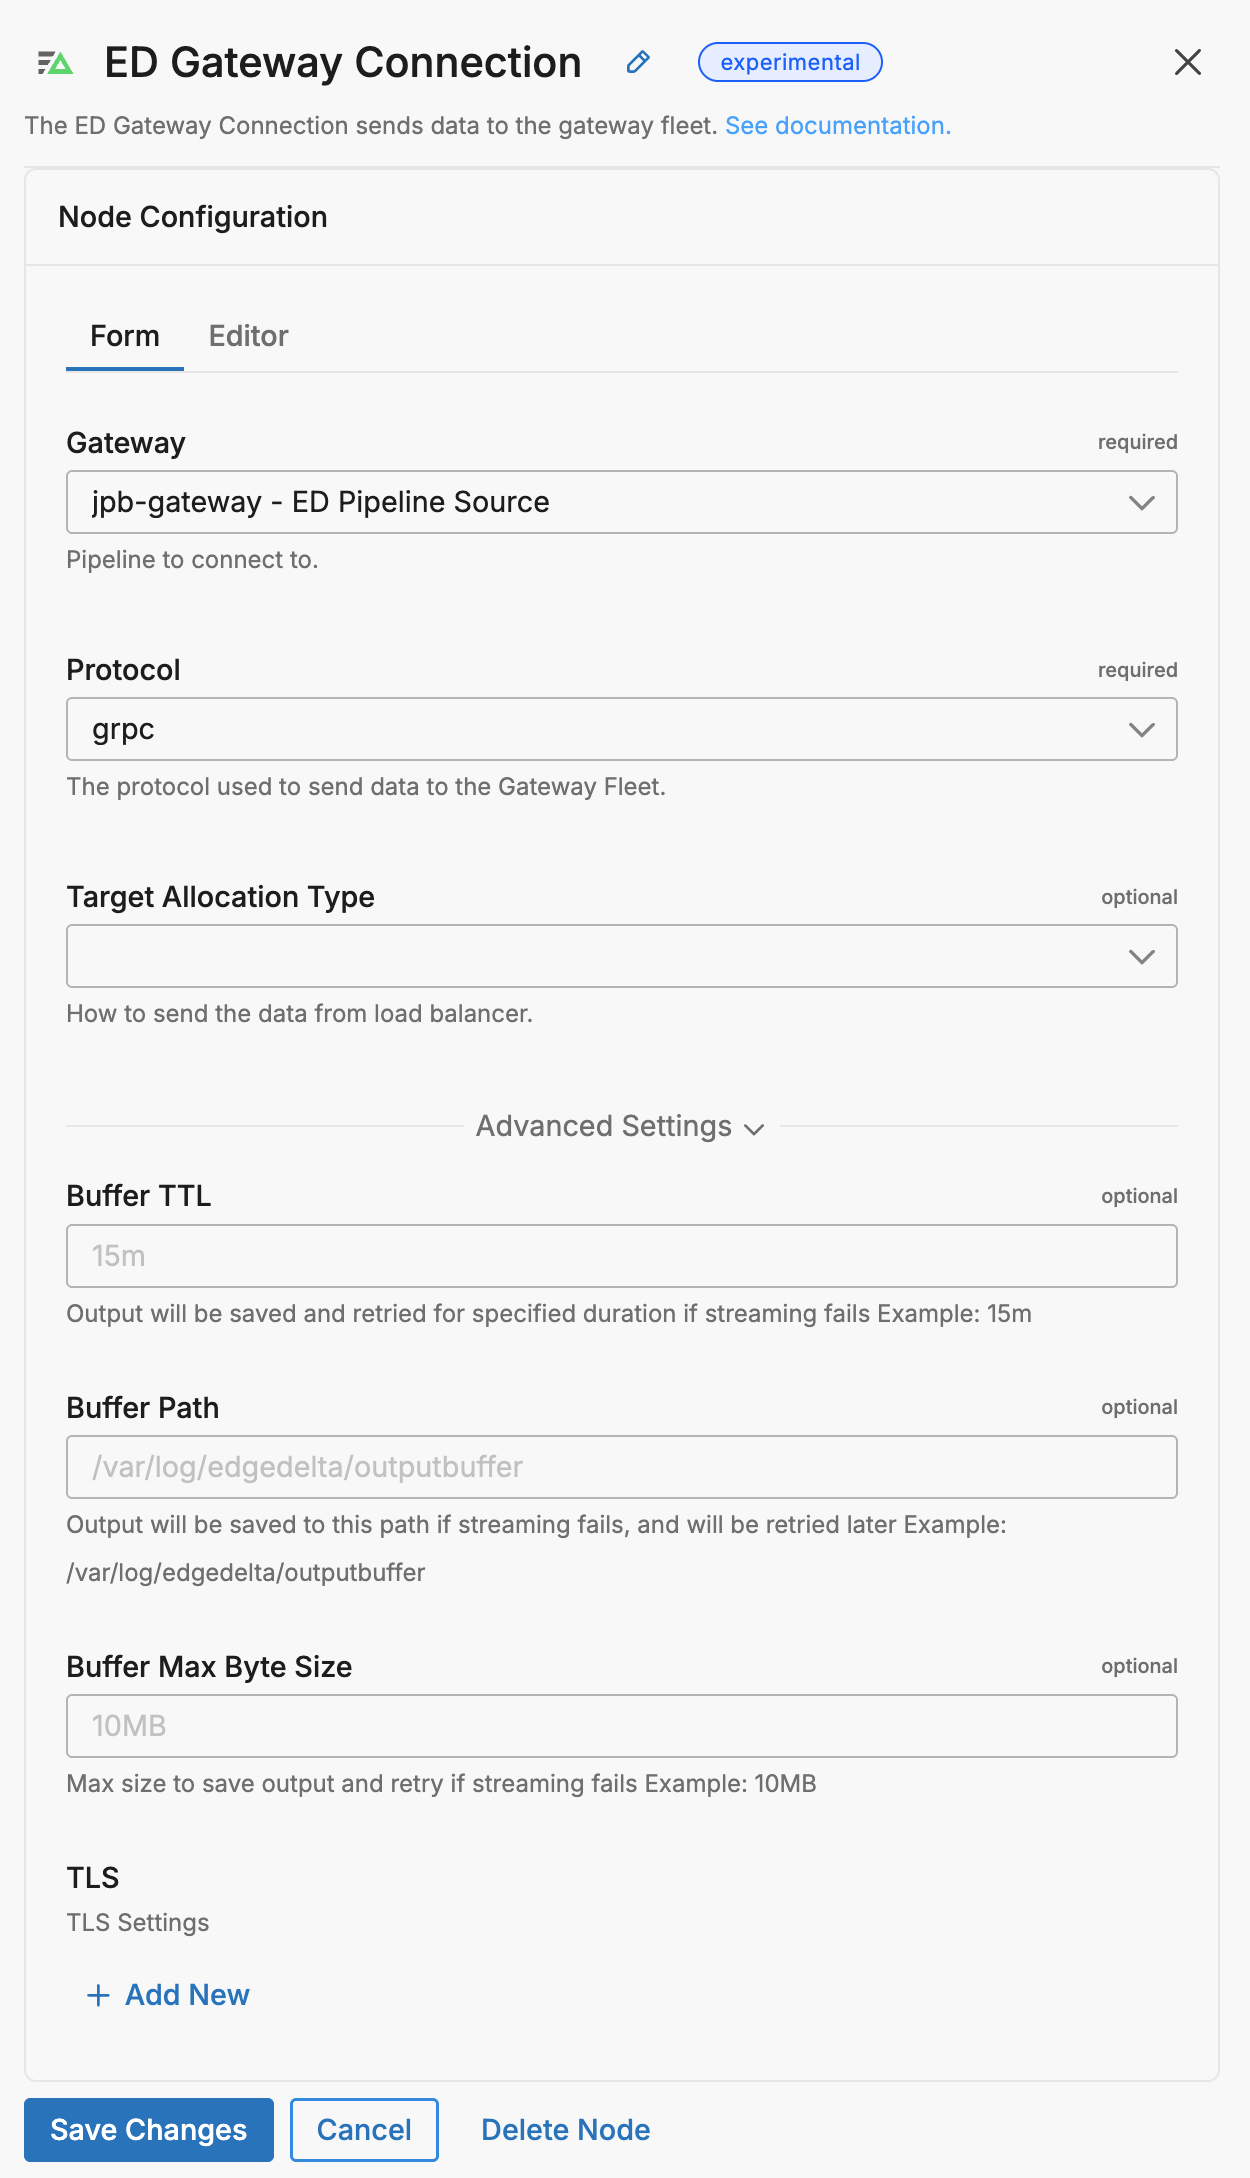
Note: The Gateway option is in the user interface only. It is used to automatically populate the other fields, which appear in the YAML. With this field, you can select the gateway pipeline and node by name, or you can select Custom and specify the integration manually.
nodes:
- name: ed_gateway_output_8e59
  type: ed_gateway_output
  metadata: '{"pipelineId":"a503a449-f54e-4c86-9d55-6a6353cc3f2d","nodeId":"ed_gateway_input_006e"}'
  user_description: ED Gateway Connection
  port: 443
  protocol: grpc
  endpoint_resolution_type: k8s
  k8s_service_name: pd3b496512024855-gw-svc
Required Parameters
name
A descriptive name for the node. This is the name that will appear in pipeline builder and you can reference this node in the YAML using the name. It must be unique across all nodes. It is a YAML list element so it begins with a - and a space followed by the string. It is a required parameter for all nodes.
nodes:
  - name: <node name>
    type: <node type>
type: ed_gateway_output
The type parameter specifies the type of node being configured. It is specified as a string from a closed list of node types. It is a required parameter.
nodes:
  - name: <node name>
    type: <node type>
port
The port parameter specifies the port number to send outgoing data, ranging from 1 to 65535. When a named gateway is selected this defaults to 443. It is only editable when the gateway is set to Custom.
nodes:
- name: ed_gateway_output_8e59
  type: ed_gateway_output
  port: 443
protocol
The protocol parameter specifies the protocol used to send data. It is specified as a string. You must set grpc or http.
nodes:
- name: ed_gateway_output_8e59
  type: ed_gateway_output
  protocol: grpc
endpoint_resolution_type
This parameter specifies how to discover endpoints for the load balancer. Options include k8s, dns, or static. When a named gateway is selected this defaults to k8s.
nodes:
- name: ed_gateway_output_8e59
  type: ed_gateway_output
  endpoint_resolution_type: k8s
hostname
The hostname parameter is applicable only when the Gateway is set to Custom and the endpoint_resolution_type is set to DNS. It specifies the domain name or address of the service or endpoint to which you are sending data. This domain name is what will be translated into an IP address or addresses by a DNS server.
nodes:
  - name: gateway_connection
    type: ed_gateway_output
    endpoint_resolution_type: dns
    hostname: example.hostname.com
endpoints
The endpoints parameter specifies a list of static IP addresses or URLs to which data should be sent. This parameter is available only when the gateway is set to “Custom” and the endpoint_resolution_type is set to “Static”. It allows for direct specification of destination addresses without requiring DNS resolution.
nodes:
  - name: gateway_connection
    type: ed_gateway_output
    gateway_type: custom
    endpoint_resolution_type: static
    endpoints:
      - 192.168.1.10
      - 192.168.1.11
      - https://example.endpoint.com
This parameter is beneficial when you want to ensure that data is routed to fixed addresses, providing a stable route for data transmission without relying on dynamic DNS.
pipeline
The pipeline parameter is visible only when the Gateway type is set to Custom. It specifies the particular gateway to associate the destination node with in the user interface:
nodes:
  - name: gateway_connection
    type: ed_gateway_output
    gateway_type: custom
    pipeline: example-pipeline
interval
The interval parameter is used to define the time duration between subsequent DNS queries for resolving the IP address of the hostname. This parameter is visible only when the Gateway is set to Custom and the endpoint_resolution_type is set to DNS. It allows you to specify how frequently the DNS resolution should occur, which can help in dynamically handling changes in IP addresses for the gateway you’re connecting to.
nodes:
  - name: gateway_connection
    type: ed_gateway_output
    gateway_type: custom
    endpoint_resolution_type: dns
    interval: 5m
Optional Parameters
disabled
The disabled parameter disables the node in the pipeline. When set to true, the agent ignores the node at startup. You can toggle nodes on or off in the pipeline builder. It is specified as a boolean, defaults to false, and is optional.
nodes:
  - name: <node name>
    type: <node type>
    disabled: true
target_allocation_type
Specifies how to send data from the load balancer. Options include consistent or round_robin. The default is consistent.
Consistent: The node pipeline sends its data to the same gateway instance, determined by a consistent hashing algorithm. This keeps related data together, which improves the accuracy of deduplication and aggregation. It also reduces reprocessing overhead for the same data source. Use Consistent when processing depends on maintaining data locality, such as metric aggregation and deduplication.
By default the following fields are used for grouping data:
- Logs, metrics and events: Service Name
- Traces: Trace ID.
Round Robin: The node pipeline distributes its data evenly across all available gateway instances, one after the other. This balances the load evenly across gateways, regardless of data source. Use this option when the gateway pipeline has been scaled to multiple instances. Use this option when you have specified more than one instance in a custom gateway configuration, where Endpoint Resolution Type is set to Static and you specified multiple Endpoints, or where Endpoint Resolution Type is set to DNS and you specified multiple Hostnames.
nodes:
- name: gateway_connection
  type: ed_gateway_output
  target_allocation_type: consistent
Multi-Source Cluster Behavior with Consistent Routing
When multiple source clusters or node fleets send data to the same gateway cluster using consistent allocation, the routing behavior ensures data coherency across all sources:
The consistent hash is calculated using the data fields (Service Name, Trace ID, etc.), not the source cluster identity. This means:
- All sources sending metrics for
service:nginx→ route to the same gateway pod - All sources sending metrics for
service:apache→ route to the same gateway pod (likely different from nginx) - Ensures accurate cross-cluster aggregation and deduplication
Example scenario:
Source Cluster A: nginx metrics → Gateway Pod X
Source Cluster B: nginx metrics → Gateway Pod X (same pod)
Source Cluster C: nginx metrics → Gateway Pod X (same pod)
Source Cluster A: apache metrics → Gateway Pod Y
Source Cluster B: apache metrics → Gateway Pod Y (same pod)
Load Balancing Tolerance
If strict consistent routing would cause severe load imbalance (exceeding ~1.2x the average pod load), the system may override the hash-based routing to maintain cluster stability. This prevents any single gateway pod from becoming overwhelmed.
Use cases benefiting from consistent multi-cluster routing:
- Cross-region metric aggregation for the same service
- Global deduplication of logs from replicated services
- Accurate P95/P99 latency calculations across all deployments
- Service-level observability spanning multiple Kubernetes clusters
Note: If you observe inconsistent routing behavior where the same service from different sources routes to different gateway pods, verify that all source clusters are using the same
target_allocation_type: consistentsetting and check for load-balancing overrides in your gateway logs.
routing_key_expressions
Overrides default routing behavior using OTTL-based expressions. This is useful when advanced routing logic is required—for example, distributing logs based on tenant ID, environment, or region. Use this parameter to ensure that data is consistently routed according to key fields in the telemetry payload.
The routing_key_expressions parameter is only relevant when target_allocation_type is set to consistent. It customizes how consistency is calculated, not whether consistency is used.
For example, you might create a parameter upstream that concatenates service name and cluster name, and use that as a routing key expression. In this instance, all traffic with the same service-cluster name will be routed to the same destination gateway.
parallel_worker_count
Controls concurrency by defining how many internal workers run in parallel to send data to the configured gateway. Increasing this value can improve throughput and reduce latency when handling high volumes of telemetry data, especially in environments where data is batched, transformed, or compressed before transmission.
This setting applies to the source-side gateway connection node — meaning it influences how the source agent processes and exports data, not how the gateway receives it.
Use this setting to:
- Increase throughput when the source has sufficient CPU and I/O headroom.
- Reduce idle time in data pipelines that prepare and ship large payloads.
- Improve responsiveness in pipelines sending diverse or bursty telemetry.
Avoid tuning this too high in constrained environments, as excess concurrency may increase CPU/memory pressure or lead to more contention.
tls
Configure TLS settings for secure connections to this destination. TLS is optional and typically used when connecting to endpoints that require encrypted transport (HTTPS) or mutual TLS.
YAML Configuration Example:
nodes:
  - name: <node name>
    type: <destination type>
    tls:
      <tls options>
Enable TLS
Enables TLS encryption for outbound connections to the destination endpoint. When enabled, all communication with the destination will be encrypted using TLS/SSL. This should be enabled when connecting to HTTPS endpoints or any service that requires encrypted transport. (YAML parameter: enabled)
Default: false
When to use: Enable when the destination requires HTTPS or secure connections. Always enable for production systems handling sensitive data, connections over untrusted networks, or when compliance requirements mandate encryption in transit.
YAML Configuration Example:
nodes:
  - name: <node name>
    type: <destination type>
    tls:
      enabled: true
Ignore Certificate Check
Disables TLS certificate verification, allowing connections to servers with self-signed, expired, or invalid certificates. This bypasses security checks that verify the server’s identity and certificate validity. (YAML parameter: ignore_certificate_check)
Default: false
When to use: Only use in development or testing environments with self-signed certificates. NEVER enable in production—this makes your connection vulnerable to man-in-the-middle attacks. For production with self-signed certificates, use ca_file or ca_path to explicitly trust specific certificates instead.
YAML Configuration Example:
nodes:
  - name: <node name>
    type: <destination type>
    tls:
      ignore_certificate_check: true  # Only for testing!
CA Certificate File
Specifies the absolute path to a CA (Certificate Authority) certificate file used to verify the destination server’s certificate. This allows you to trust specific CAs beyond the system’s default trusted CAs, which is essential when connecting to servers using self-signed certificates or private CAs. (YAML parameter: ca_file)
When to use: Required when connecting to servers with certificates signed by a private/internal CA, or when you want to restrict trust to specific CAs only. Choose either ca_file (single CA certificate) or ca_path (directory of CA certificates), not both.
YAML Configuration Example:
nodes:
  - name: <node name>
    type: <destination type>
    tls:
      ca_file: /certs/ca.pem
CA Certificate Path
Specifies a directory path containing one or more CA certificate files for verifying the destination server’s certificate. Use this when you need to trust multiple CAs or when managing CA certificates across multiple files. All certificate files in the directory will be loaded. (YAML parameter: ca_path)
When to use: Alternative to ca_file when you have multiple CA certificates to trust. Useful for environments with multiple private CAs or when you need to rotate CA certificates without modifying configuration. Choose either ca_file or ca_path, not both.
YAML Configuration Example:
nodes:
  - name: <node name>
    type: <destination type>
    tls:
      ca_path: /certs/ca-certificates/
Certificate File
Path to the client certificate file (public key) used for mutual TLS (mTLS) authentication with the destination server. This certificate identifies the client to the server and must match the private key. The certificate should be in PEM format. (YAML parameter: crt_file)
When to use: Required only when the destination server requires mutual TLS authentication, where both client and server present certificates. Must be used together with key_file. Not needed for standard client TLS connections where only the server presents a certificate.
YAML Configuration Example:
nodes:
  - name: <node name>
    type: <destination type>
    tls:
      crt_file: /certs/client-cert.pem
      key_file: /certs/client-key.pem
Private Key File
Path to the private key file corresponding to the client certificate. This key must match the public key in the certificate file and is used during the TLS handshake to prove ownership of the certificate. Keep this file secure with restricted permissions. (YAML parameter: key_file)
When to use: Required for mutual TLS authentication. Must be used together with crt_file. If the key file is encrypted with a password, also specify key_password. Only needed when the destination server requires client certificate authentication.
YAML Configuration Example:
nodes:
  - name: <node name>
    type: <destination type>
    tls:
      crt_file: /certs/client-cert.pem
      key_file: /certs/client-key.pem
      key_password: <password>  # Only if key is encrypted
Private Key Password
Password (passphrase) used to decrypt an encrypted private key file. Only needed if your private key file is password-protected. If your key file is unencrypted, omit this parameter. (YAML parameter: key_password)
When to use: Optional. Only required if key_file is encrypted/password-protected. For enhanced security, use encrypted keys in production environments. If you receive “bad decrypt” or “incorrect password” errors, verify the password matches the key file encryption.
YAML Configuration Example:
nodes:
  - name: <node name>
    type: <destination type>
    tls:
      crt_file: /certs/client-cert.pem
      key_file: /certs/encrypted-client-key.pem
      key_password: mySecurePassword123
Minimum TLS Version
Minimum TLS protocol version to use when connecting to the destination server. This enforces a baseline security level by refusing to connect if the server doesn’t support this version or higher. (YAML parameter: min_version)
Available versions:
TLSv1_0- Deprecated, not recommended (security vulnerabilities)TLSv1_1- Deprecated, not recommended (security vulnerabilities)TLSv1_2- Recommended minimum for production (default)TLSv1_3- Most secure, use when destination supports it
Default: TLSv1_2
When to use: Set to TLSv1_2 or higher for production deployments. Only use TLSv1_0 or TLSv1_1 if connecting to legacy servers that don’t support newer versions, and be aware of the security risks. TLS 1.0 and 1.1 are officially deprecated.
YAML Configuration Example:
nodes:
  - name: <node name>
    type: <destination type>
    tls:
      min_version: TLSv1_2
Maximum TLS Version
Maximum TLS protocol version to use when connecting to the destination server. This is typically used to restrict newer TLS versions if compatibility issues arise with specific server implementations. (YAML parameter: max_version)
Available versions:
TLSv1_0TLSv1_1TLSv1_2TLSv1_3
When to use: Usually left unset to allow the most secure version available. Only set this if you encounter specific compatibility issues with TLS 1.3 on the destination server, or for testing purposes. In most cases, you should allow the latest TLS version.
YAML Configuration Example:
nodes:
  - name: <node name>
    type: <destination type>
    tls:
      max_version: TLSv1_3
resilience
Enables advanced fault tolerance controls for output reliability. This section supports circuit breakers and system health monitoring, providing protection against downstream failures and resource exhaustion.
Circuit Breaker Settings
When the circuit breaker is enabled, the node automatically halts traffic to a failing destination after a defined number of errors. This protects the pipeline and downstream systems from cascading failures. The circuit remains open for a fixed timeout (open_timeout), after which it enters a half-open state to test recovery. A limited number of test calls (half_open_max_calls) are allowed during this phase. Based on their success, the circuit either closes (resumes traffic) or reopens.
Key configuration options:
enabled: Turns the circuit breaker on or off.failure_threshold: Number of failures before the circuit opens.open_timeout: Duration to block traffic before testing recovery.half_open_max_calls: Number of test calls during half-open.half_open_timeout: How long to run recovery testing.check_interval: How often to evaluate circuit state.
Global Health Checks
Global health monitoring complements error-based breaking by evaluating system-level signals. If memory usage or queue saturation exceed thresholds, the circuit can proactively open—helping protect the agent and maintain pipeline stability.
System-level parameters:
enabled: Activates global health monitoring.memory_check_enabled: Monitors agent memory usage.memory_threshold: Memory usage limit (e.g., 1024MB).queue_check_enabled: Monitors output queue saturation.queue_threshold_percentage: Queue usage percentage to trip circuit.check_interval: Frequency of system health evaluation.
Fallback Behavior
When the circuit is open, the node executes a tiered fallback sequence to preserve data delivery and protect resources:
- Reroute: Attempts to deliver the data to a healthy destination. Up to three retries are made across alternate destinations.
- Success → data is delivered.
- Failure → proceed to sampling.
- Health-Based Sampling: Applies a dynamic sampling rate based on system health. The more healthy destinations detected, the higher the sampling rate.
- Success → sampled data is preserved and sent.
- Failure → proceed to graceful drop.
- Graceful Drop: Discards the data in a controlled way to maintain system stability. This final strategy always succeeds to prevent retry loops and protect agent resources.
See Circuit Breaker for a detailed explanation of failure handling, state transitions, and fallback workflows.
enable_passthrough_resolution
The enable_passthrough_resolution parameter enables passthrough address resolution for GRPC connections. It is specified as a Boolean, has a default of false, and is optional.
persistent_queue
The persistent_queue configuration enables disk-based buffering to prevent data loss during destination failures or slowdowns. When enabled, the agent stores data on disk and automatically retries delivery when the destination recovers.
Complete example:
persistent_queue:
  path: /var/lib/edgedelta/outputbuffer
  mode: error
  max_byte_size: 1GB
  drain_rate_limit: 1000
How it works:
- Normal operation: Data flows directly to the destination (for
errorandbackpressuremodes) or through the disk buffer (foralwaysmode) - Destination issue detected: Based on the configured
mode, data is written to disk at the configuredpath - Recovery: When the destination recovers, buffered data drains at the configured
drain_rate_limitwhile new data continues flowing - Completion: Buffer clears and normal operation resumes
Key benefits:
- Data durability: Logs preserved during destination outages and slowdowns
- Agent protection: Slow backends don’t cascade failures into the agent cluster
- Automatic recovery: No manual intervention required
- Configurable behavior: Choose when and how buffering occurs based on your needs
Learn more: Buffer Configuration - Conceptual overview, sizing guidance, and troubleshooting
path
The path parameter specifies the directory where buffered data is stored on disk. This parameter is required when configuring a persistent queue.
Example:
persistent_queue:
  path: /var/lib/edgedelta/outputbuffer
Requirements:
- Required field - persistent queue will not function without a valid path
- The directory must have sufficient disk space for the configured
max_byte_size - The agent process must have read/write permissions to this location
- The path should be on a persistent volume (not tmpfs or memory-backed filesystem)
Best practices:
- Use dedicated storage for buffer data separate from logs
- Monitor disk usage to prevent buffer from filling available space
- Ensure the path persists across agent restarts to maintain buffered data
max_byte_size
The max_byte_size parameter defines the maximum disk space the persistent buffer is allowed to use. Once this limit is reached, any new incoming items are dropped, ensuring the buffer never grows beyond the configured maximum.
Note: This limit is total storage for the persistent queue, not per-worker. If you configure
max_byte_size: 1GBand the destination has 15 workers, the buffer uses 1GB total, not 15GB.
Example:
persistent_queue:
  path: /var/lib/edgedelta/outputbuffer
  max_byte_size: 1GB
Sizing guidance:
- Small deployments (1-10 logs/sec): 100MB - 500MB
- Medium deployments (10-100 logs/sec): 500MB - 2GB
- Large deployments (100+ logs/sec): 2GB - 10GB
Calculation example:
Average log size: 1KB
Expected outage duration: 1 hour
Log rate: 100 logs/sec

Buffer size = 1KB × 100 logs/sec × 3600 sec = 360MB
Recommended: 500MB - 1GB (with safety margin)
Important: Set this value based on your disk space availability and expected outage duration. The buffer will accumulate data during destination failures and drain when the destination recovers.
mode
The mode parameter determines when data is buffered to disk. Three modes are available:
error(default) - Buffers data only when the destination returns errors (connection failures, HTTP 5xx errors, timeouts). During healthy operation, data flows directly to the destination without buffering.backpressure- Buffers data when the in-memory queue reaches 80% capacity OR when destination errors occur. This mode helps handle slow destinations that respond successfully but take longer than usual to process requests.always- Uses write-ahead-log behavior where all data is written to disk before being sent to the destination. This provides maximum durability but adds disk I/O overhead to every operation.
Example:
persistent_queue:
  path: /var/lib/edgedelta/outputbuffer
  mode: error
  max_byte_size: 1GB
Mode comparison:
| Mode | Protects Against | Trade-off | Recommended For |
|---|---|---|---|
error | Destination outages and failures | No protection during slow responses | Reliable destinations with consistent response times |
backpressure | Outages + slow/degraded destinations | Slightly more disk writes during slowdowns | Most production deployments |
always | All scenarios including agent crashes | Disk I/O on every item reduces throughput | Maximum durability requirements |
Why choose error mode:
The error mode provides the minimal protection layer needed to prevent data loss when destinations temporarily fail. Without any persistent queue, a destination outage means data is lost. With error mode enabled, data is preserved on disk during failures and delivered automatically when the destination recovers.
Why choose backpressure mode:
The backpressure mode provides everything error mode offers, plus protection against slow destinations. When a destination is slow but not completely down:
- Without
backpressure: Data delivery becomes unreliable, and the backend’s slowness propagates to the agent—the agent can get stuck waiting before sending subsequent payloads - With
backpressure: The agent spills data to disk and continues processing, isolating itself from the slow backend
This prevents a slow destination from cascading failures into your agent cluster. For most production environments, backpressure provides the best balance of protection and performance.
Why choose always mode:
The always mode is designed for customers with extremely strict durability requirements. It forces the agent to write every item to disk before attempting delivery, then reads from disk for transmission. This guarantees that data survives even sudden agent crashes or restarts.
Important: This mode introduces a measurable performance cost. Each agent performs additional disk I/O on every item, which reduces overall throughput. Most deployments do not require this level of durability—this feature addresses specialized needs that apply to a small minority of customers.
Only enable always mode if you have a specific, well-understood requirement where the durability guarantee outweighs the throughput reduction.
strict_ordering
The strict_ordering parameter controls how items are consumed from the persistent buffer.
When strict_ordering: true, the agent runs in strict ordering mode with a single processing thread. This mode always prioritizes draining buffered items first—new incoming data waits until all buffered items are processed in exact chronological order. When strict_ordering: false (default), multiple workers process data in parallel, and new data flows directly to the destination while buffered data drains in the background.
Example:
persistent_queue:
  path: /var/lib/edgedelta/outputbuffer
  mode: always
  strict_ordering: true
parallel_workers: 1
Default value: false
Important: Strict ordering is a specialized feature needed by a very small minority of deployments. Most users should keep the default value of false. Only enable strict ordering if you have a specific, well-understood requirement for exact event sequencing.
Required setting: When strict_ordering: true, you must set parallel_workers: 1. Pipeline validation will fail if parallel_workers is greater than 1 because parallel processing inherently breaks ordering guarantees.
Behavior:
| Value | Processing Model | Buffer Priority | Recovery Latency |
|---|---|---|---|
false (default) | Parallel workers | Buffered data drains in background | Lower - current state visible immediately |
true | Single-threaded | Buffered items always drain first | Higher - queue must drain before new data |
Why the default is false:
In most observability use cases, data freshness is more valuable than strict ordering. When a destination recovers from an outage, operators typically want to see current system state on dashboards immediately, while historical data backfills in the background. The default behavior prioritizes this real-time visibility.
When to enable strict ordering:
Strict ordering is primarily needed by security-focused customers who build systems where events must arrive in the exact delivery order. These customers typically run stateful security streaming engines that depend on precise temporal sequencing.
Specific use cases:
- Stateful security streaming engines - Security systems that maintain state across events and detect patterns based on exact event order
- Audit and compliance logs - Regulatory requirements that mandate audit trails preserve exact temporal sequence
- State reconstruction - Systems that replay events to rebuild state require chronological order
When to keep default (false):
The vast majority of deployments should keep the default:
- Real-time monitoring dashboards - Current state visibility is more important than historical order
- High-volume log ingestion - Faster drain times reduce recovery period
- Stateless analytics - When each log is analyzed independently without temporal correlation
drain_rate_limit
The drain_rate_limit parameter controls the maximum items per second when draining the persistent buffer after a destination recovers from a failure.
Example:
persistent_queue:
  path: /var/lib/edgedelta/outputbuffer
  drain_rate_limit: 1000
Default value: 0 (no limit - drain as fast as the destination accepts)
Why rate limiting matters:
When a destination recovers from an outage, it may still be fragile. Immediately flooding it with hours of backlogged data can trigger another failure. The drain rate limit allows gradual, controlled recovery that protects destination stability.
Choosing the right rate:
| Scenario | Recommended Rate | Reasoning |
|---|---|---|
| Stable, well-provisioned destination | 0 (unlimited) | Minimize recovery time when destination can handle full load |
| Shared or multi-tenant destination | 20-50% of capacity | Leave headroom for live traffic and other tenants |
| Recently recovered destination | 10-25% of capacity | Gentle ramp-up to prevent re-triggering failure |
| Rate-limited destination (e.g., SaaS) | Below API rate limit | Avoid throttling or quota exhaustion |
Impact on recovery time:
Buffer size: 1GB
Average log size: 1KB
Total items: ~1,000,000 logs

At unlimited (0): Depends on destination capacity
At 5000:      ~3.5 minutes to drain
At 1000:      ~17 minutes to drain
At 100:       ~2.8 hours to drain