Try Edge Delta in a Sandbox
5 minute read
With a new workload in your cluster your data might be limited as you explore the interface. You can also view the public play.edgedelta.com environment, which is connected to Edge Delta managed workloads for demonstration purposes. The following section shows data populated in the Play environment.
AI Team
Click AI Team to explore Edge Delta’s AI-powered observability assistant. The AI Team page provides an intelligent interface where you can chat with specialized AI teammates, manage connectors, and collaborate on observability tasks.
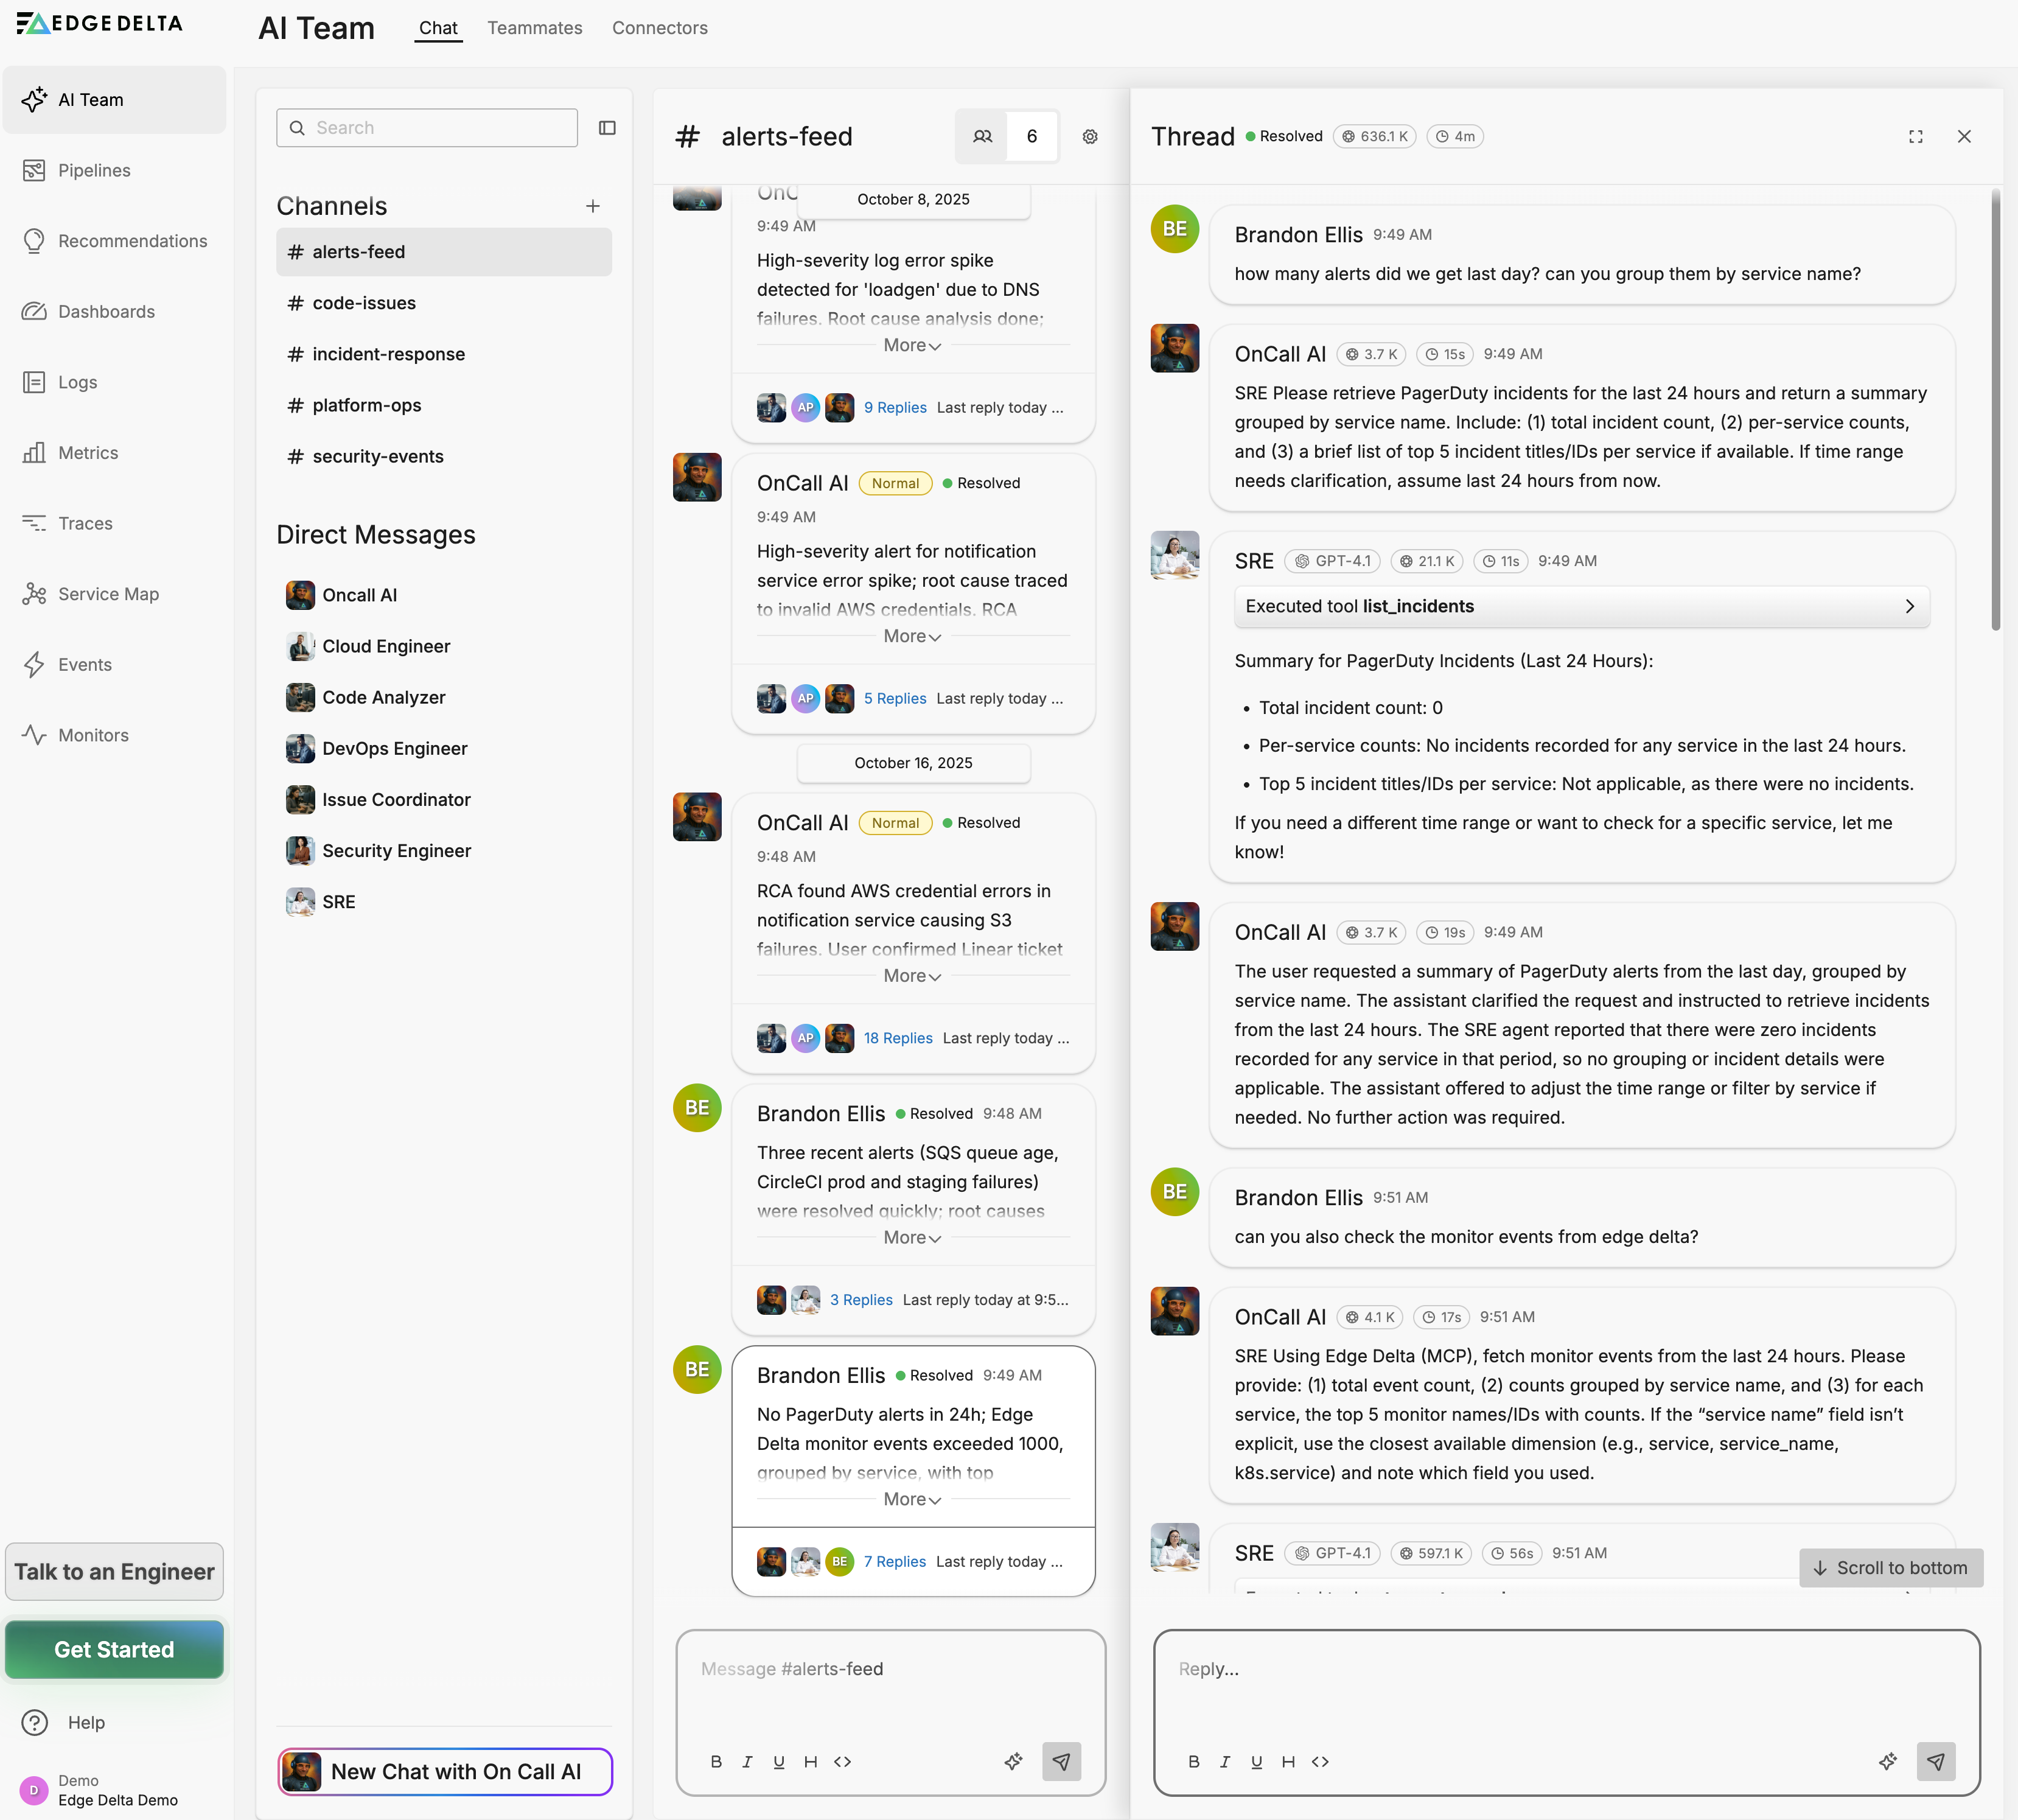
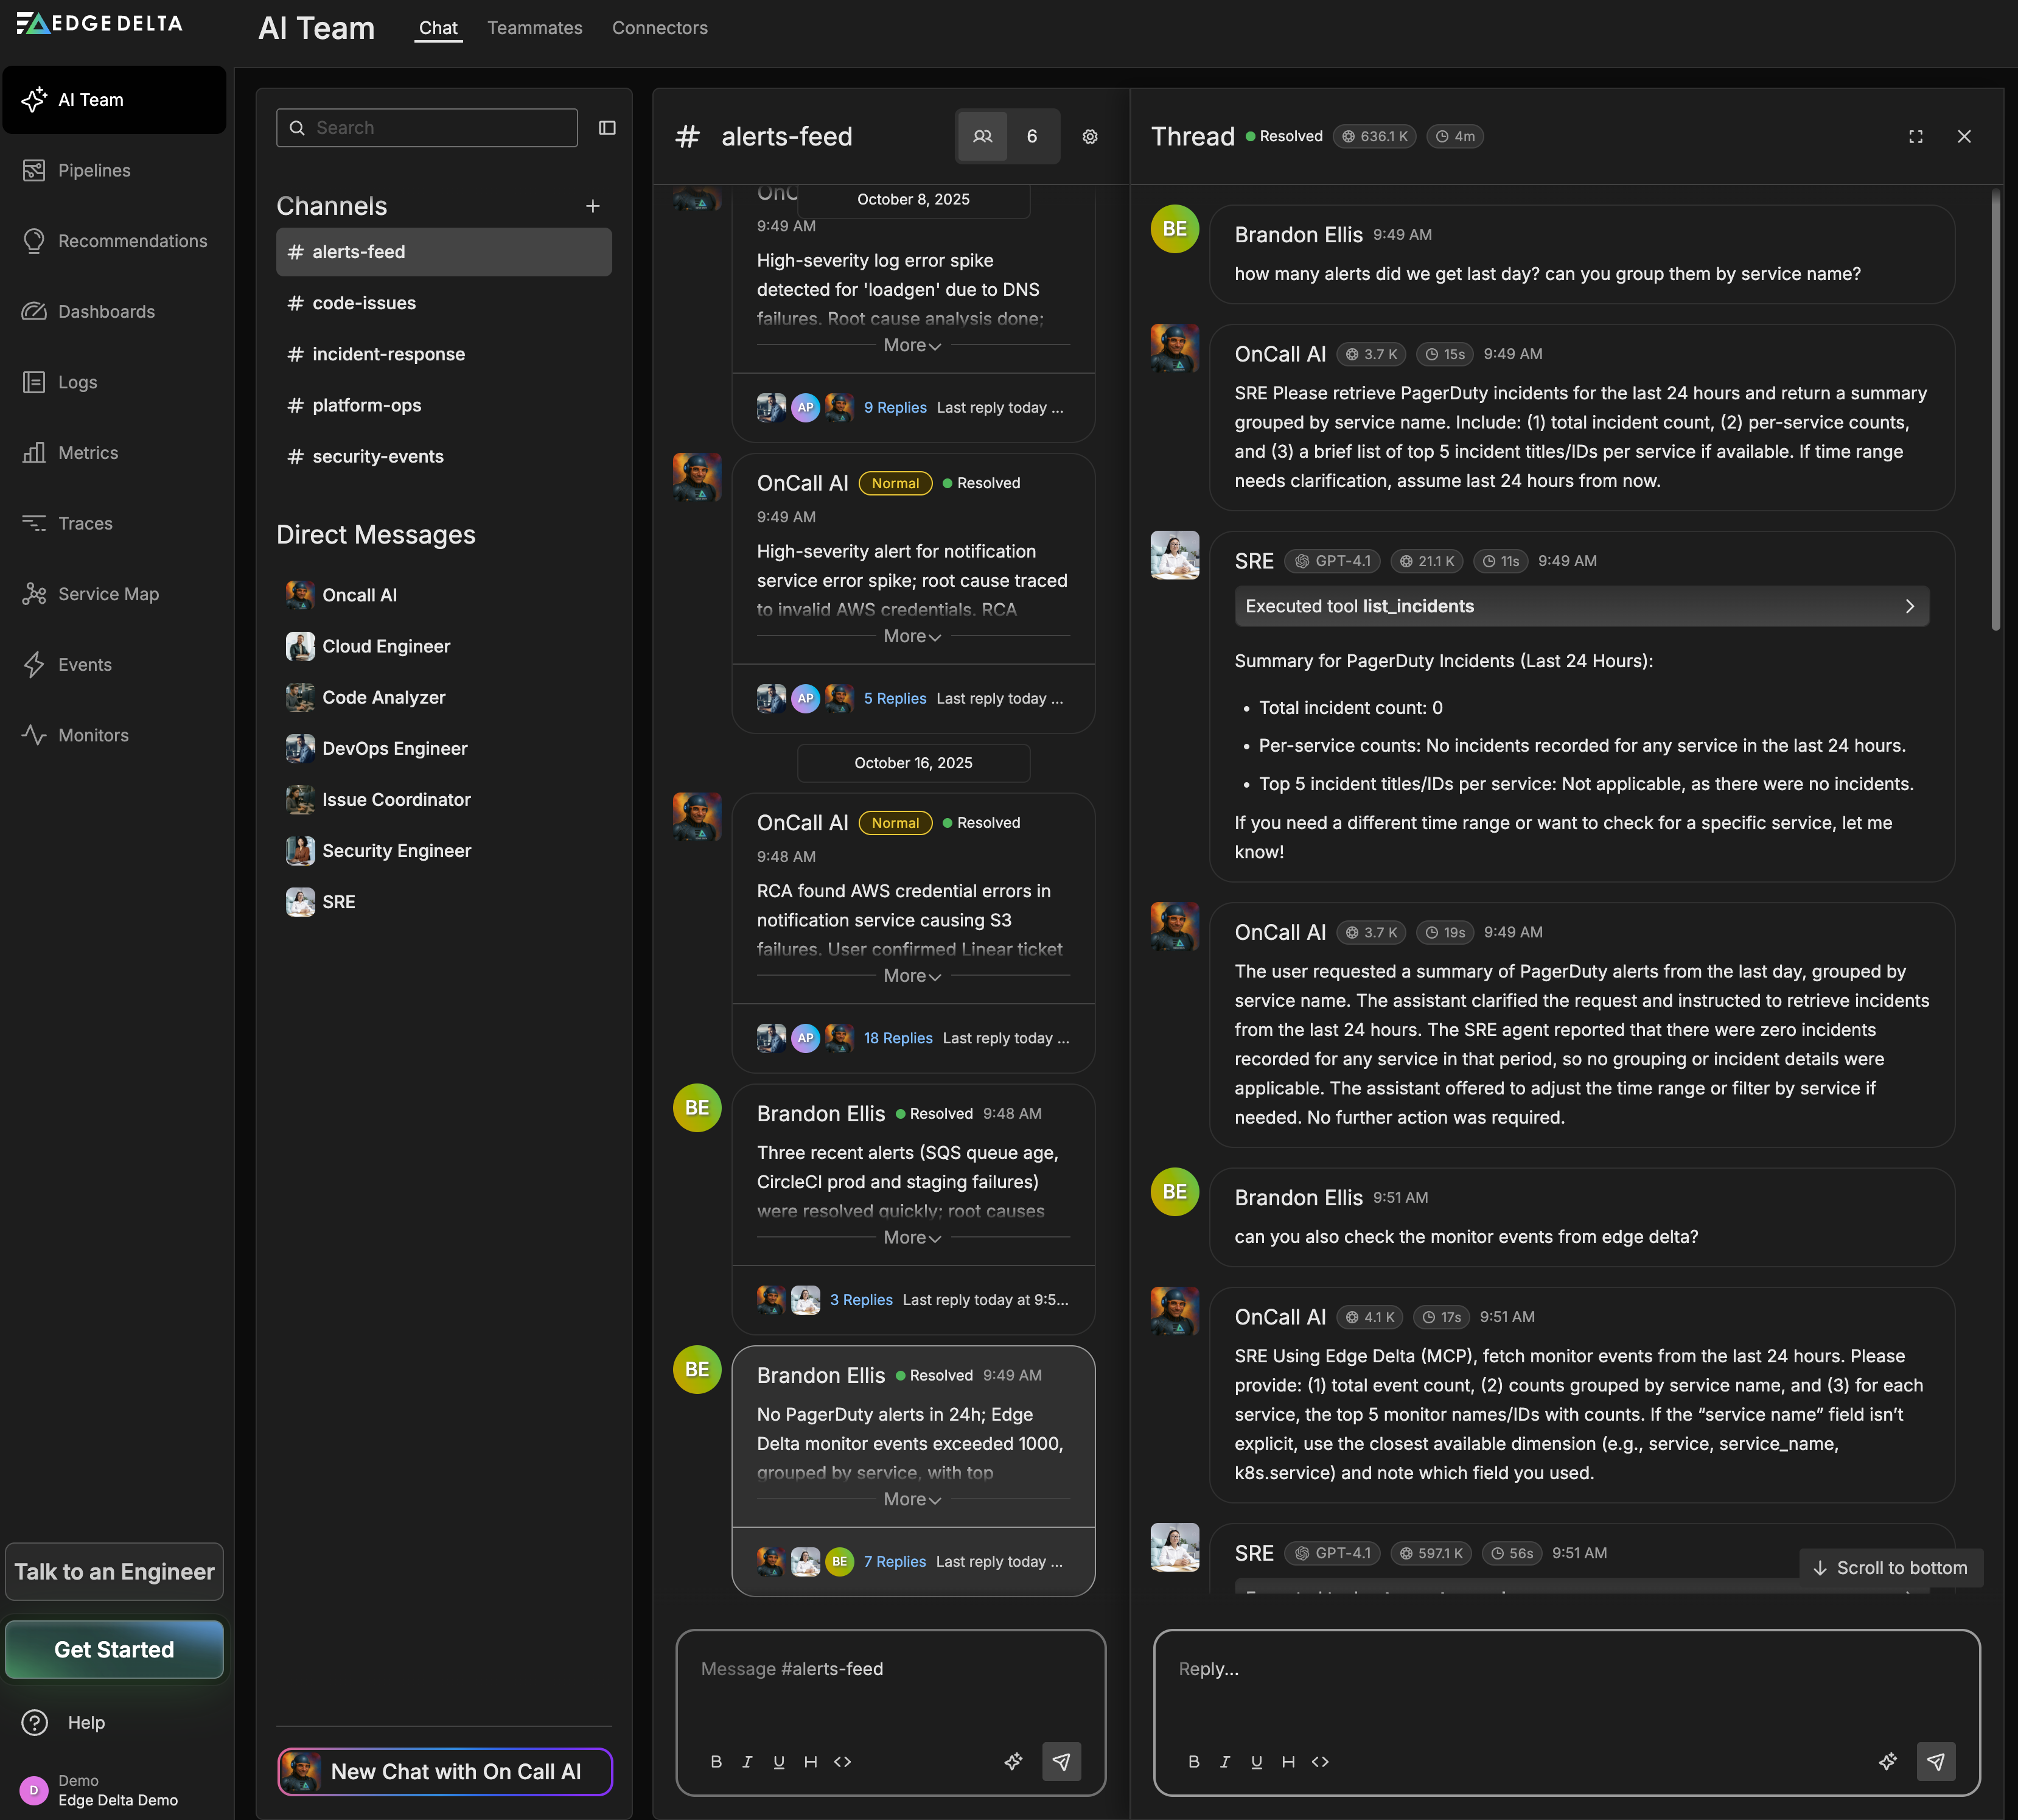
The AI Team page has three main tabs:
- Chat: Start conversations with AI teammates, create channels, and collaborate on observability tasks
- Teammates: View and manage specialized AI teammates like SRE, Code Analyzer, Security Engineer, and Work Tracker
- Connectors: Configure integrations with your tools (PagerDuty, GitHub, AWS, Kubernetes, etc.)
Getting Started with AI Team
- Start a conversation: Open a channel and start a thread to ask questions about your infrastructure
- Explore teammates: Check the Teammates tab to see available AI specialists and their capabilities
- Connect your tools: Visit the Connectors tab to integrate PagerDuty, GitHub, AWS, or other services
OnCall AI orchestrates investigations by routing your requests to the appropriate specialized teammates within channel threads. For a detailed guide, see Getting Started with AI Team.
Key AI Team Features
- Intelligent routing: OnCall AI automatically routes requests to appropriate specialist teammates
- Multi-teammate collaboration: Create channels where multiple AI teammates work together
- Connector integrations: AI teammates can access your tools and infrastructure through configured connectors
- Context-aware insights: Teammates analyze your telemetry data to provide actionable recommendations
Try starting a thread in a channel with questions like:
- “Show me recent anomalies in my logs”
- “What’s causing high CPU usage?”
- “Analyze error patterns from the last hour”
- “Help me understand my pipeline configuration”
Pipelines
Click Pipelines to view and manage your telemetry pipelines. This page lists all pipelines in your organization, showing their status, deployment information, and configuration details. See here for more information.
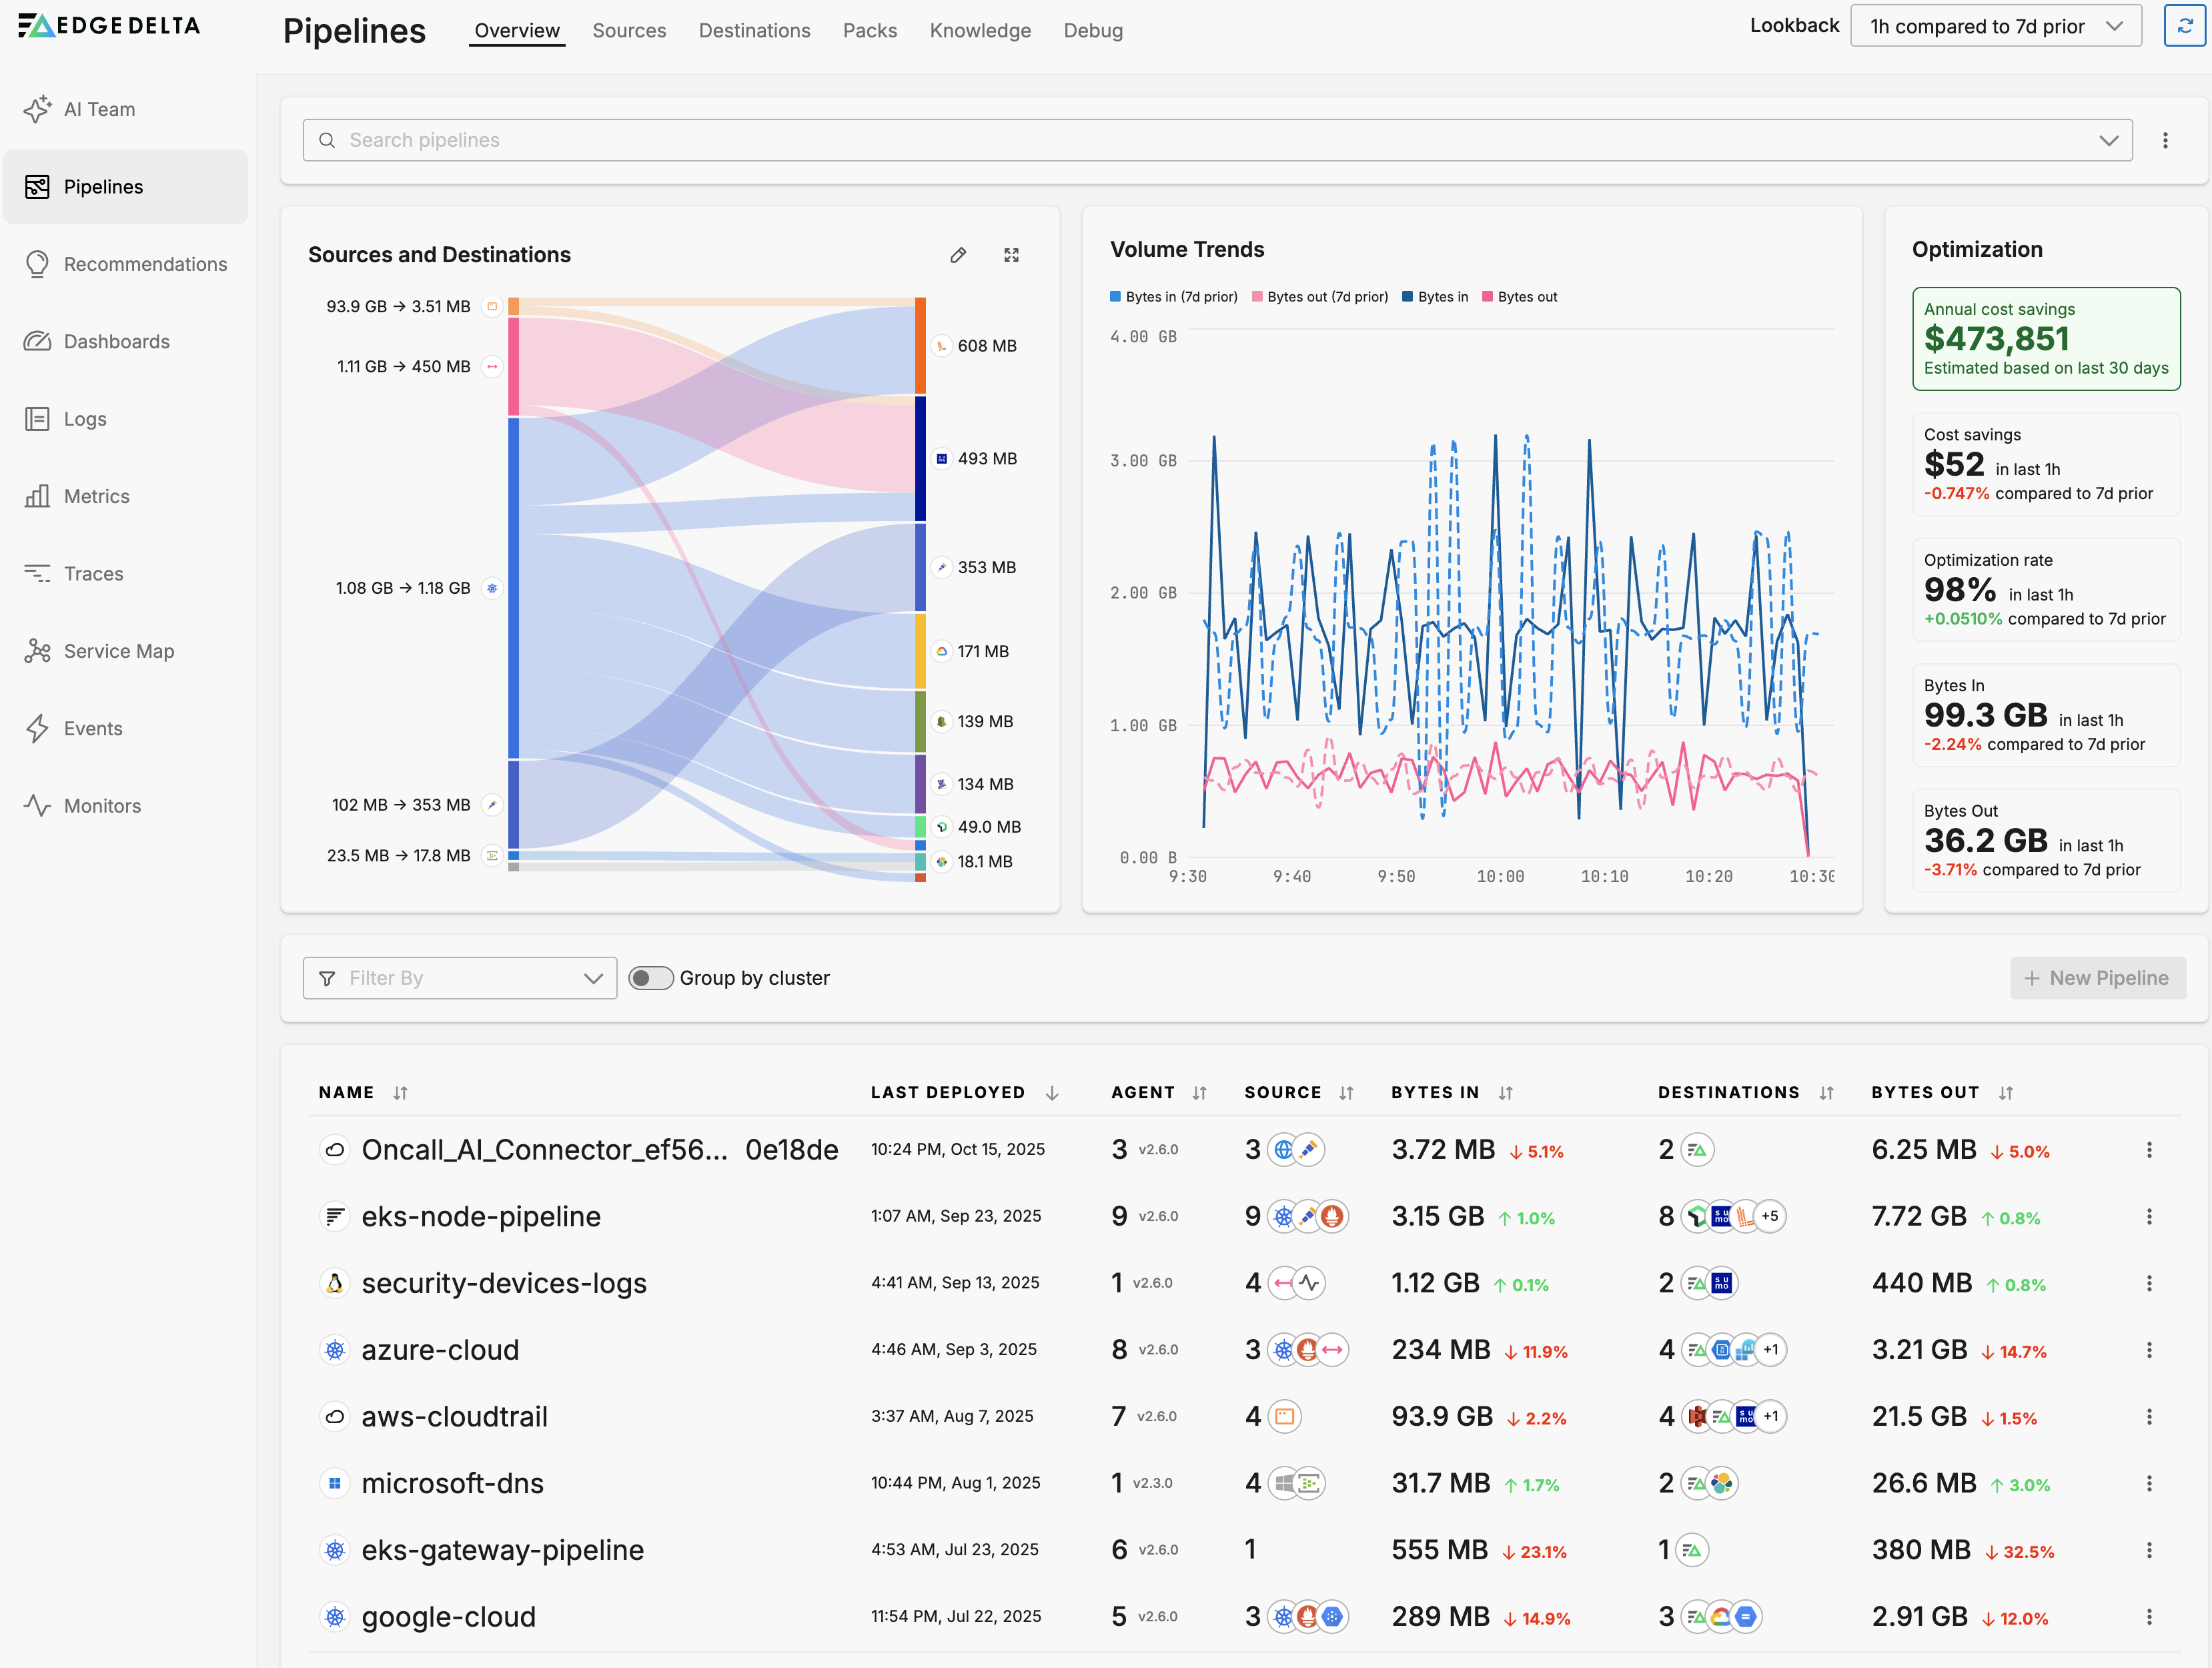
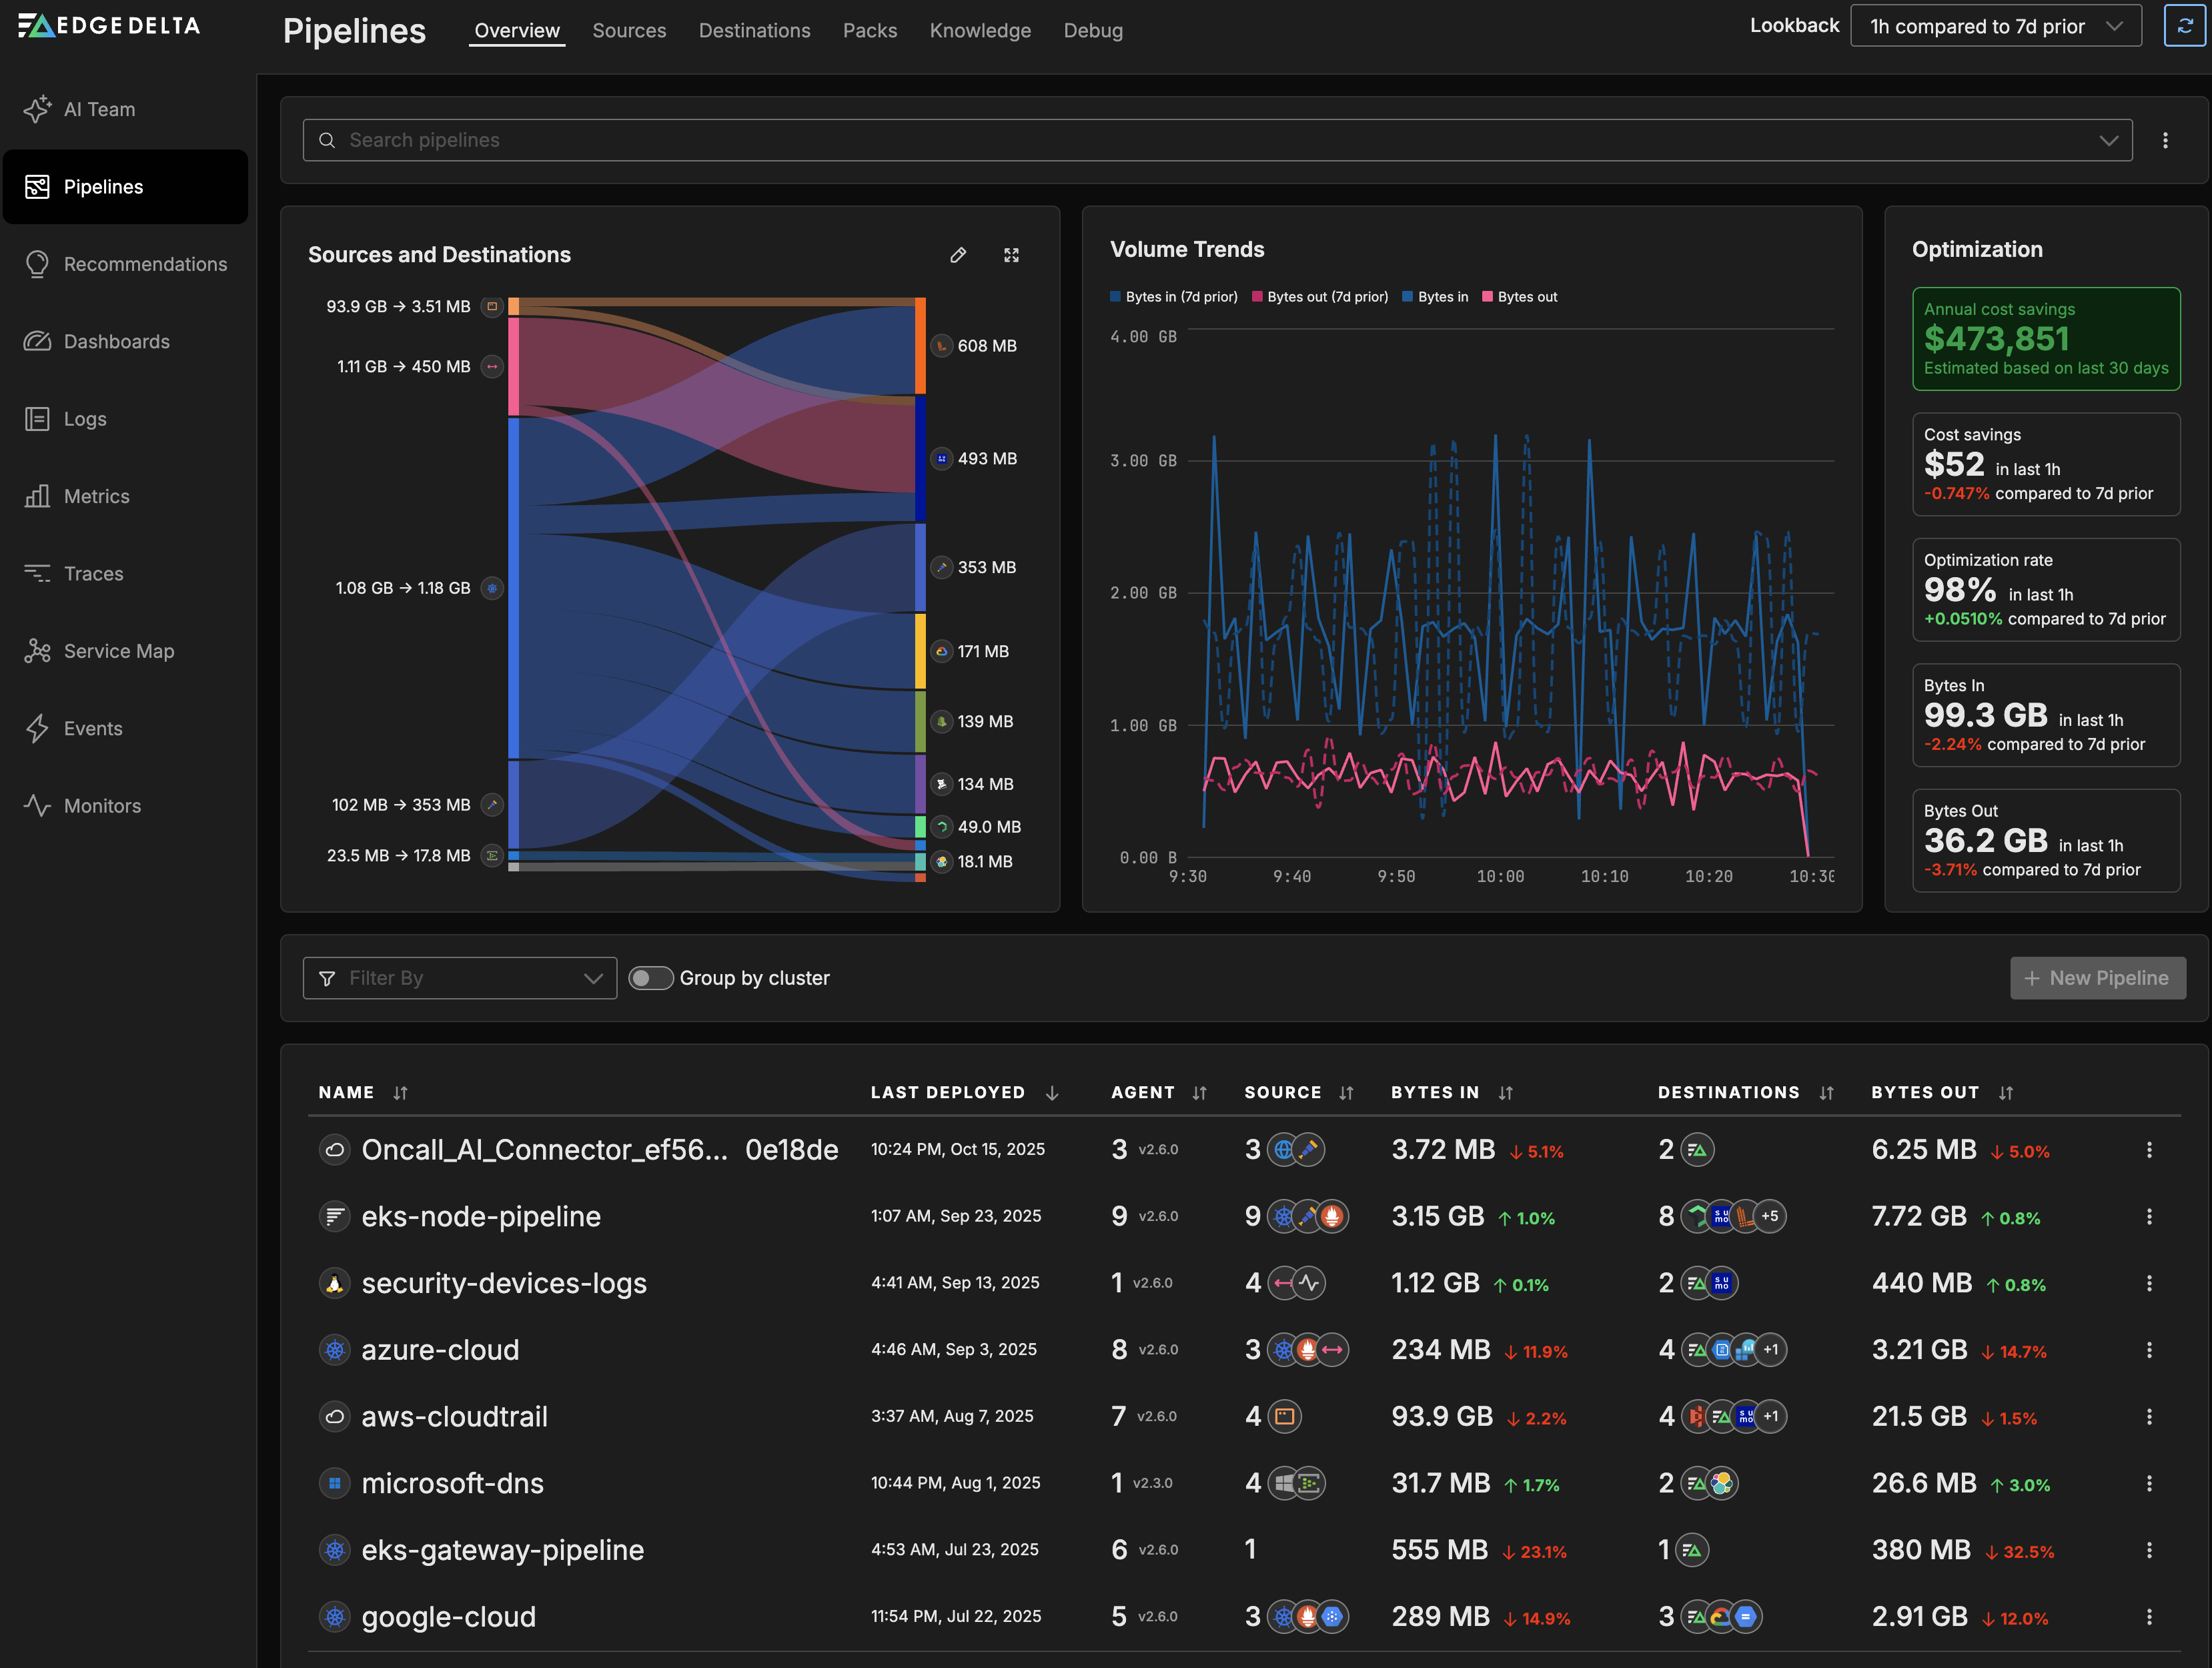
Pipelines define how your telemetry data flows from sources through processors to destinations. You can create new pipelines, edit existing ones, and monitor their health and performance from this page.
Recommendations
Click Recommendations to view AI-powered suggestions for optimizing your telemetry pipelines. Edge Delta analyzes your log patterns and pipeline configurations to recommend high-impact improvements that can reduce costs, improve data hygiene, and implement best practices.
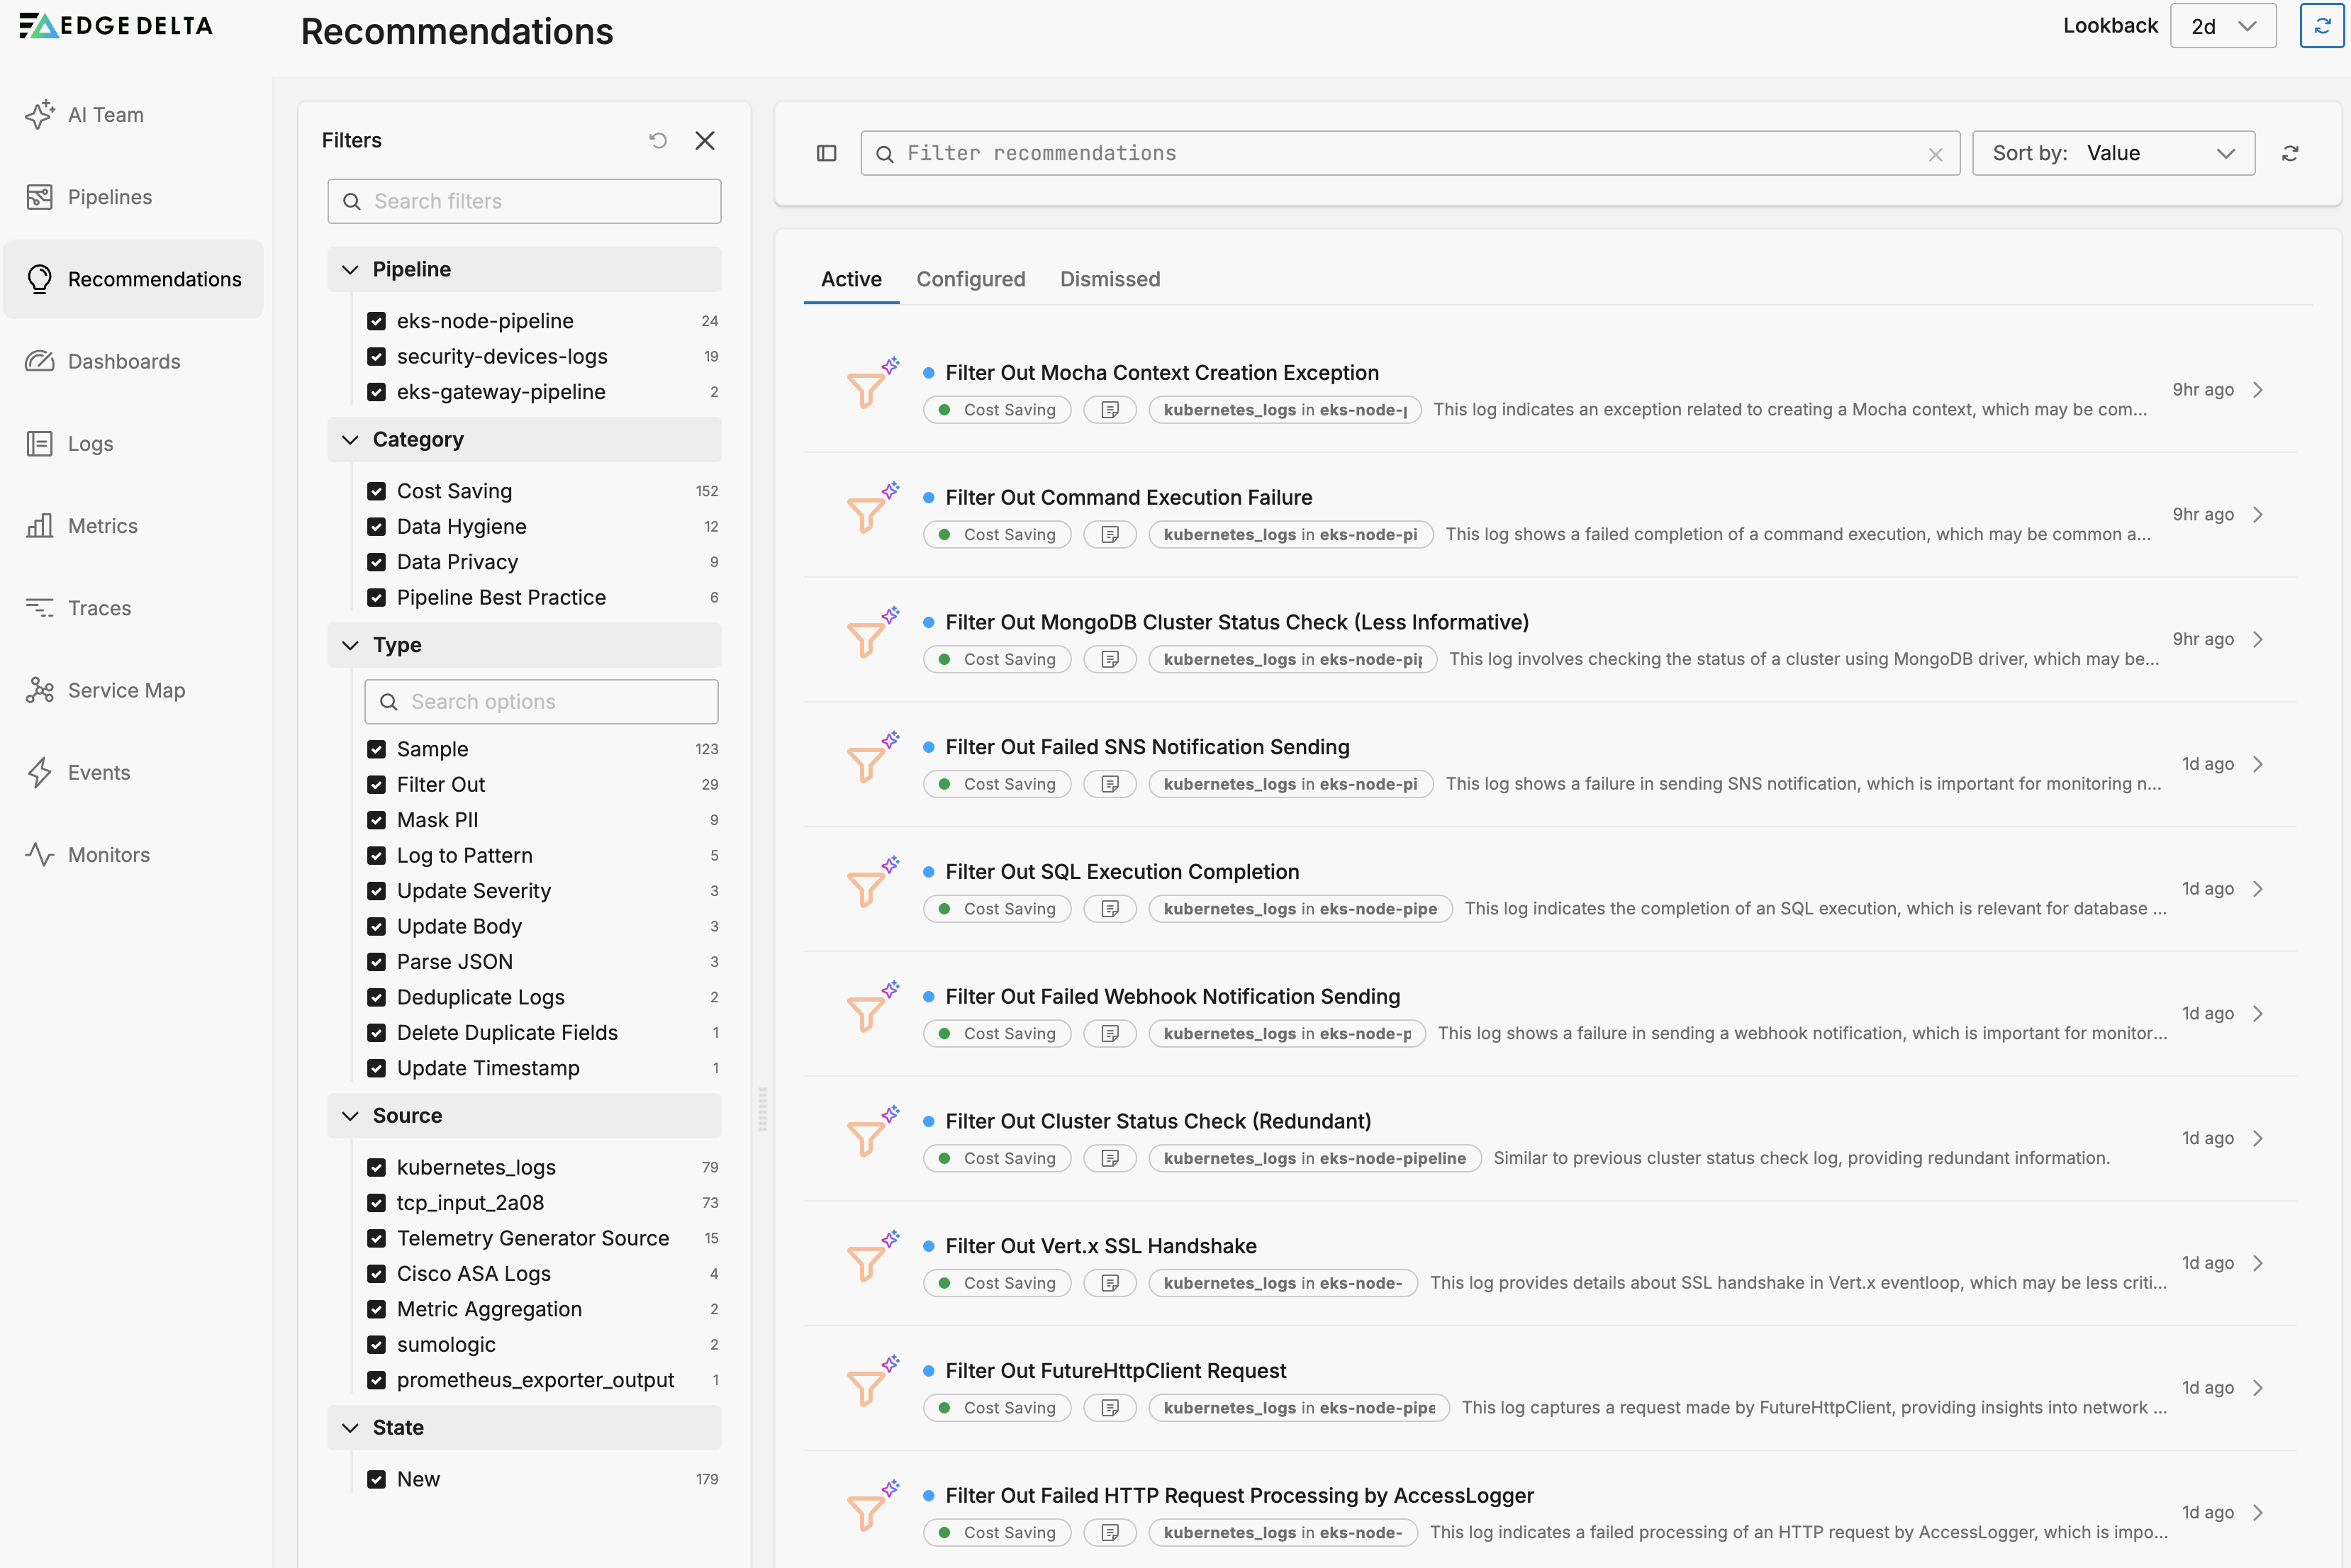
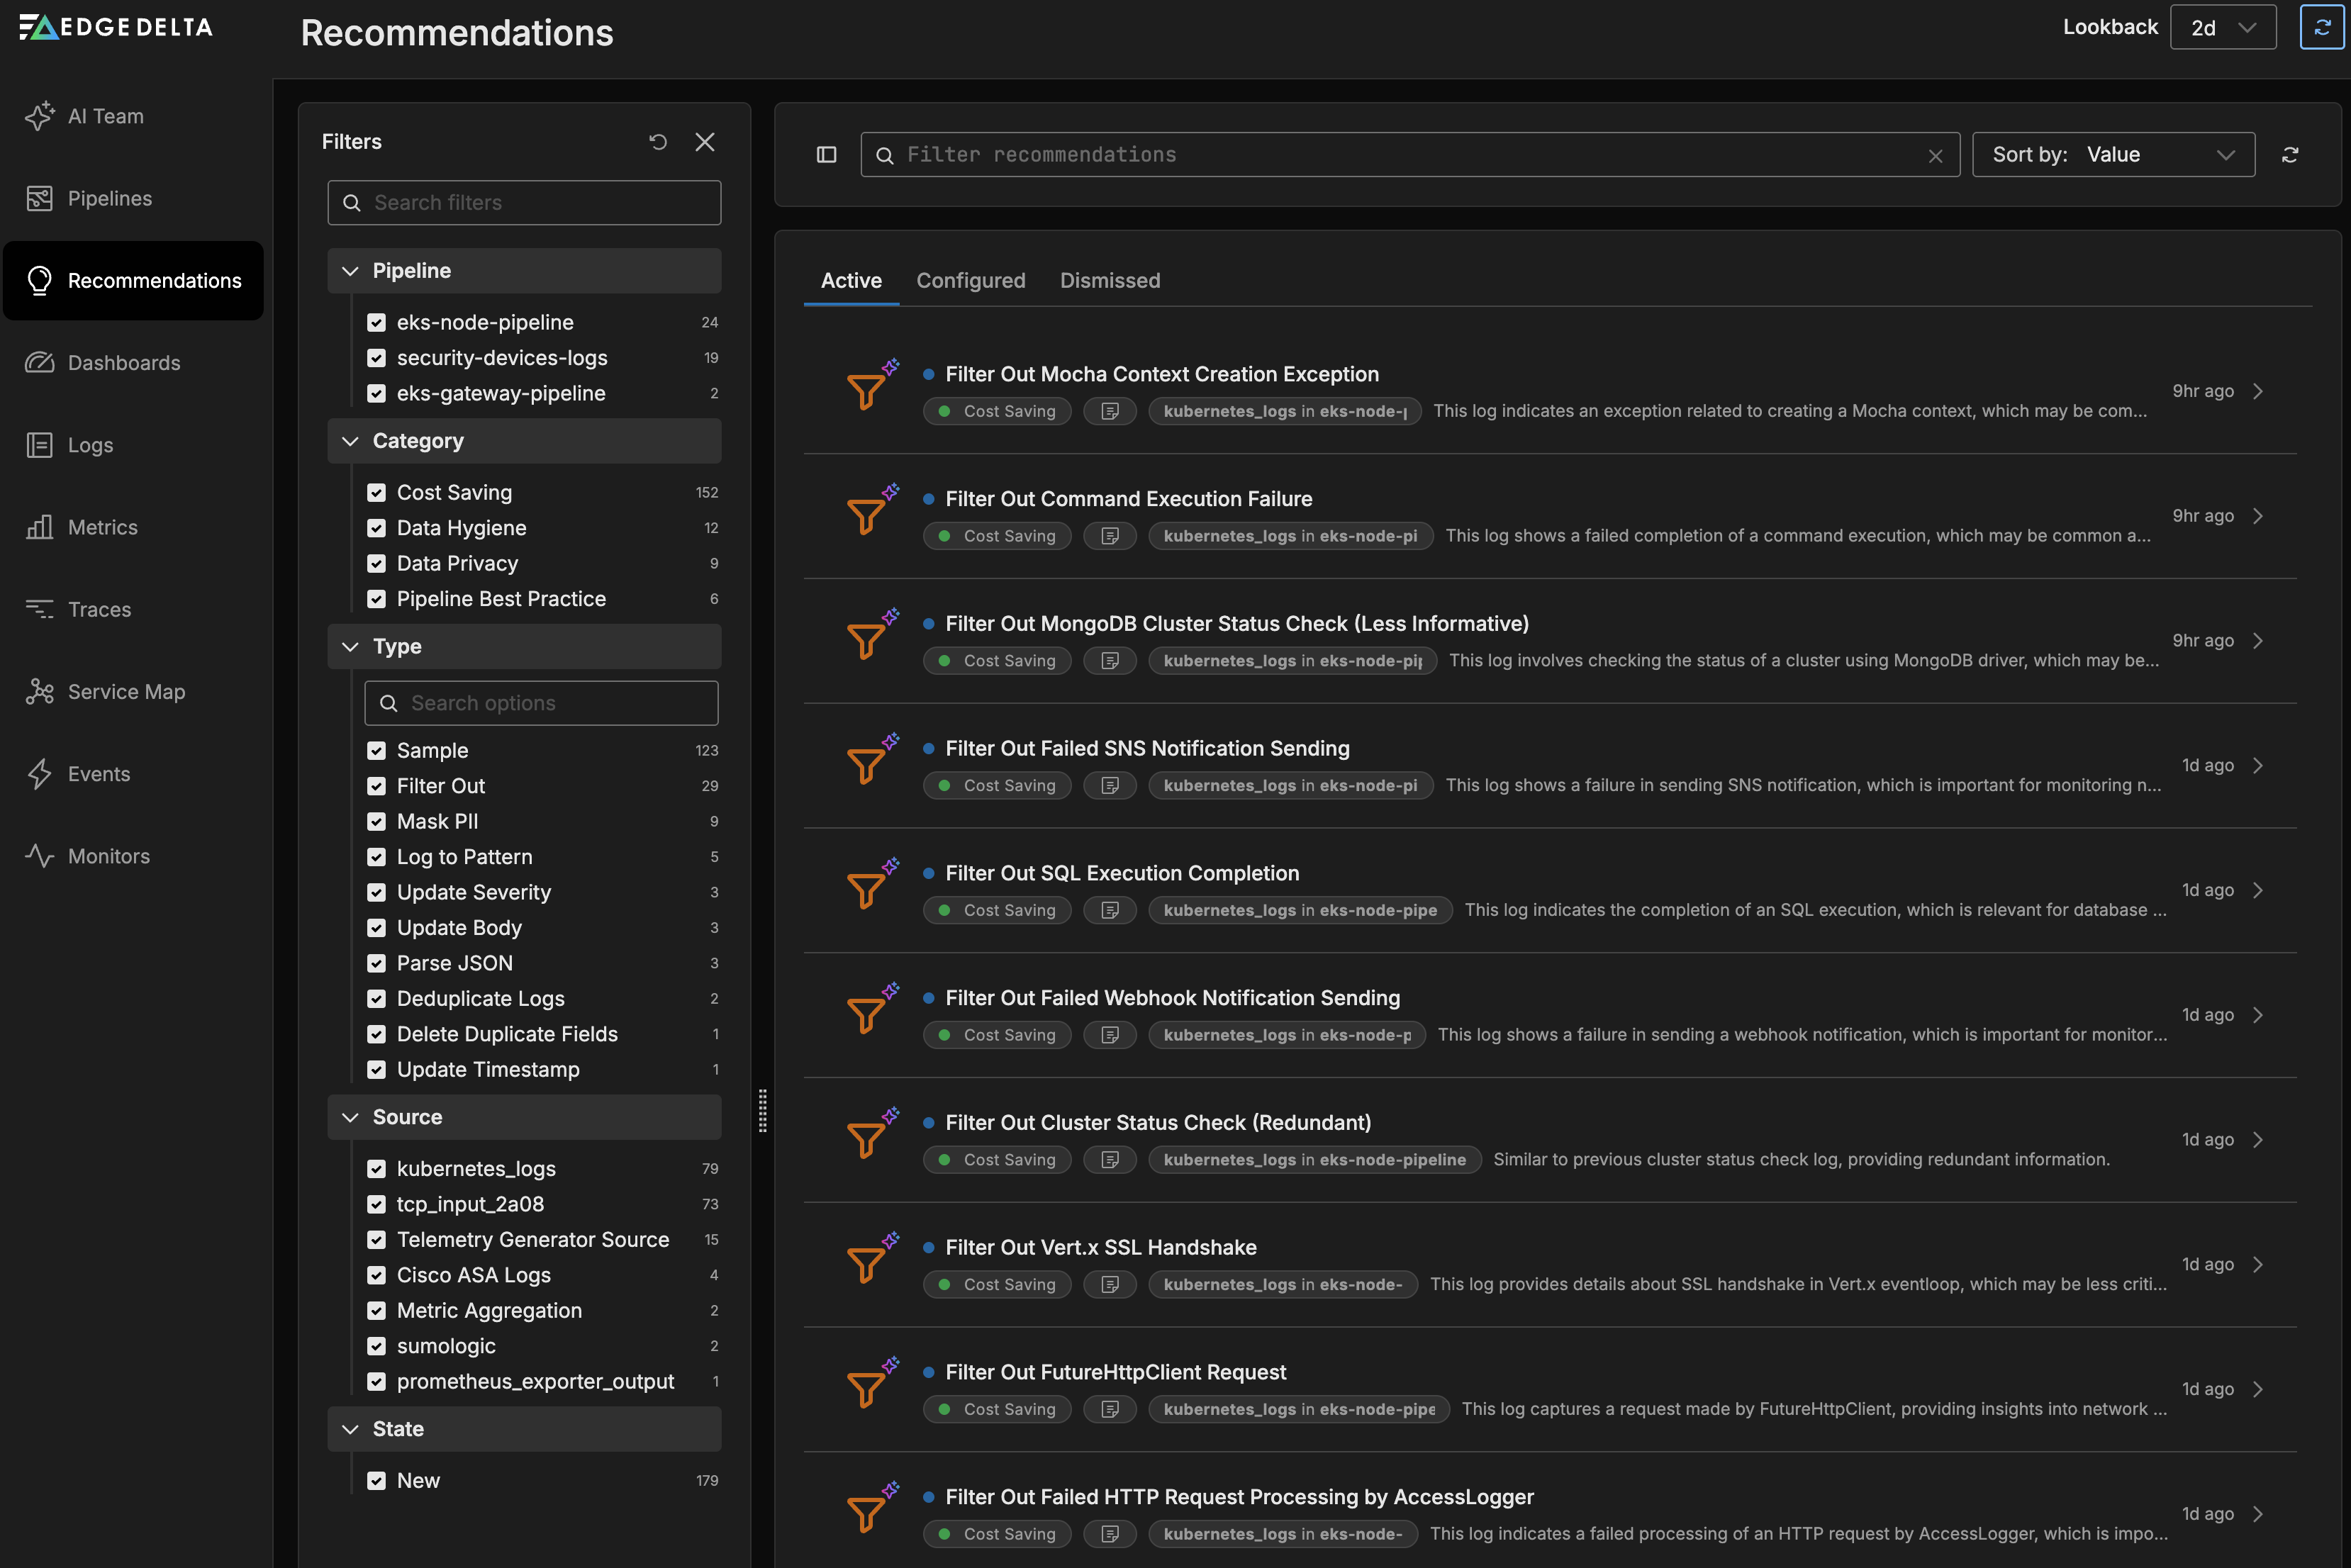
The Recommendations page displays actionable insights organized by:
- Cost Saving: Recommendations to reduce data volume and associated costs
- Data Hygiene: Suggestions for parsing, deduplicating, or cleaning data
- Best Practice: Implementation of recommended processors and configurations
- Privacy: PII masking and data security recommendations
Each recommendation shows its potential impact and provides one-click implementation. See here for more information.
Key Recommendations Features
- Automatic pattern analysis: AI evaluates log patterns representing at least 1% of traffic
- Value-based sorting: Recommendations are prioritized by potential impact
- One-click implementation: Automatically creates and configures processors
- Live preview: Test recommendations before deployment using Live Capture
To enable pattern-based recommendations, ensure your pipeline includes a Log to Pattern processor.
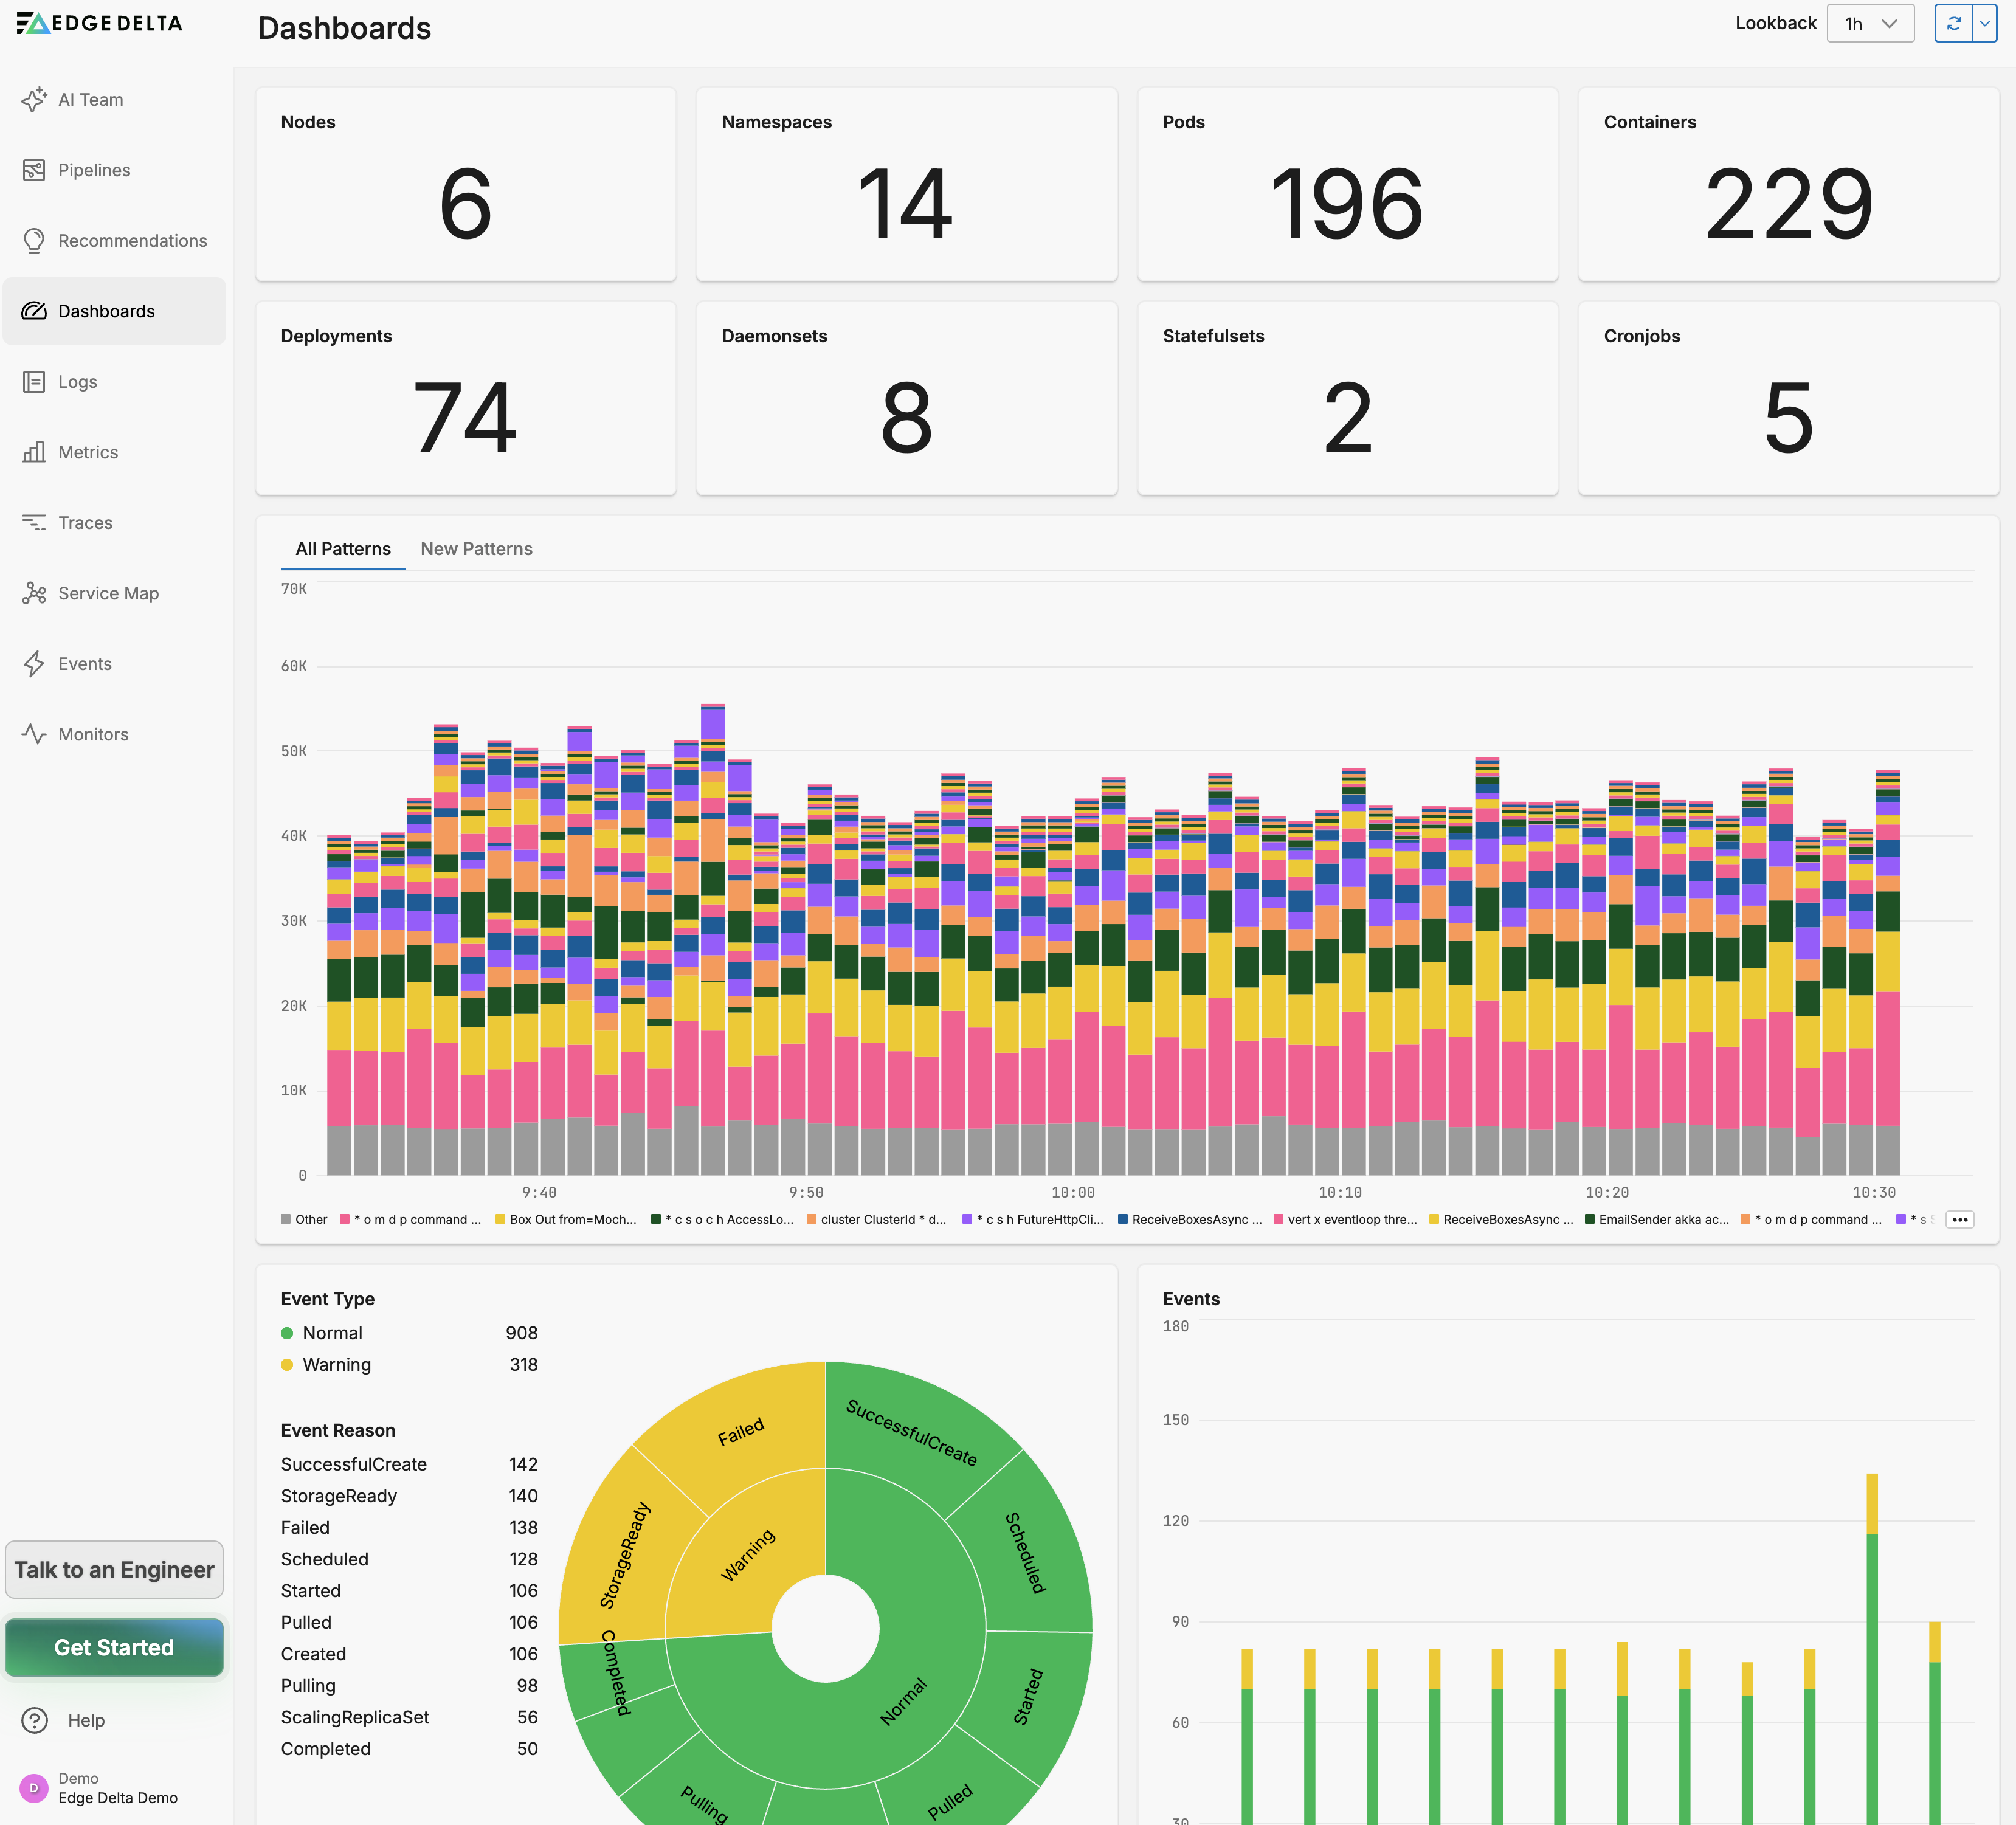
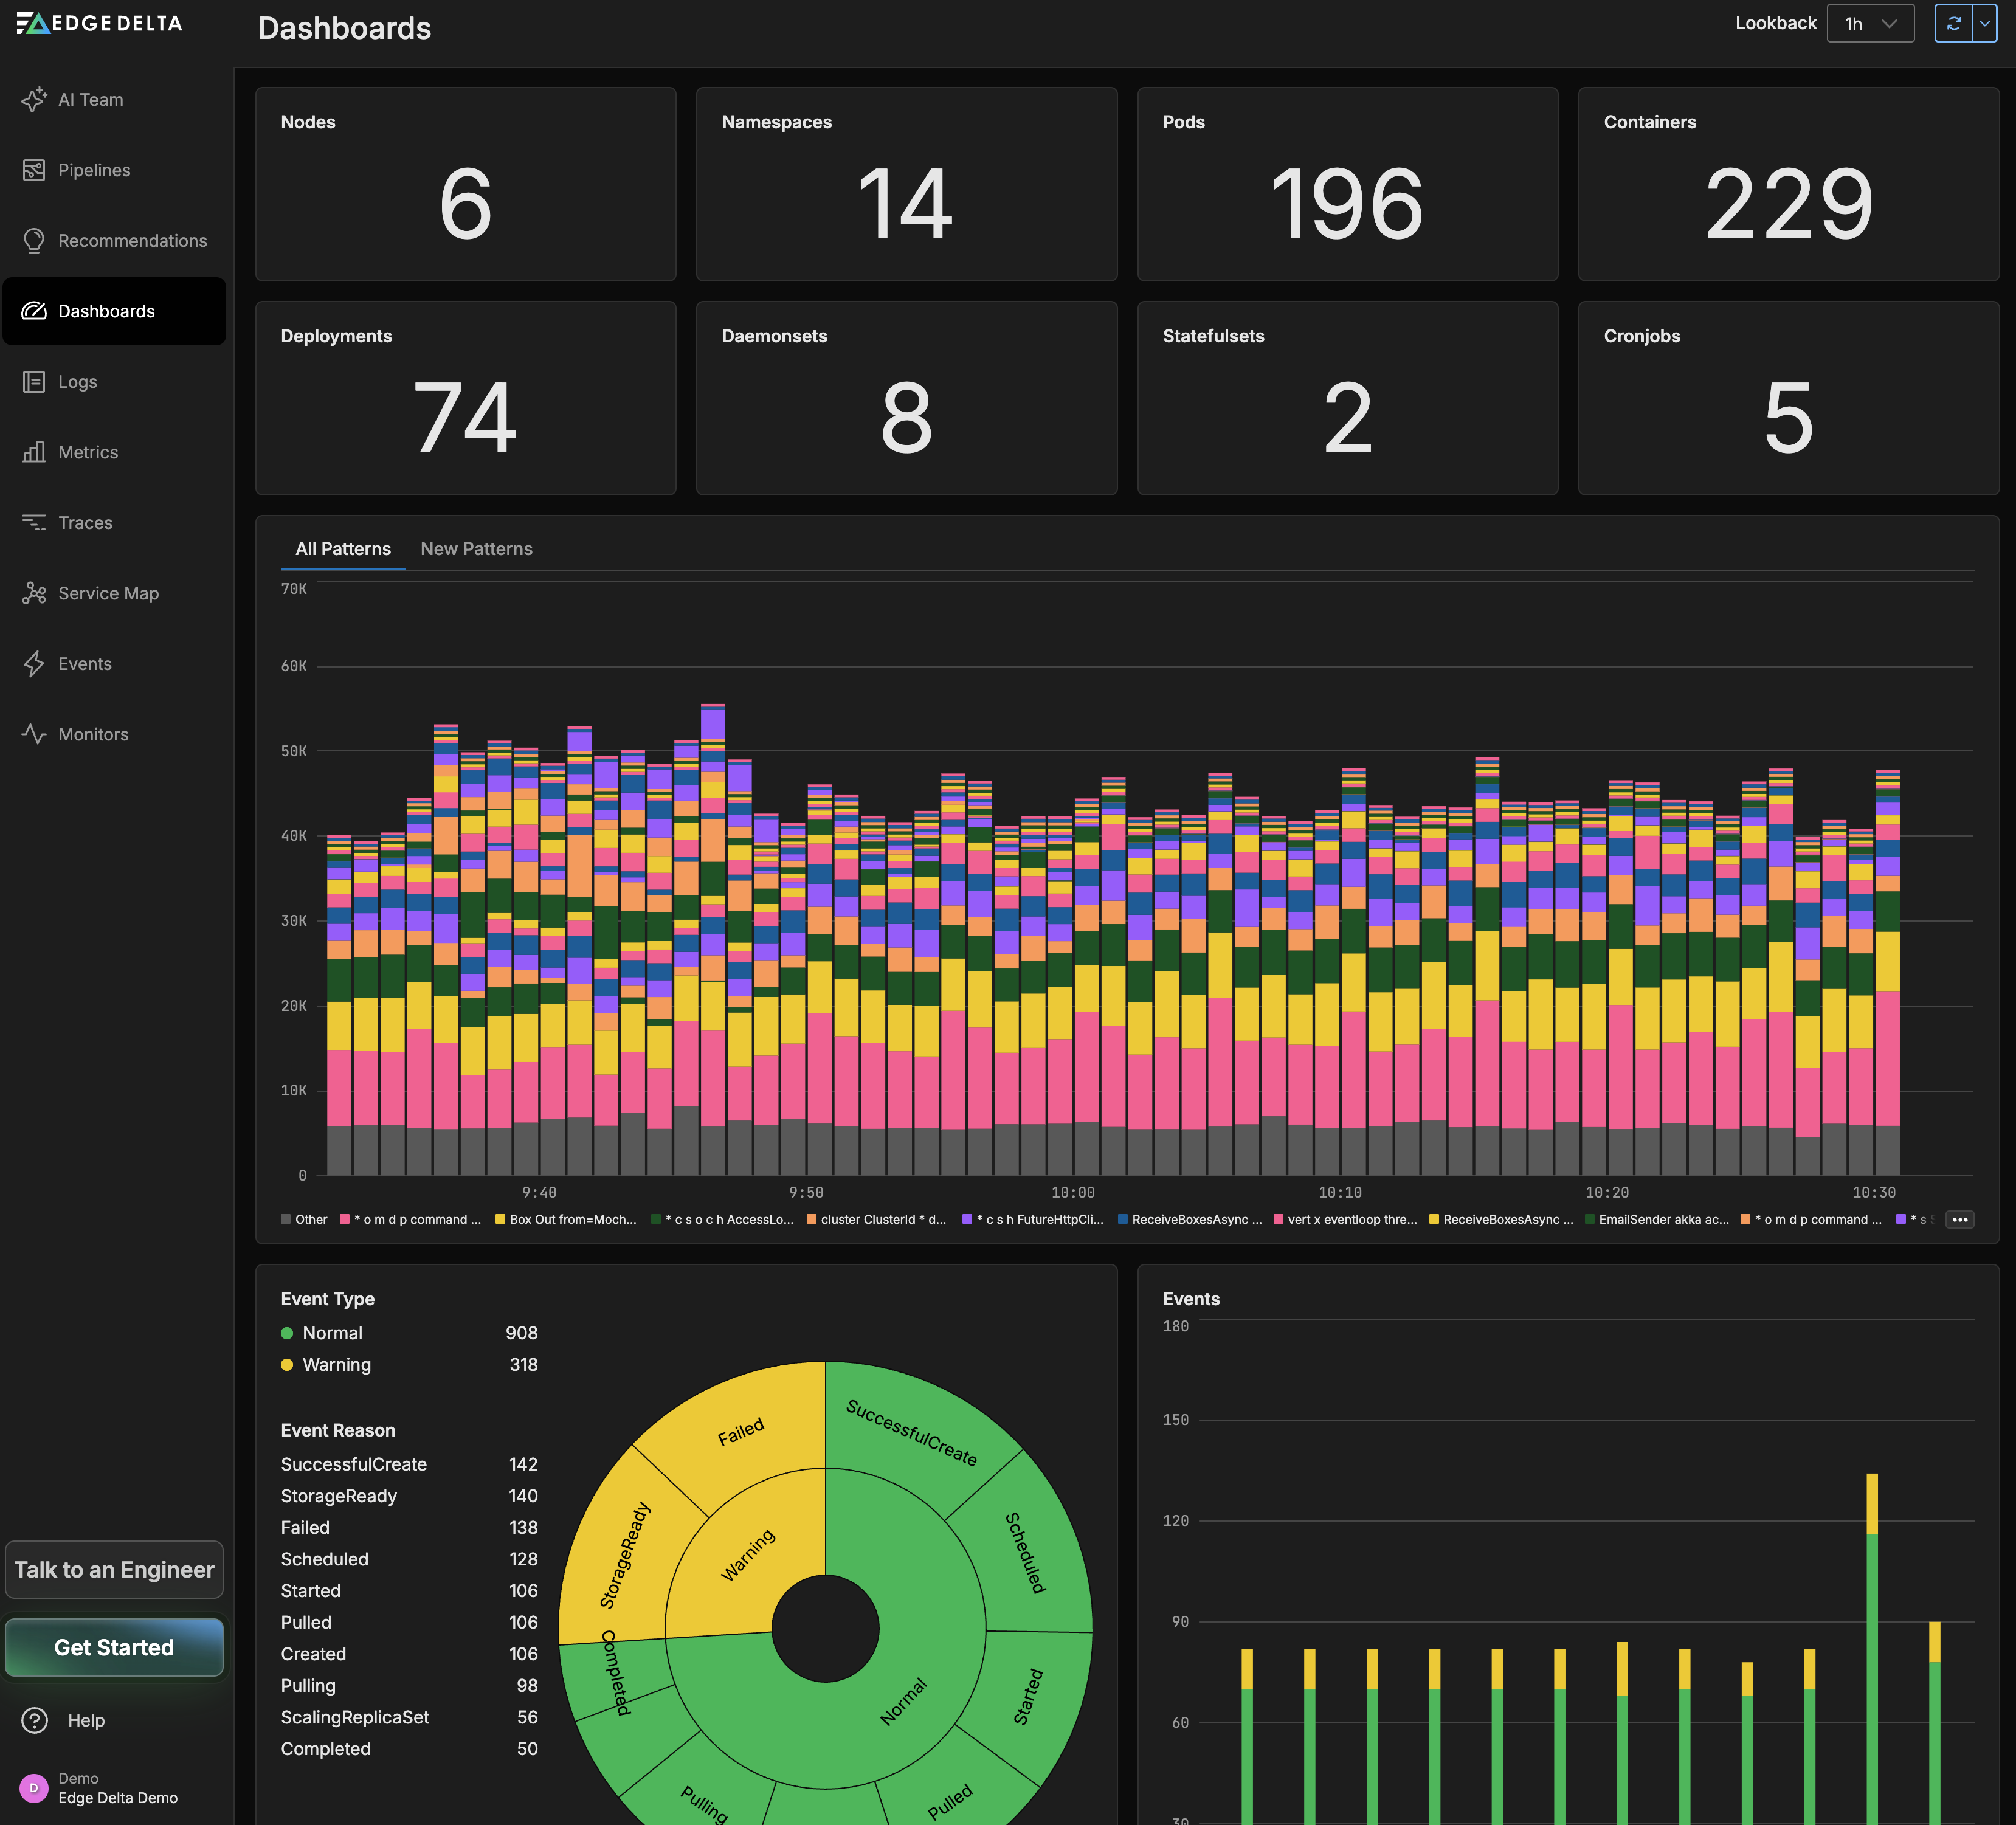
Dashboards
Click Dashboard and select the K8s Overview dash. It shows an overview of the Kubernetes components that are being monitored by the selected pipeline. See here for more information.
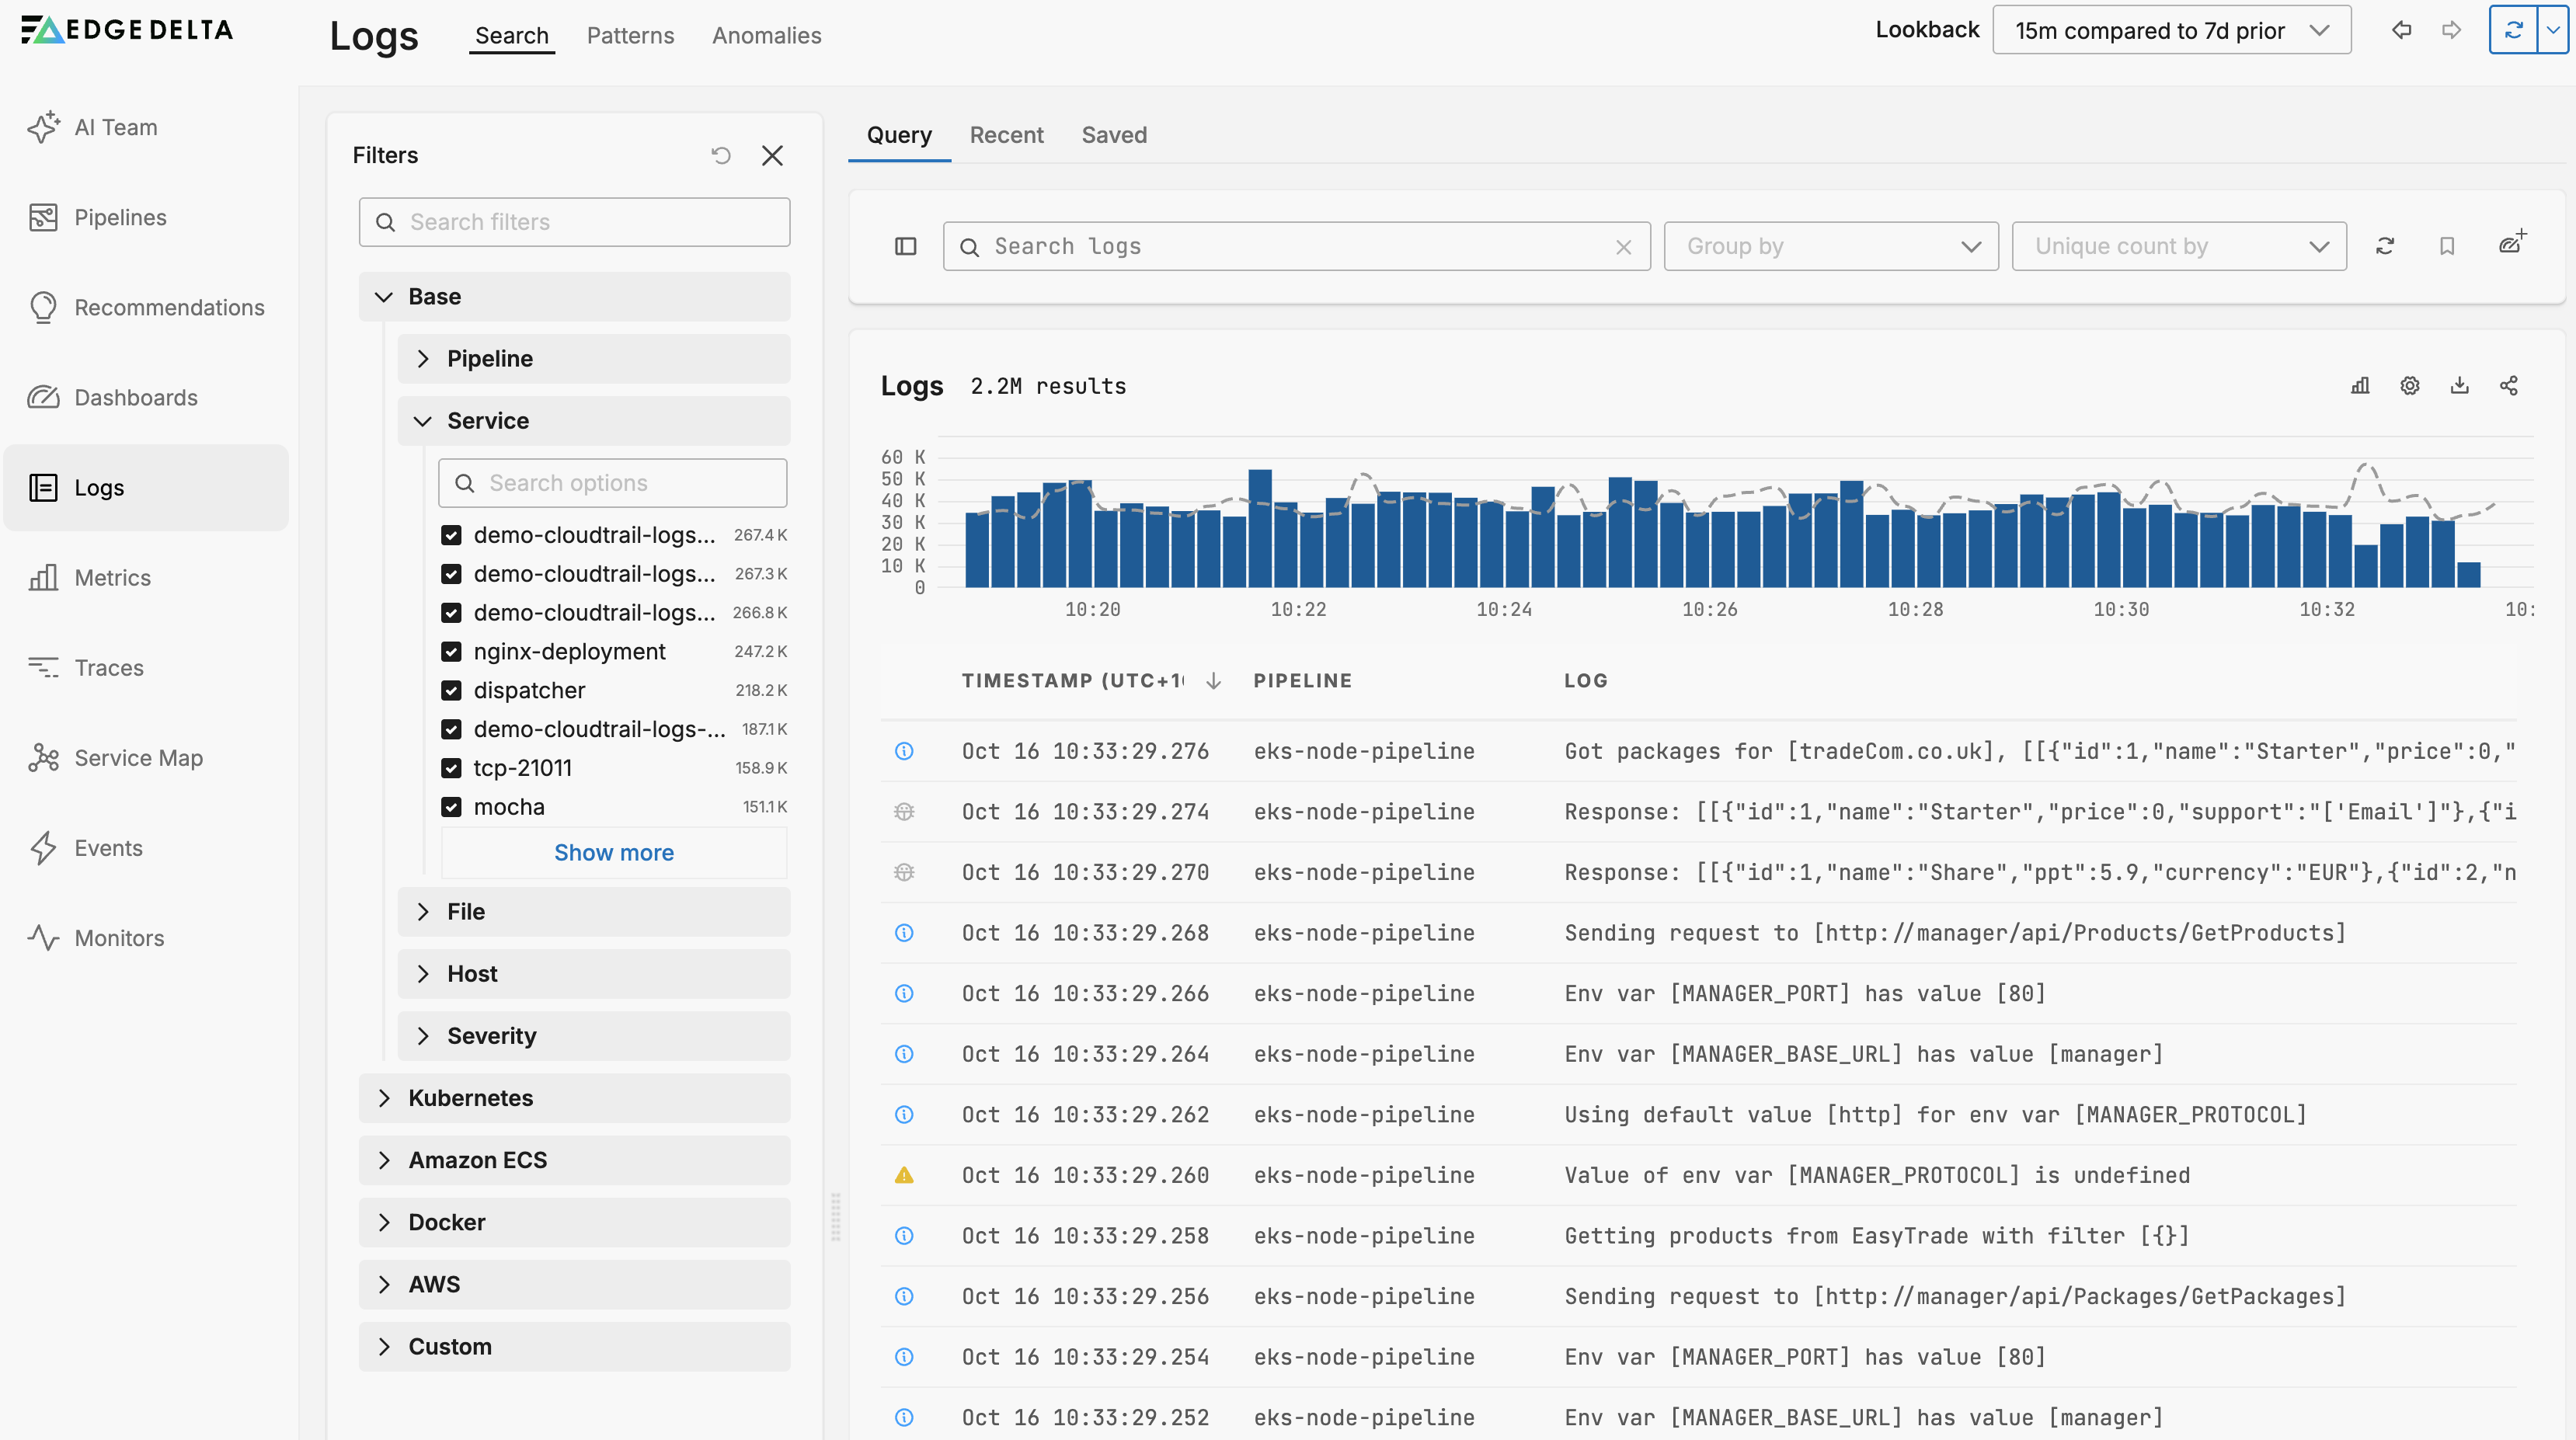
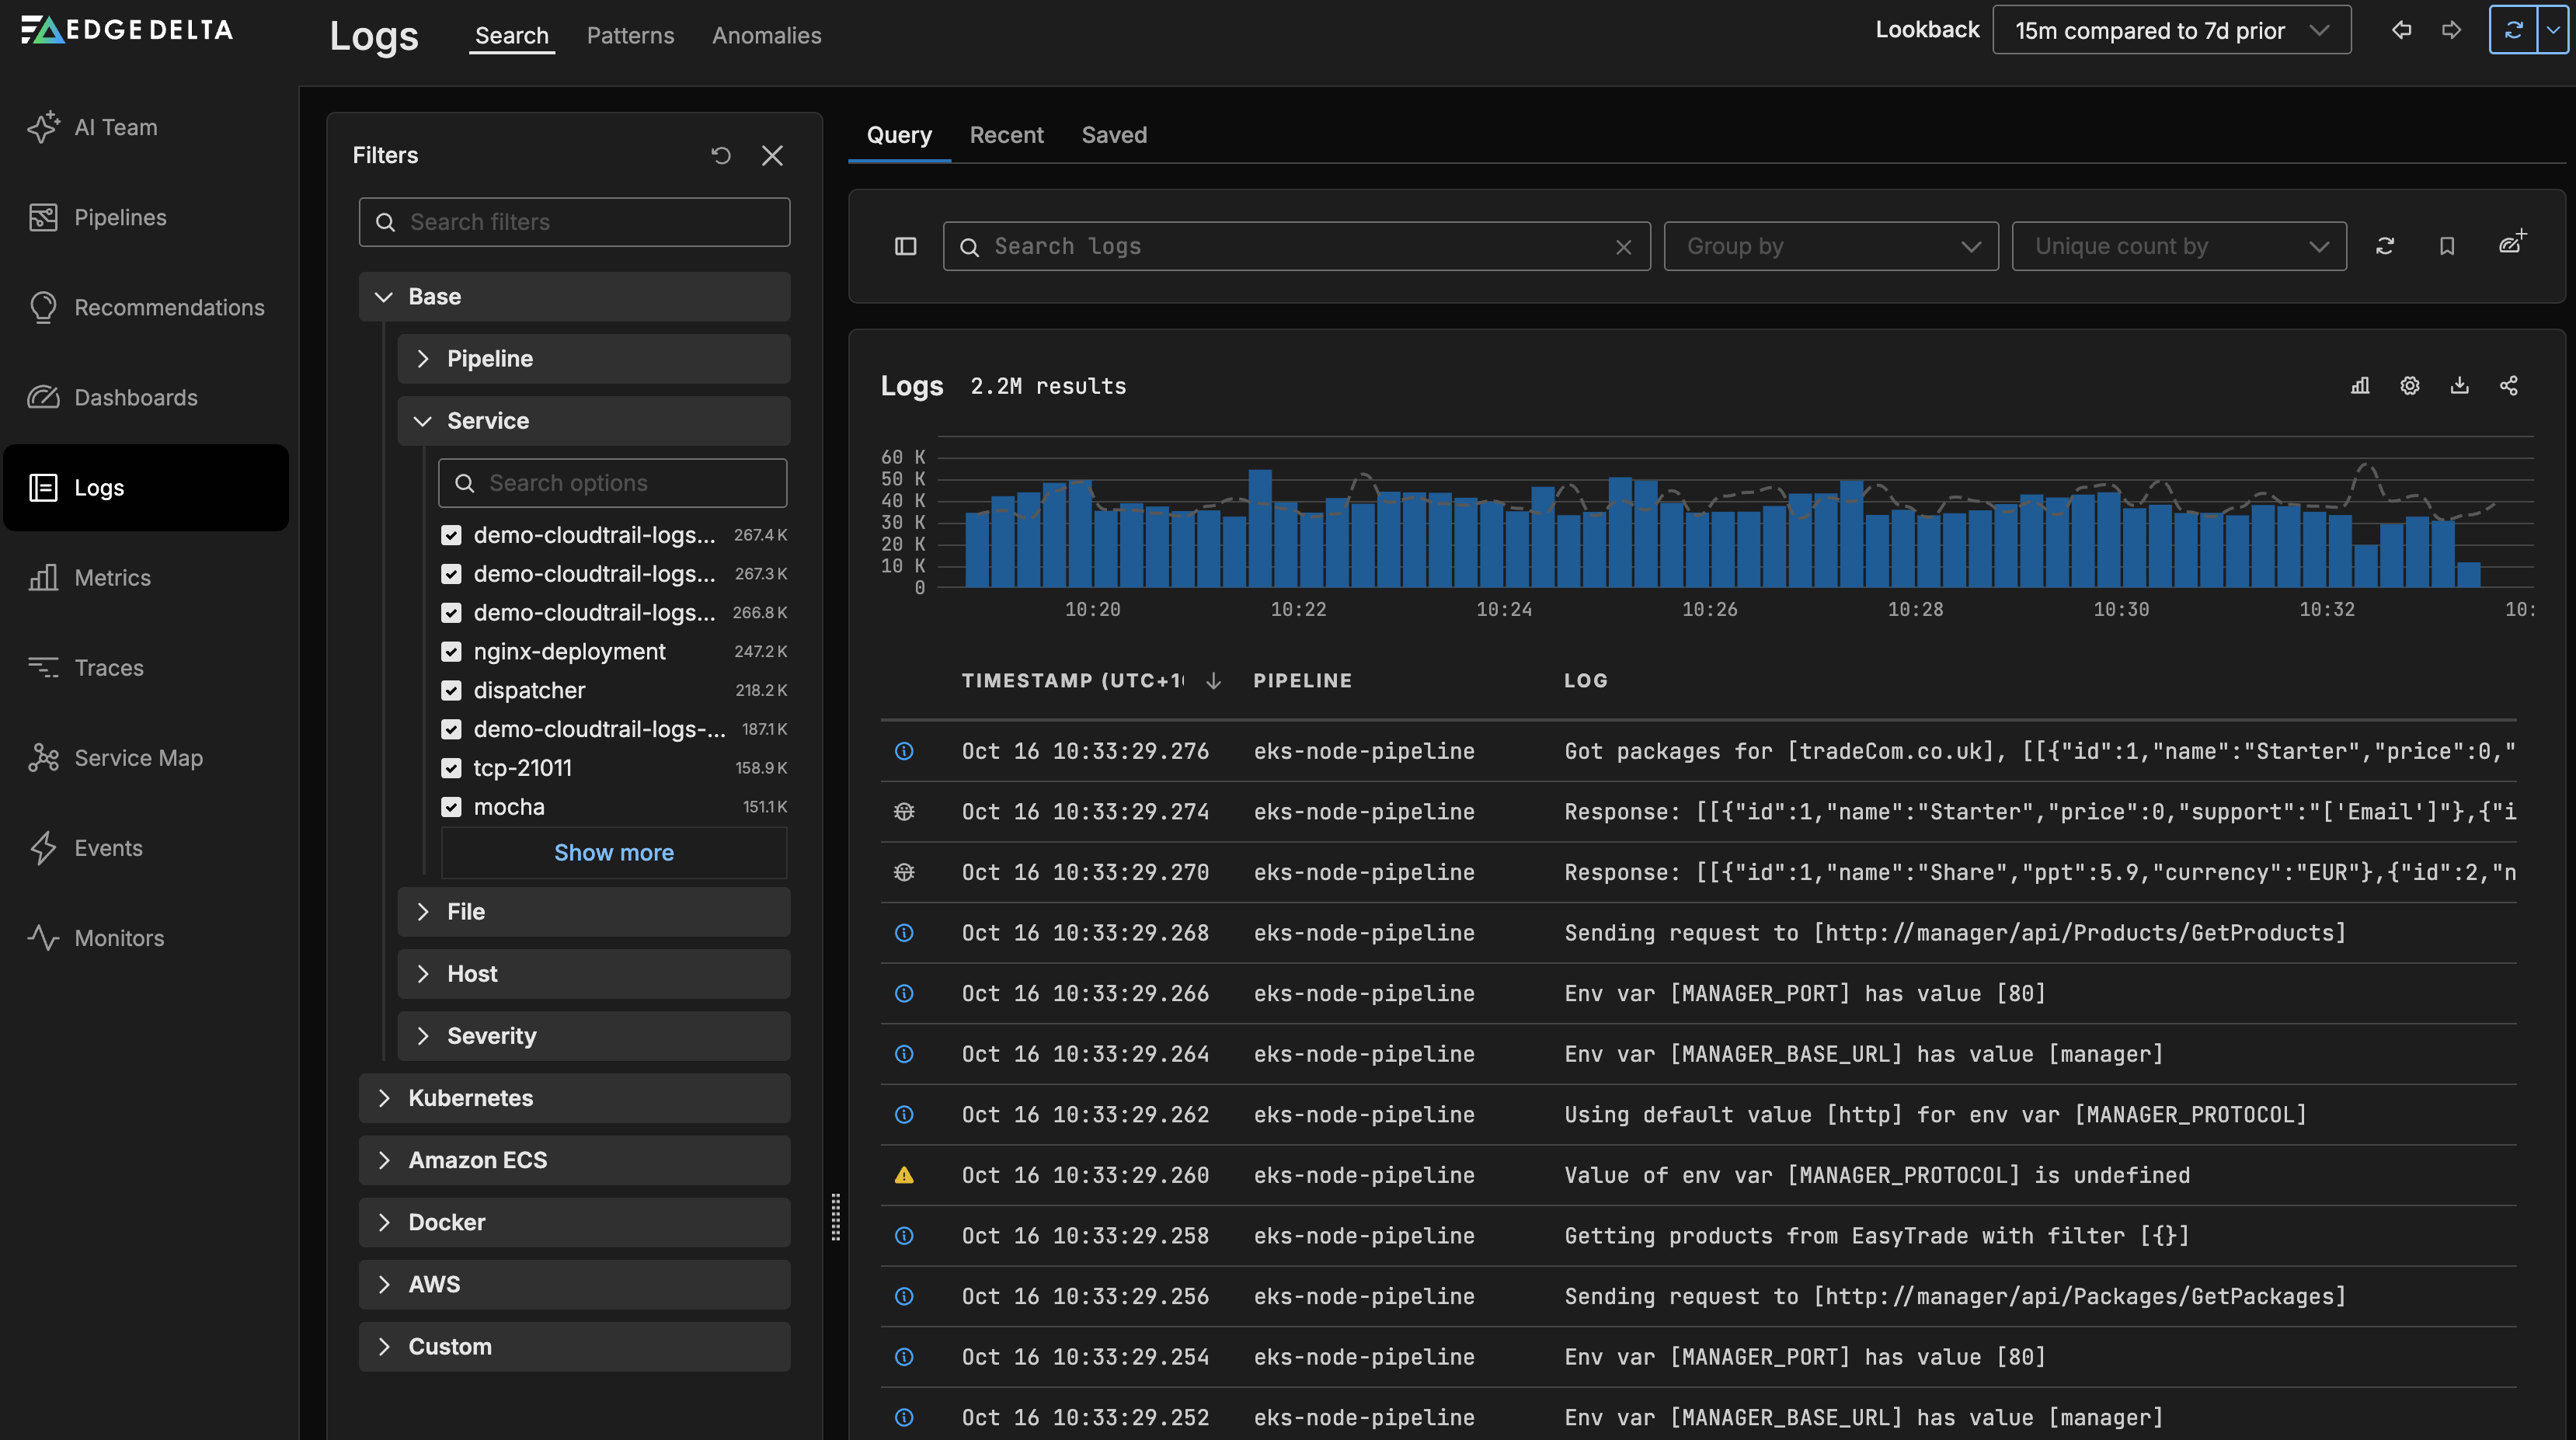
Logs
Click the Logs page. It opens on the Search tab. You can search for specific logs on this page. See here for more information.
Patterns
Click the Patterns tab. This page displays detected patterns including those with a negative sentiment. See here for more information.
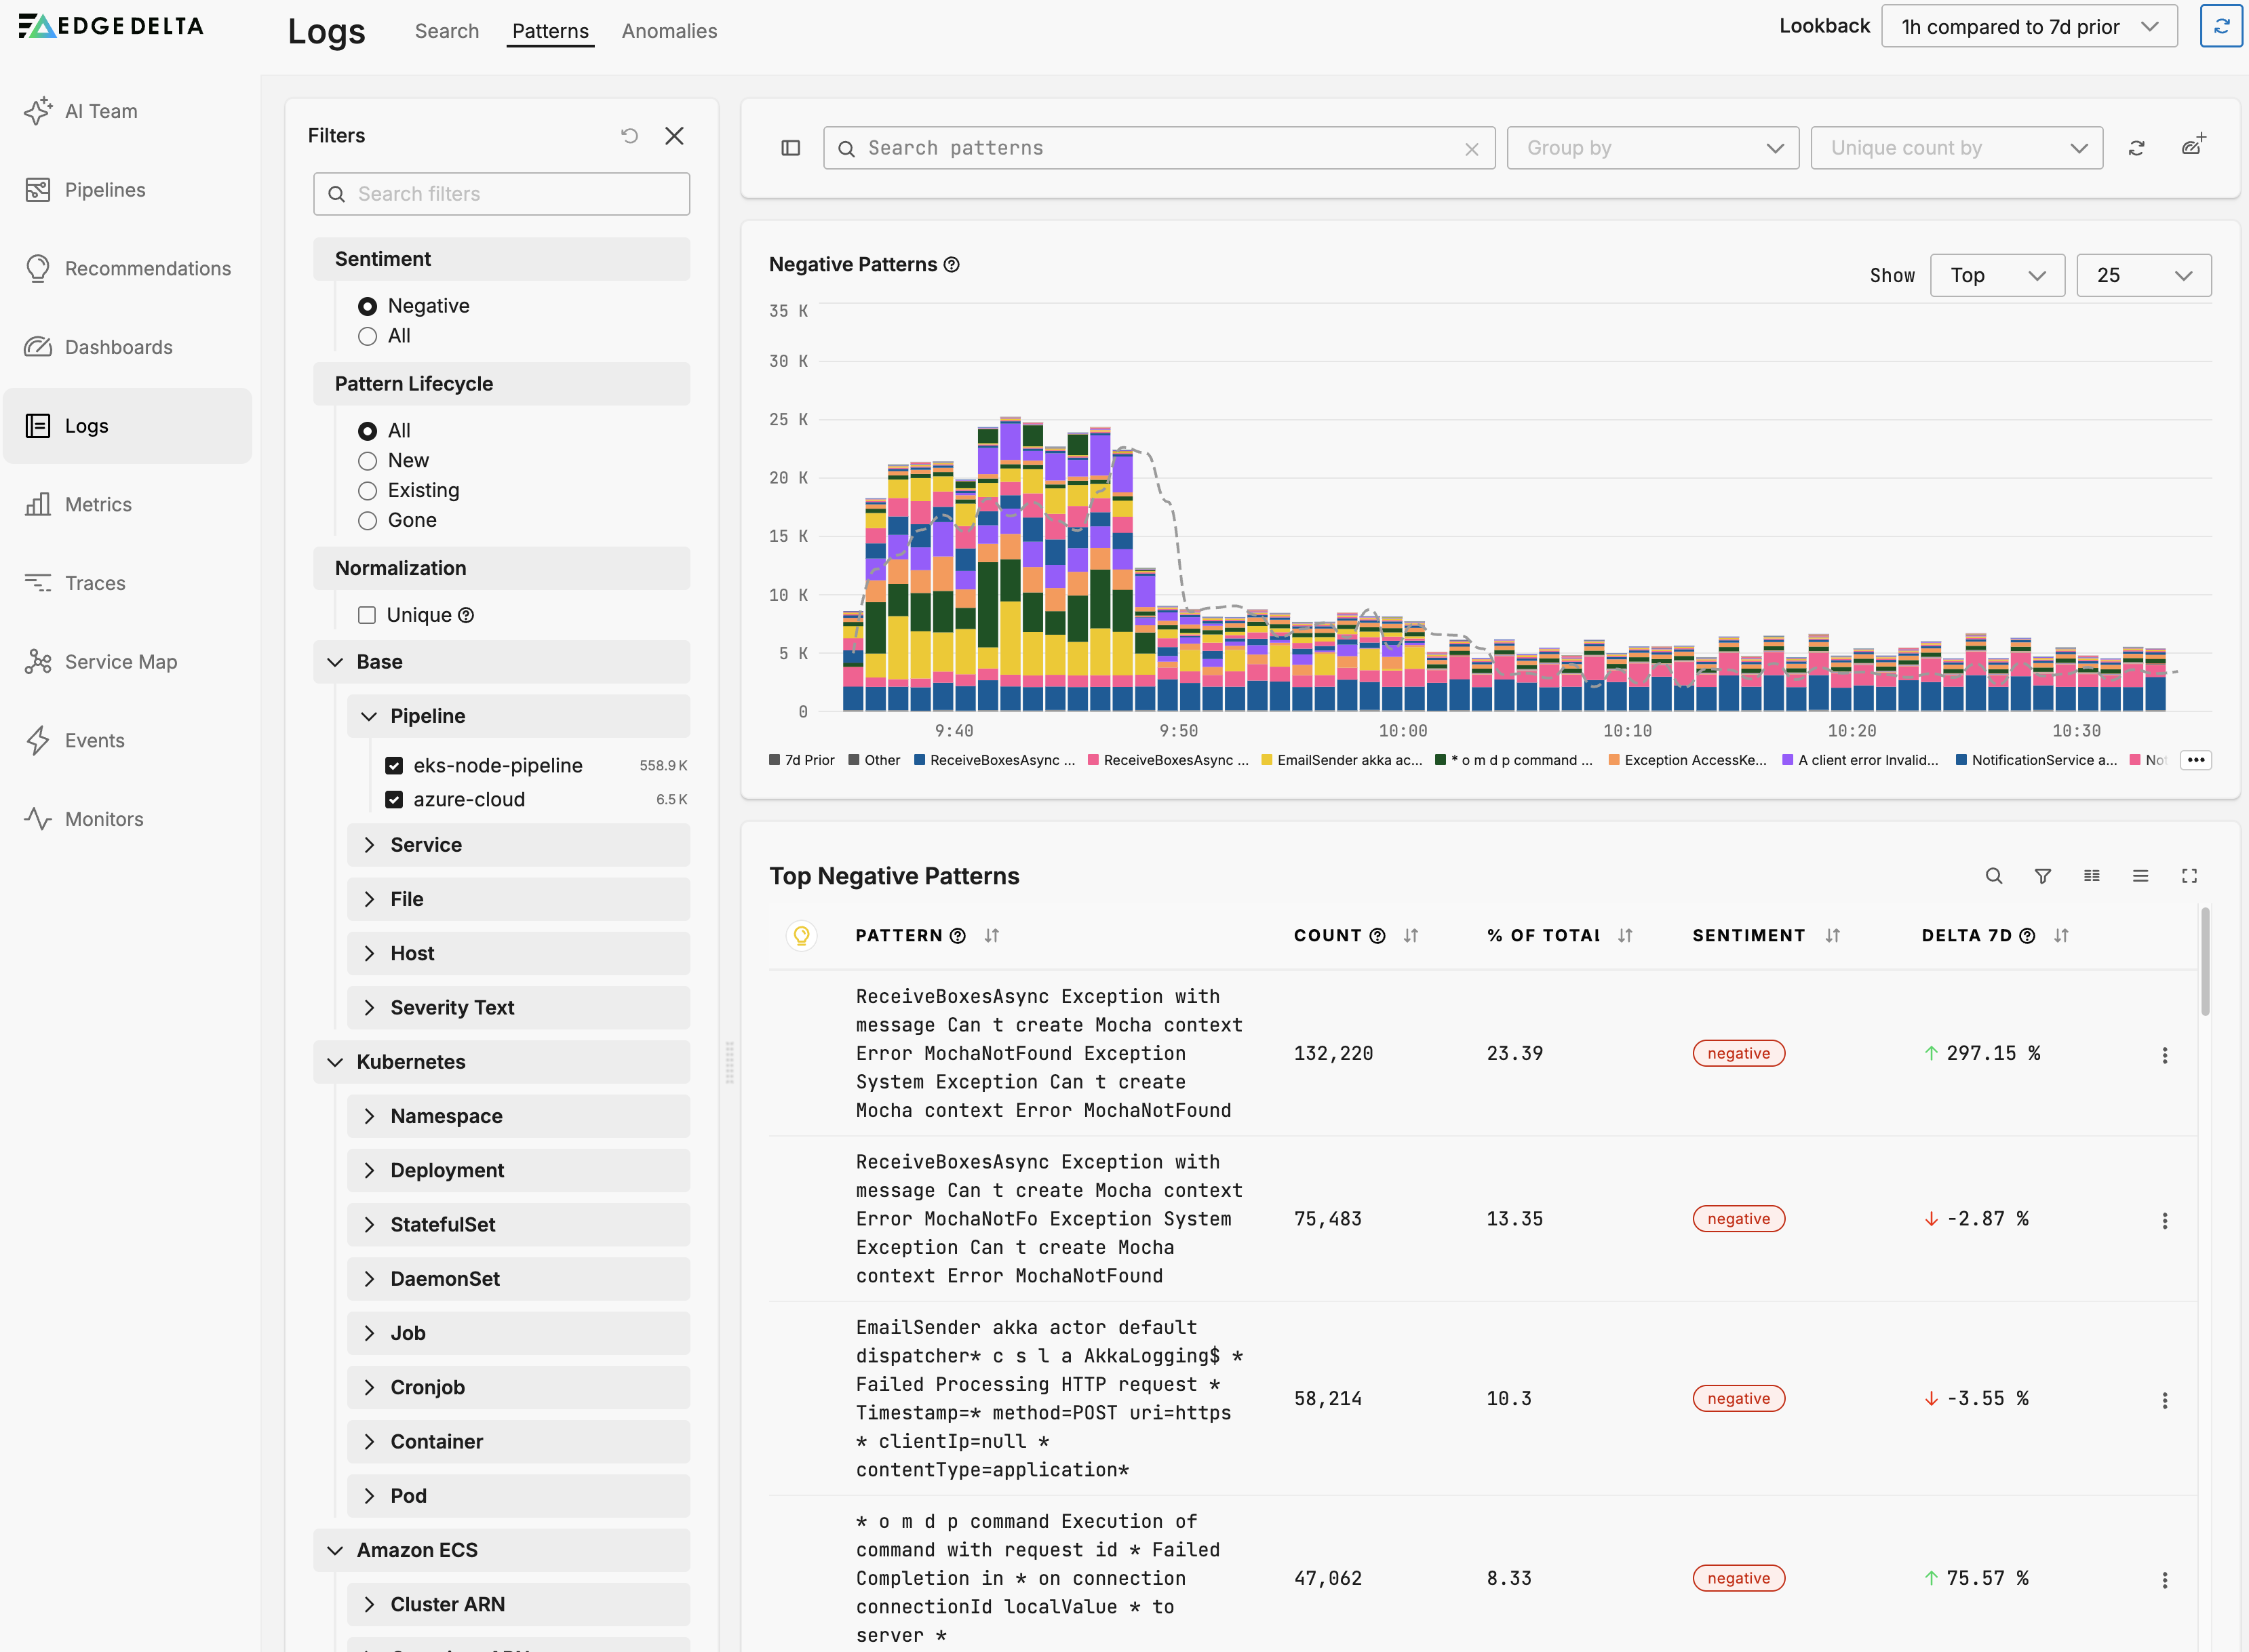
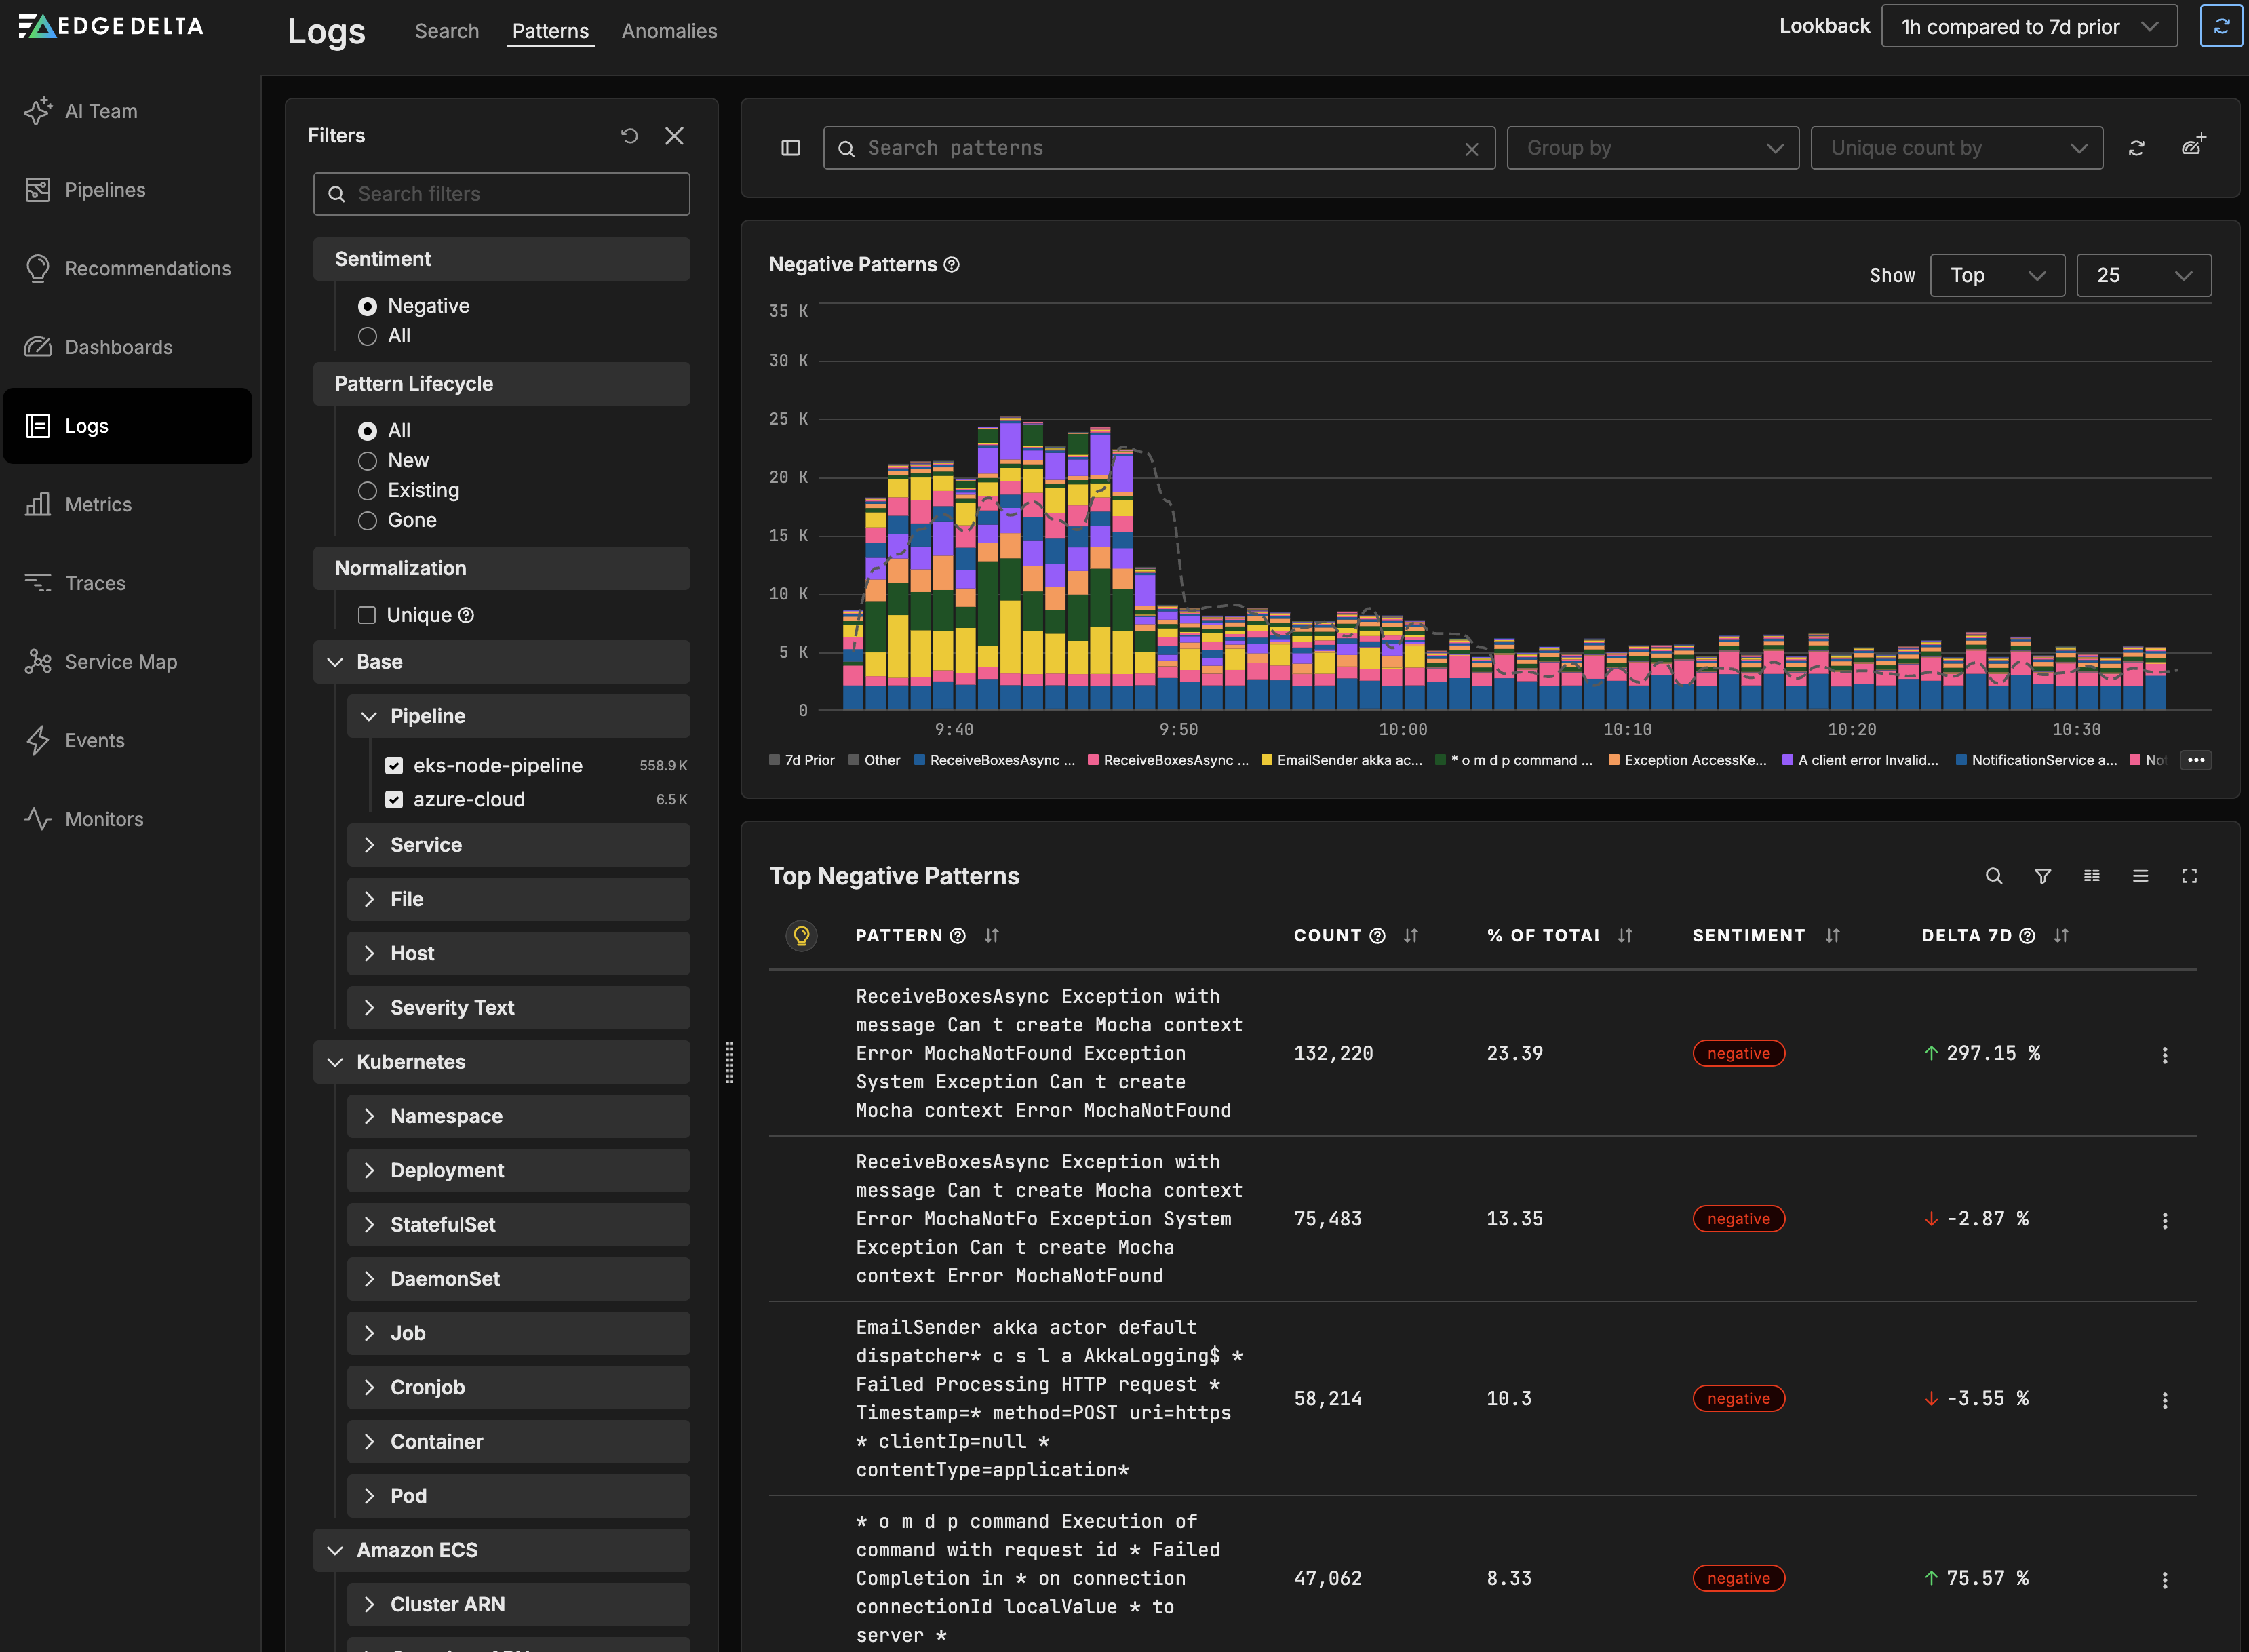
While the pipeline is still new there wont be anomalies yet on the Anomalies tab. Come back in a few hours after a baseline has been established if you want to view anomalies or you can see examples in the Play environment.
Anomalies
Click the Anomalies tab to view detected anomalies in your telemetry data. Edge Delta’s AI-powered anomaly detection automatically identifies unusual patterns and behaviors in your logs, metrics, and traces. See here for more information.
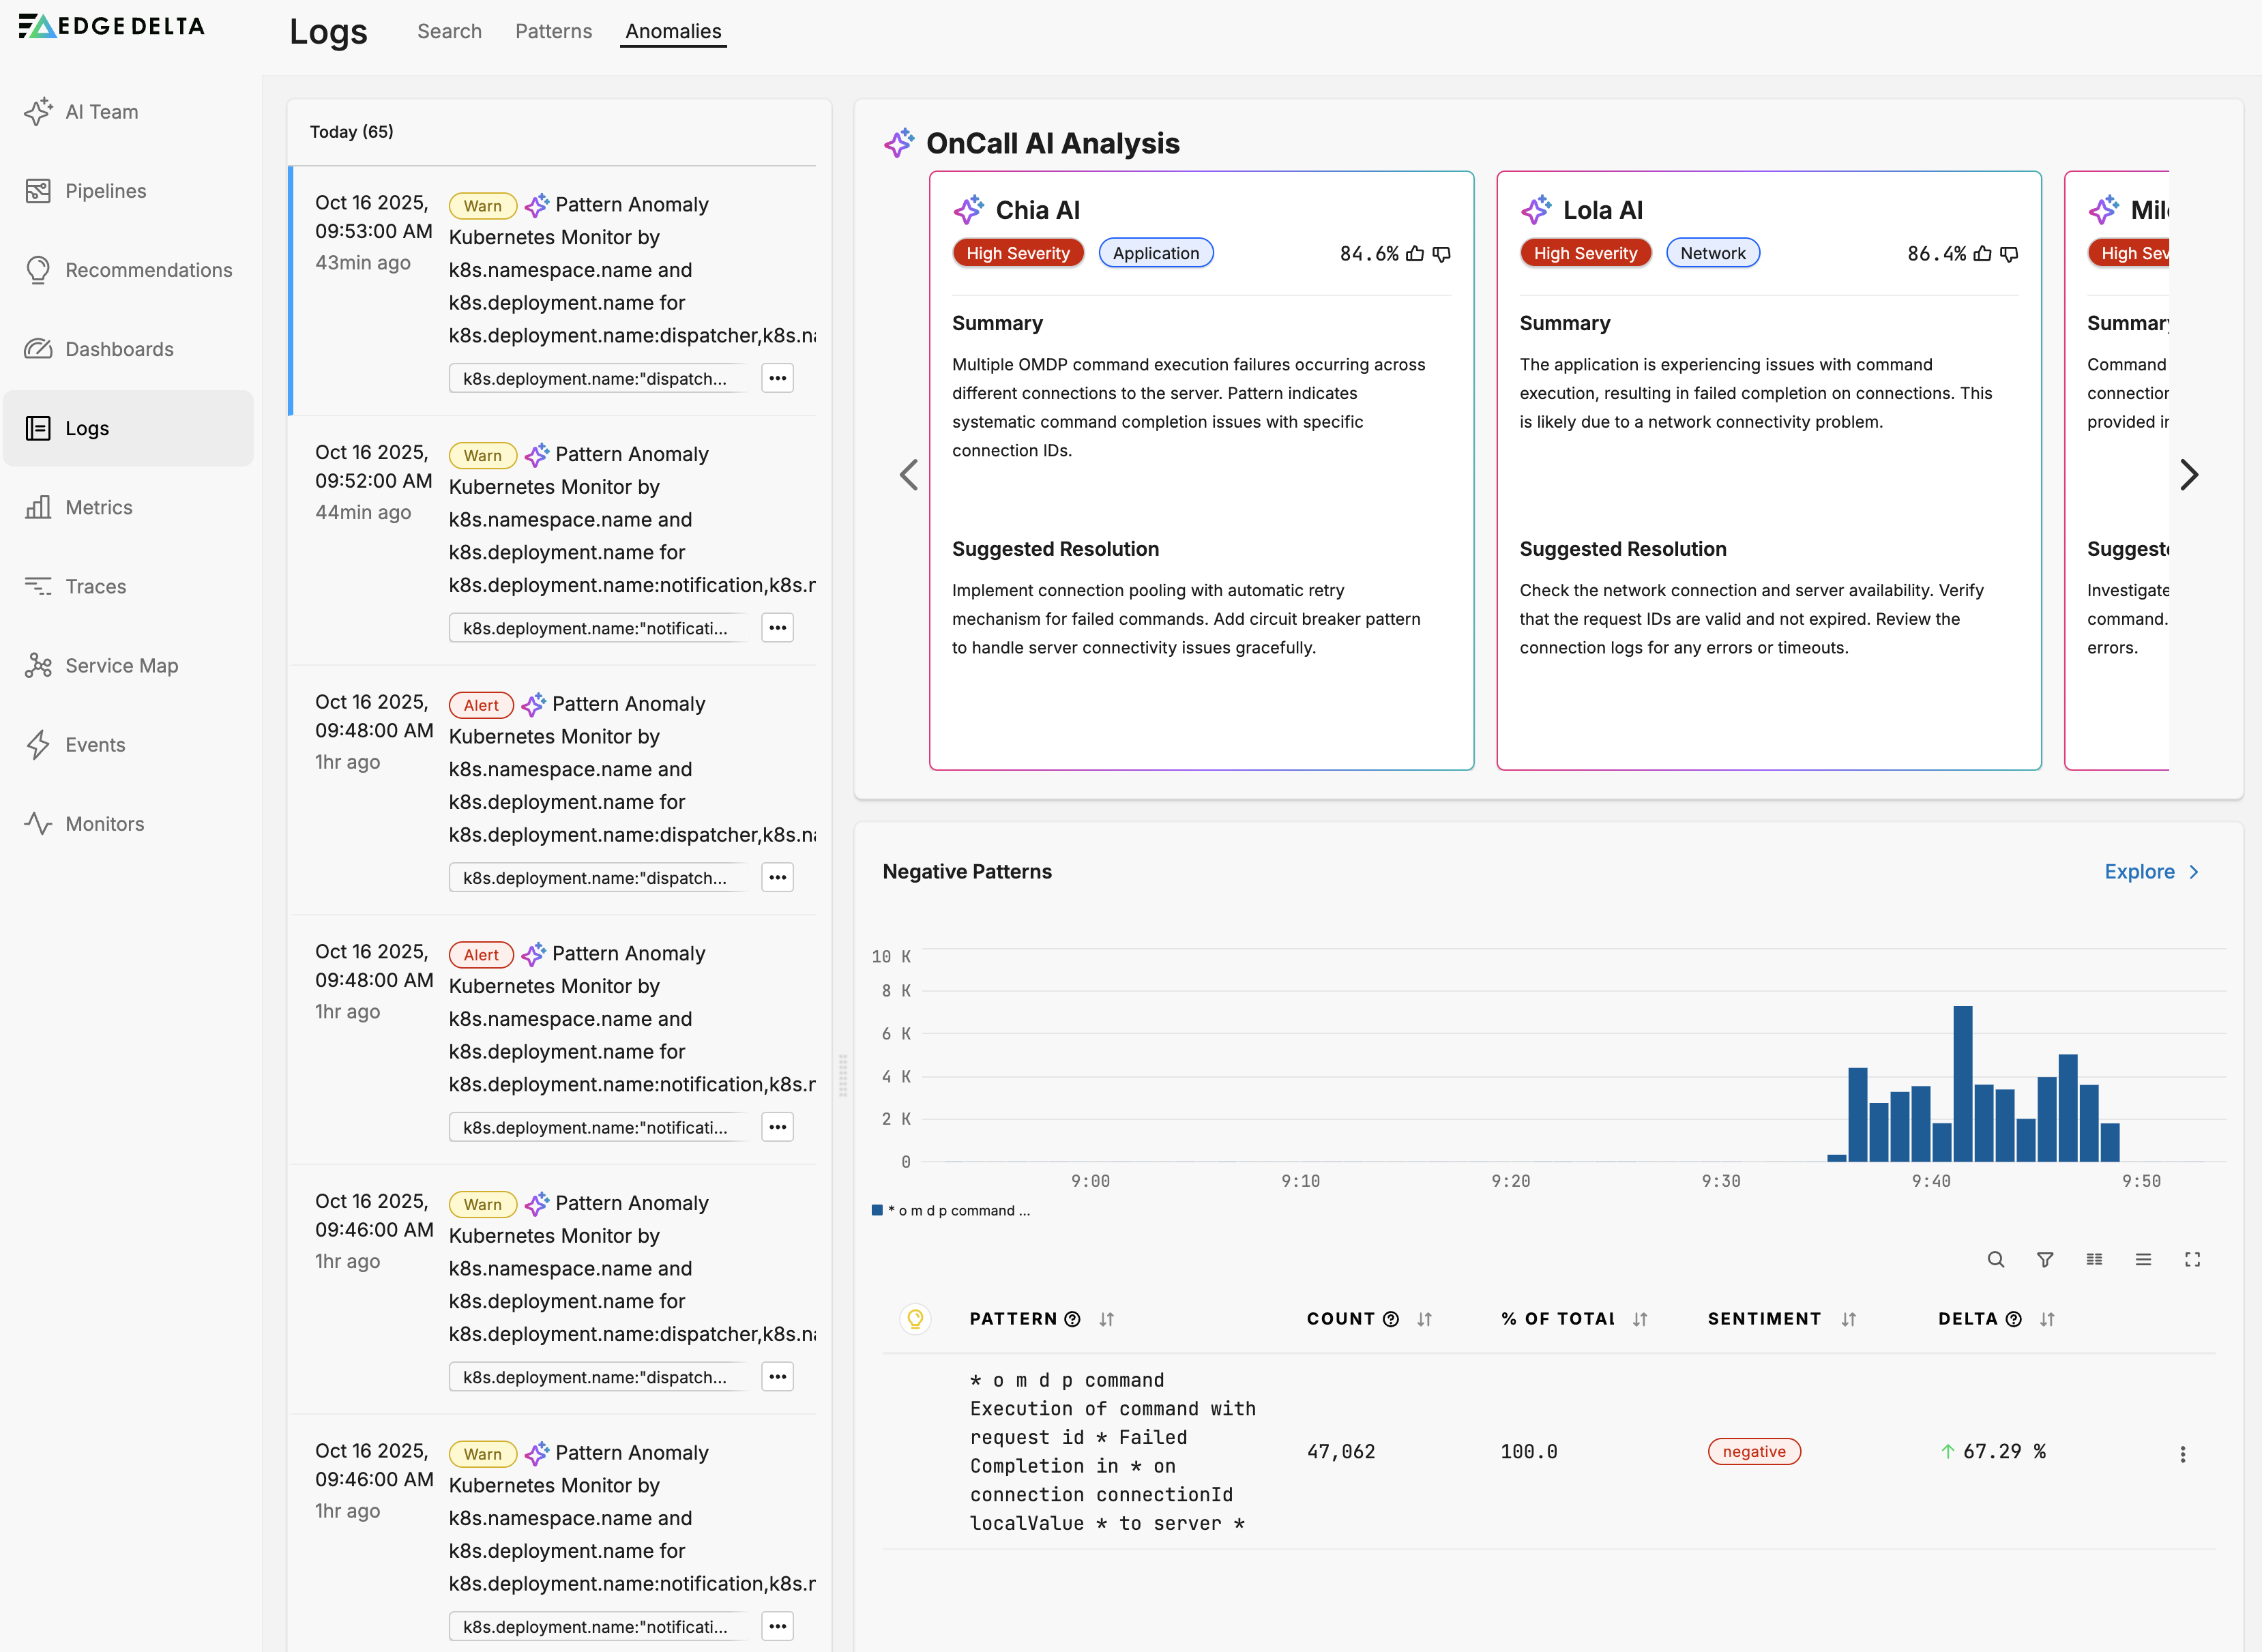
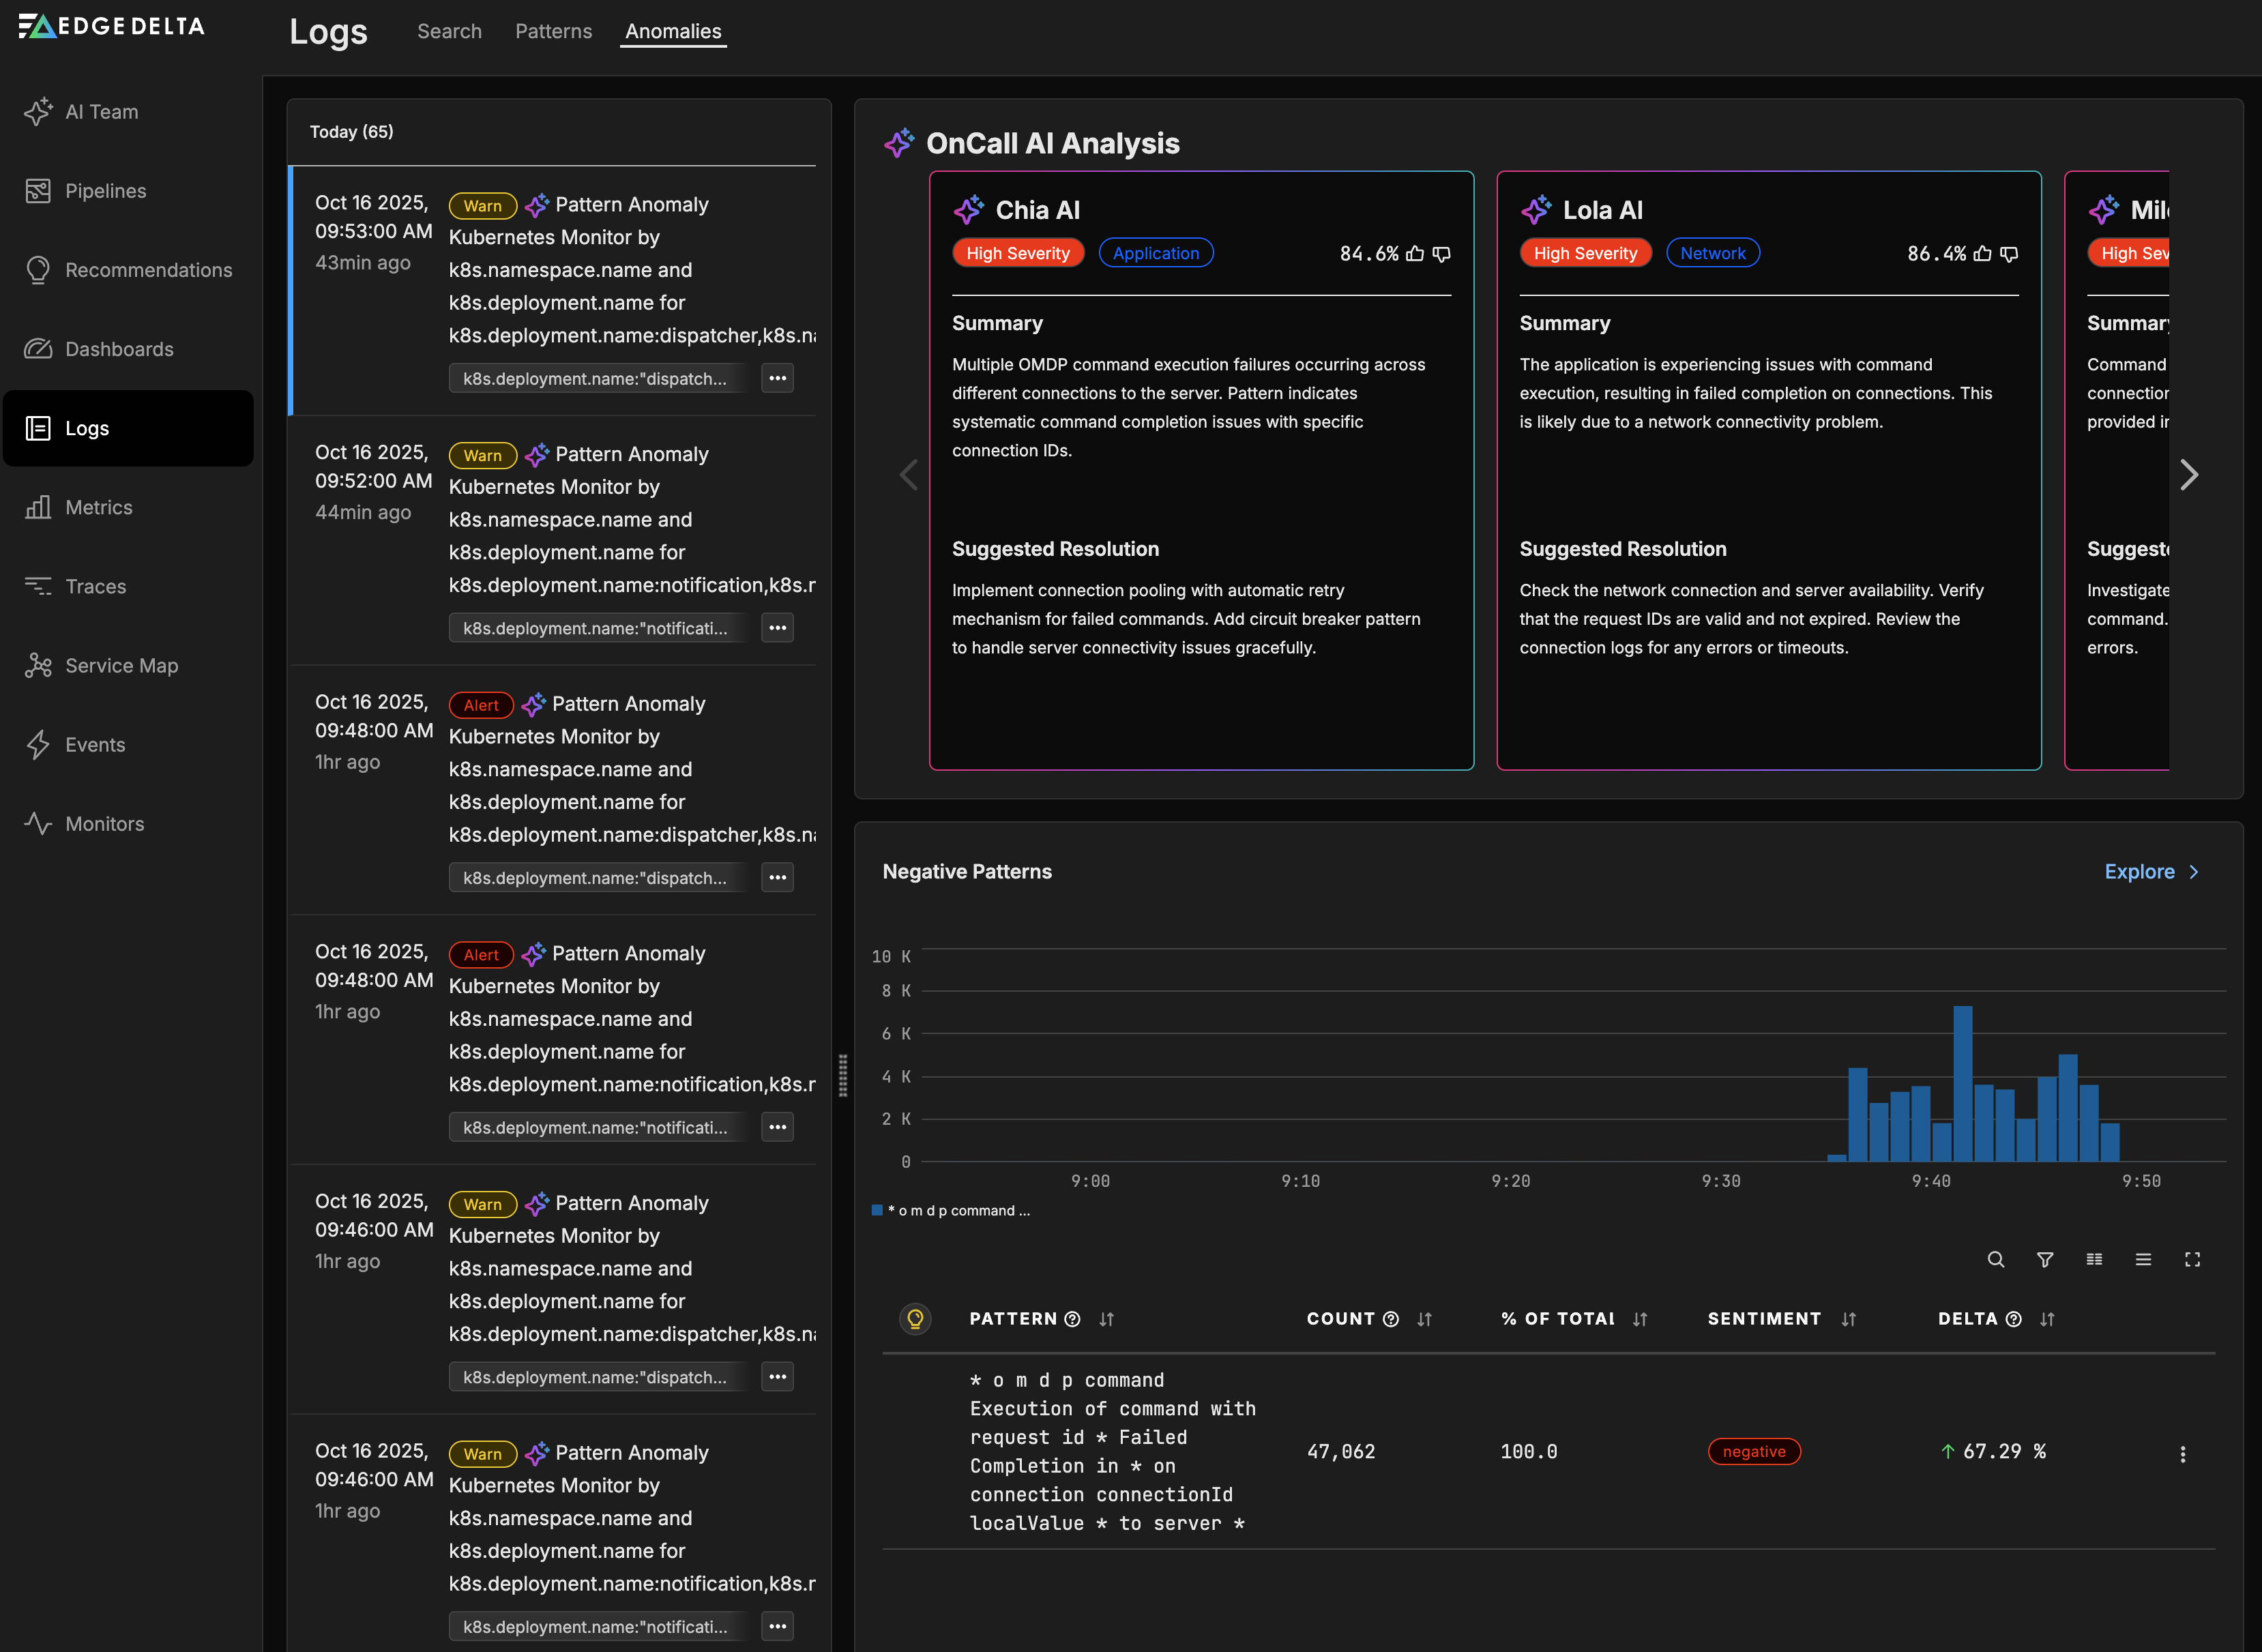
The Anomalies page features:
- OnCall AI Analysis: Get intelligent insights and recommended resolutions for detected anomalies
- AI Teammates: Specialized AI agents (Chia AI, Lola AI, Milo AI) analyze anomalies from different perspectives
- Pattern Analysis: Automatic detection of unusual log patterns and sentiment shifts
- Baseline Comparison: Anomalies are identified by comparing current behavior against established baselines
OnCall AI can help you understand anomalies by:
- Analyzing the root cause and potential impact
- Providing step-by-step resolution recommendations
- Correlating anomalies across logs, metrics, and traces
- Suggesting preventive measures for future occurrences
Note: You can also use the newer AI Team page instead of the Anomalies tab for a more comprehensive AI-powered analysis experience with enhanced collaboration features and tool integrations.
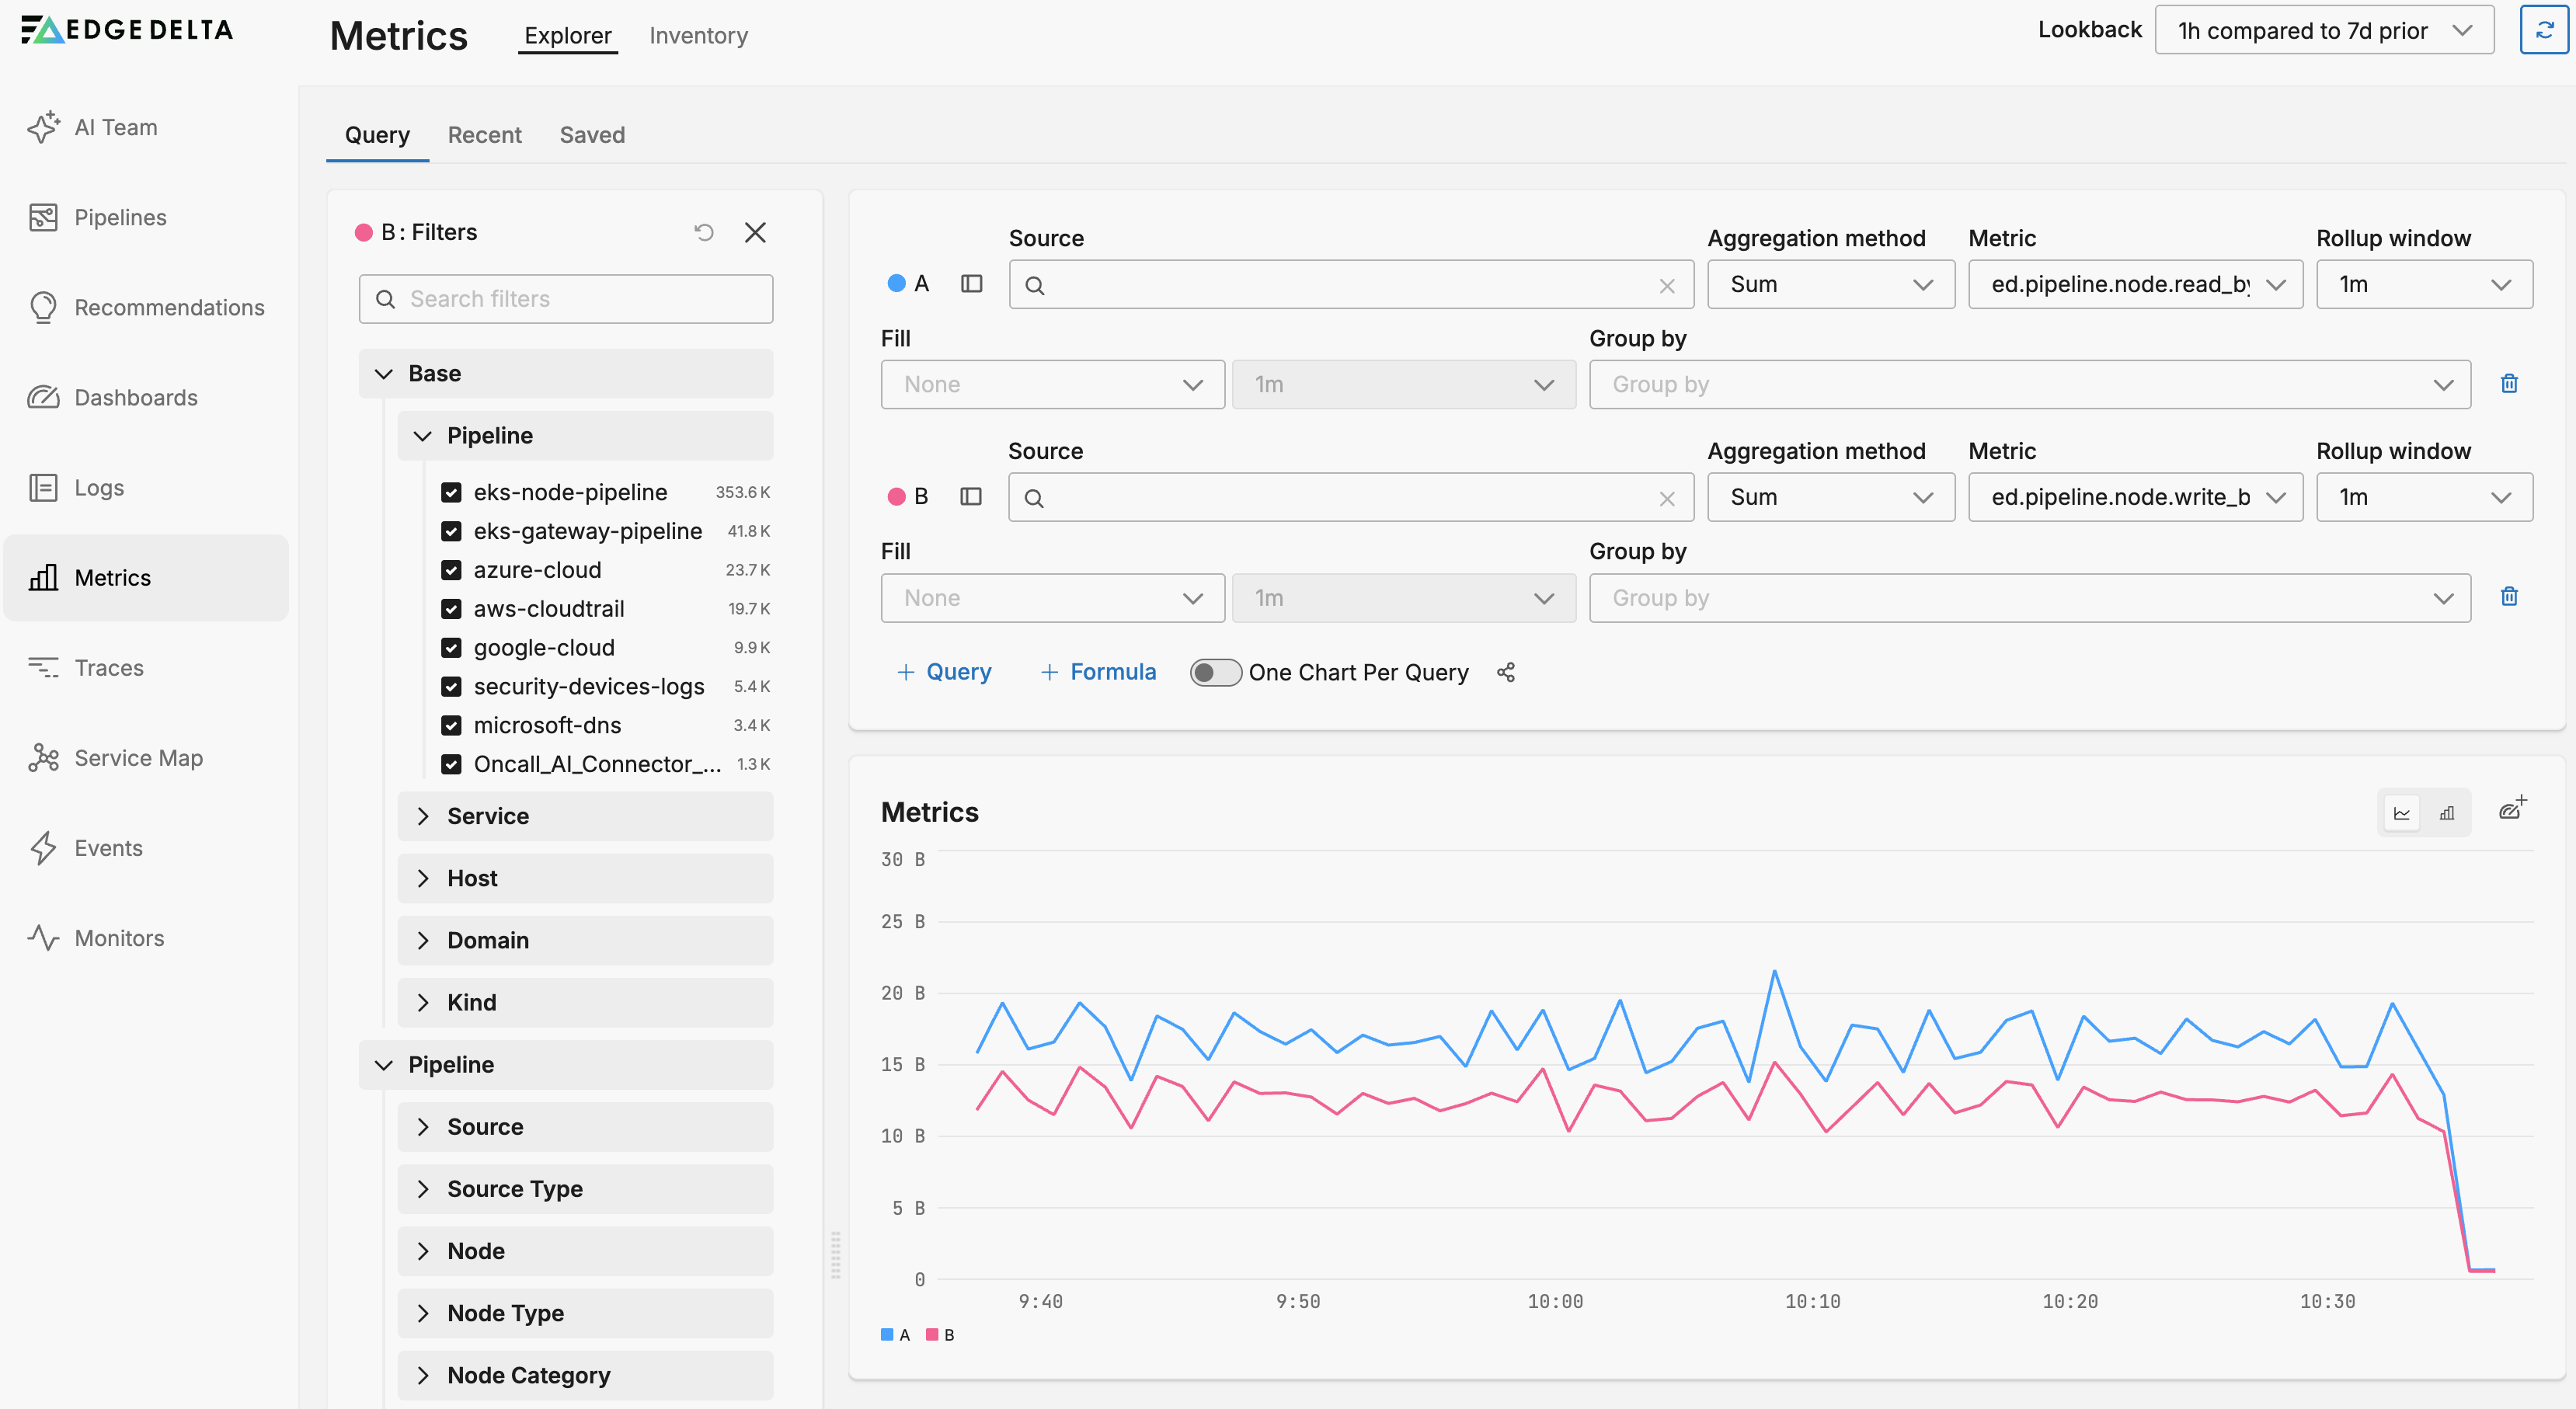
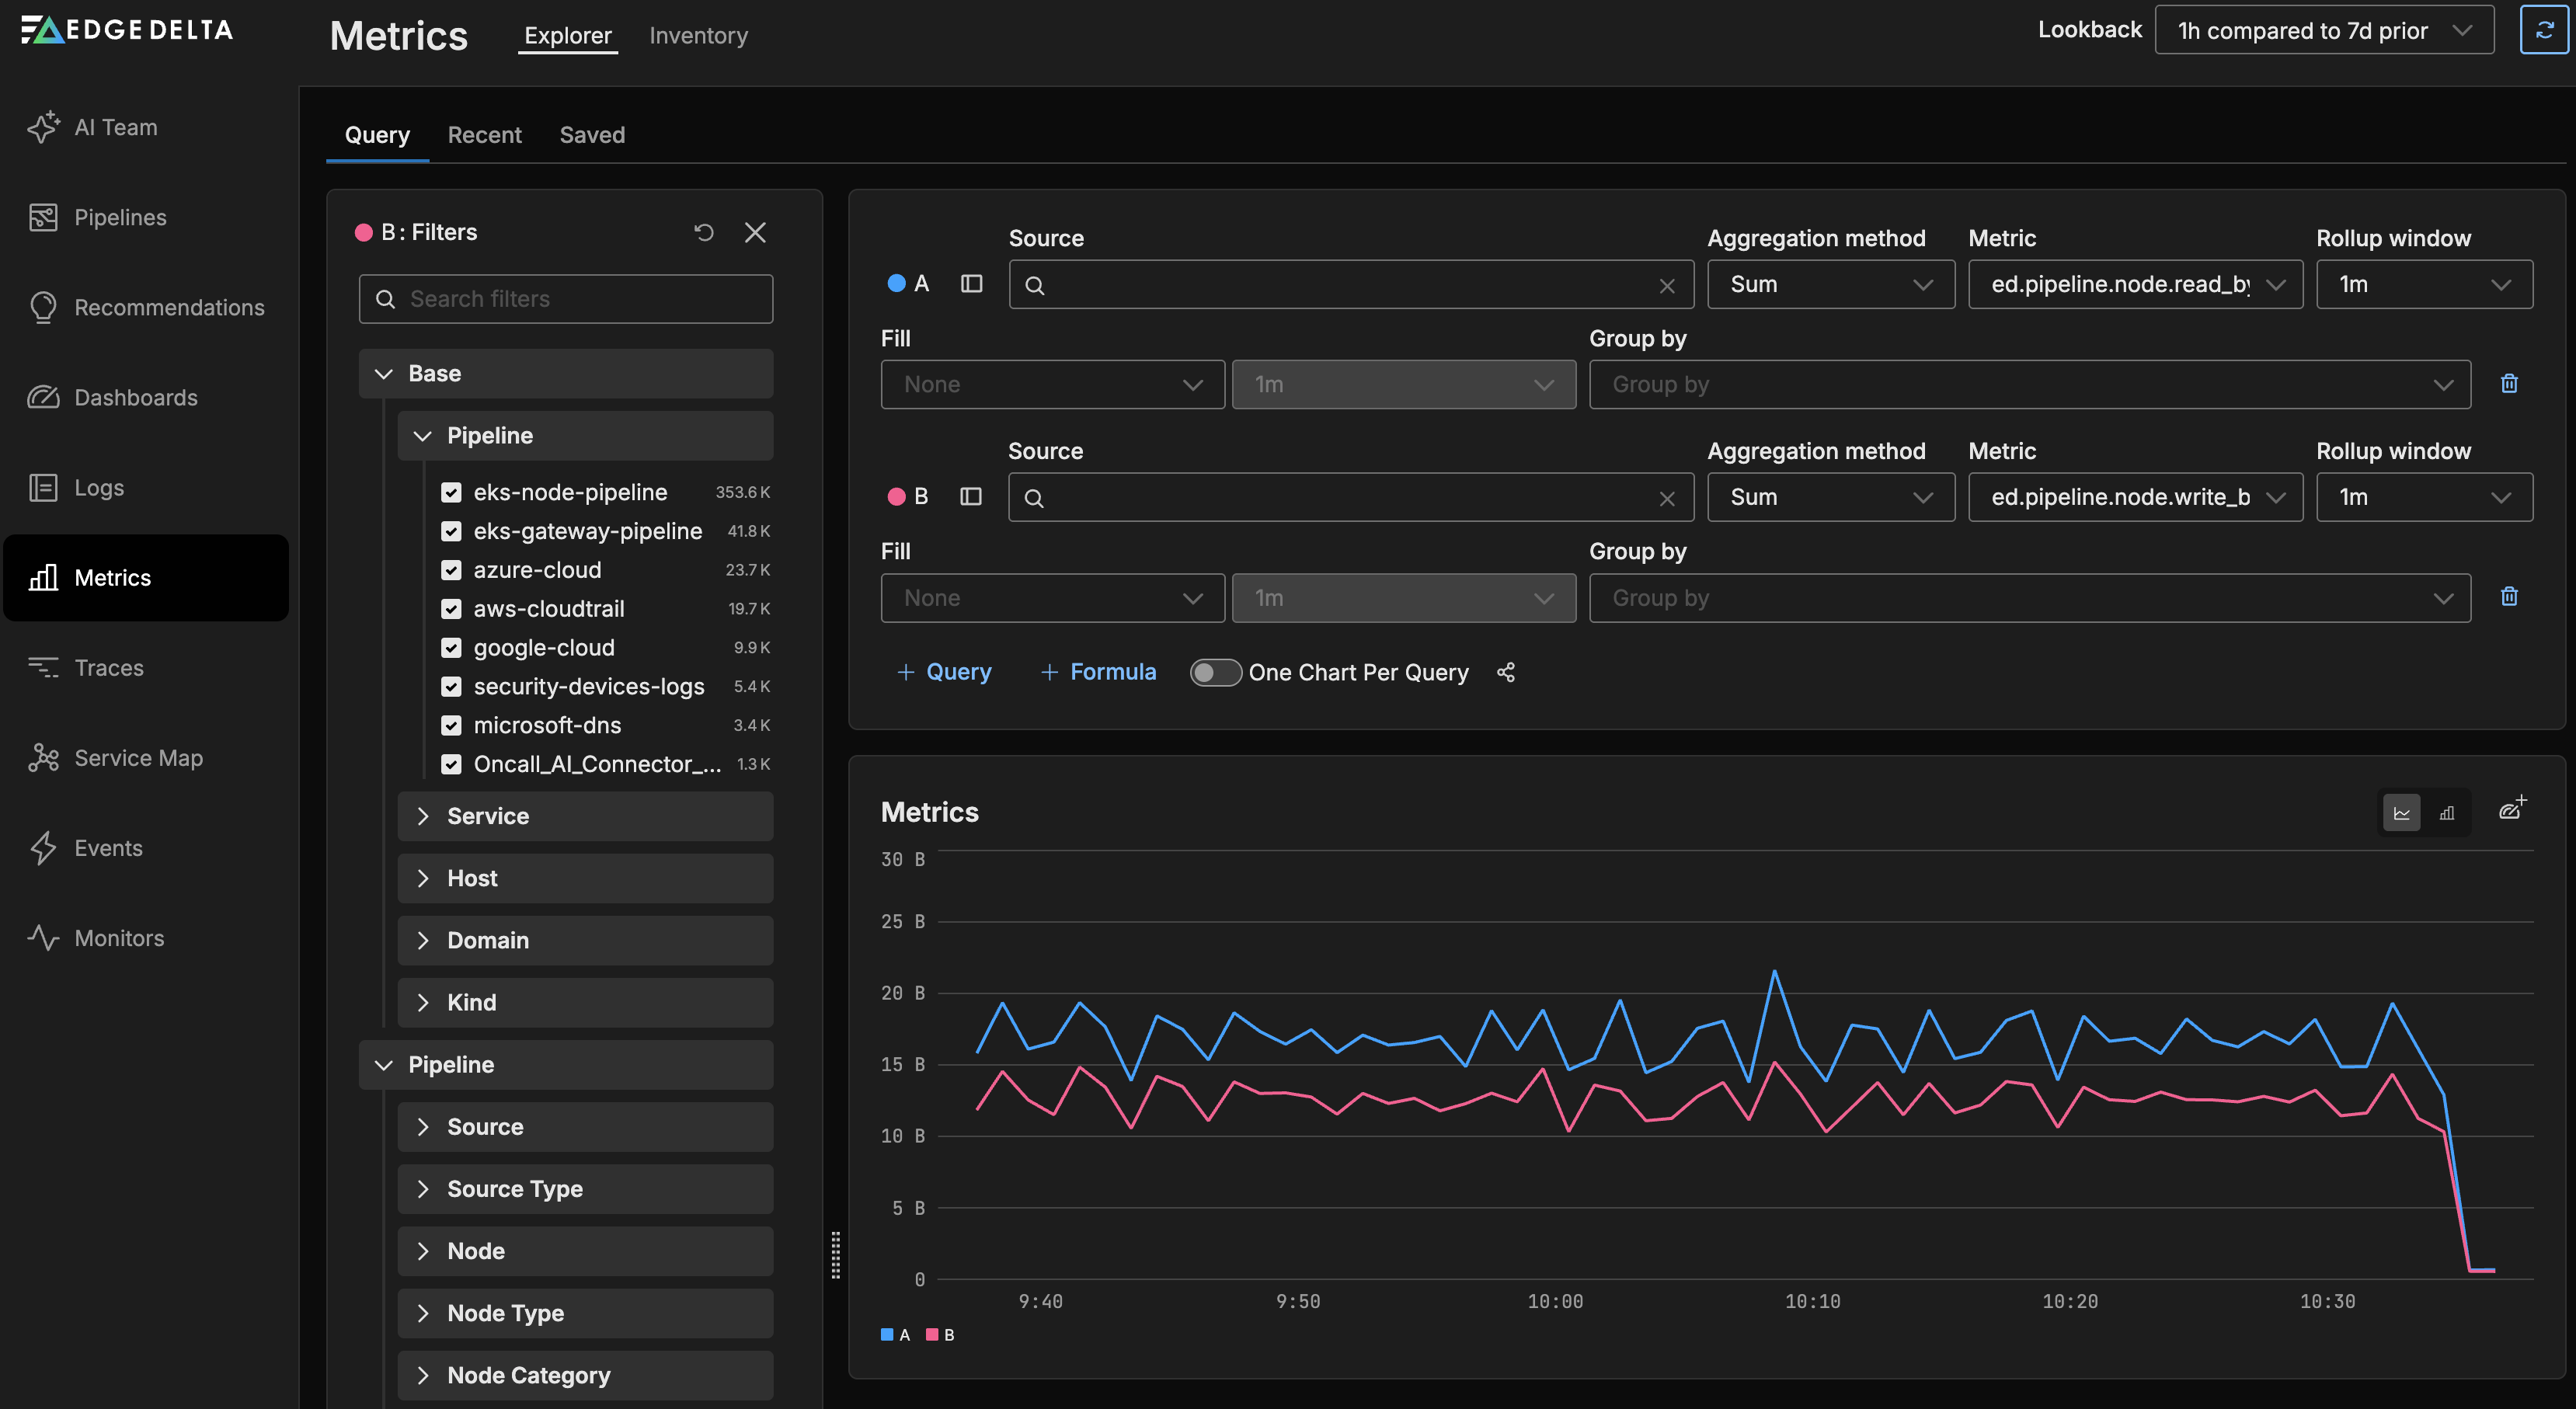
Metrics
Click Metrics to view the Metrics Explorer.
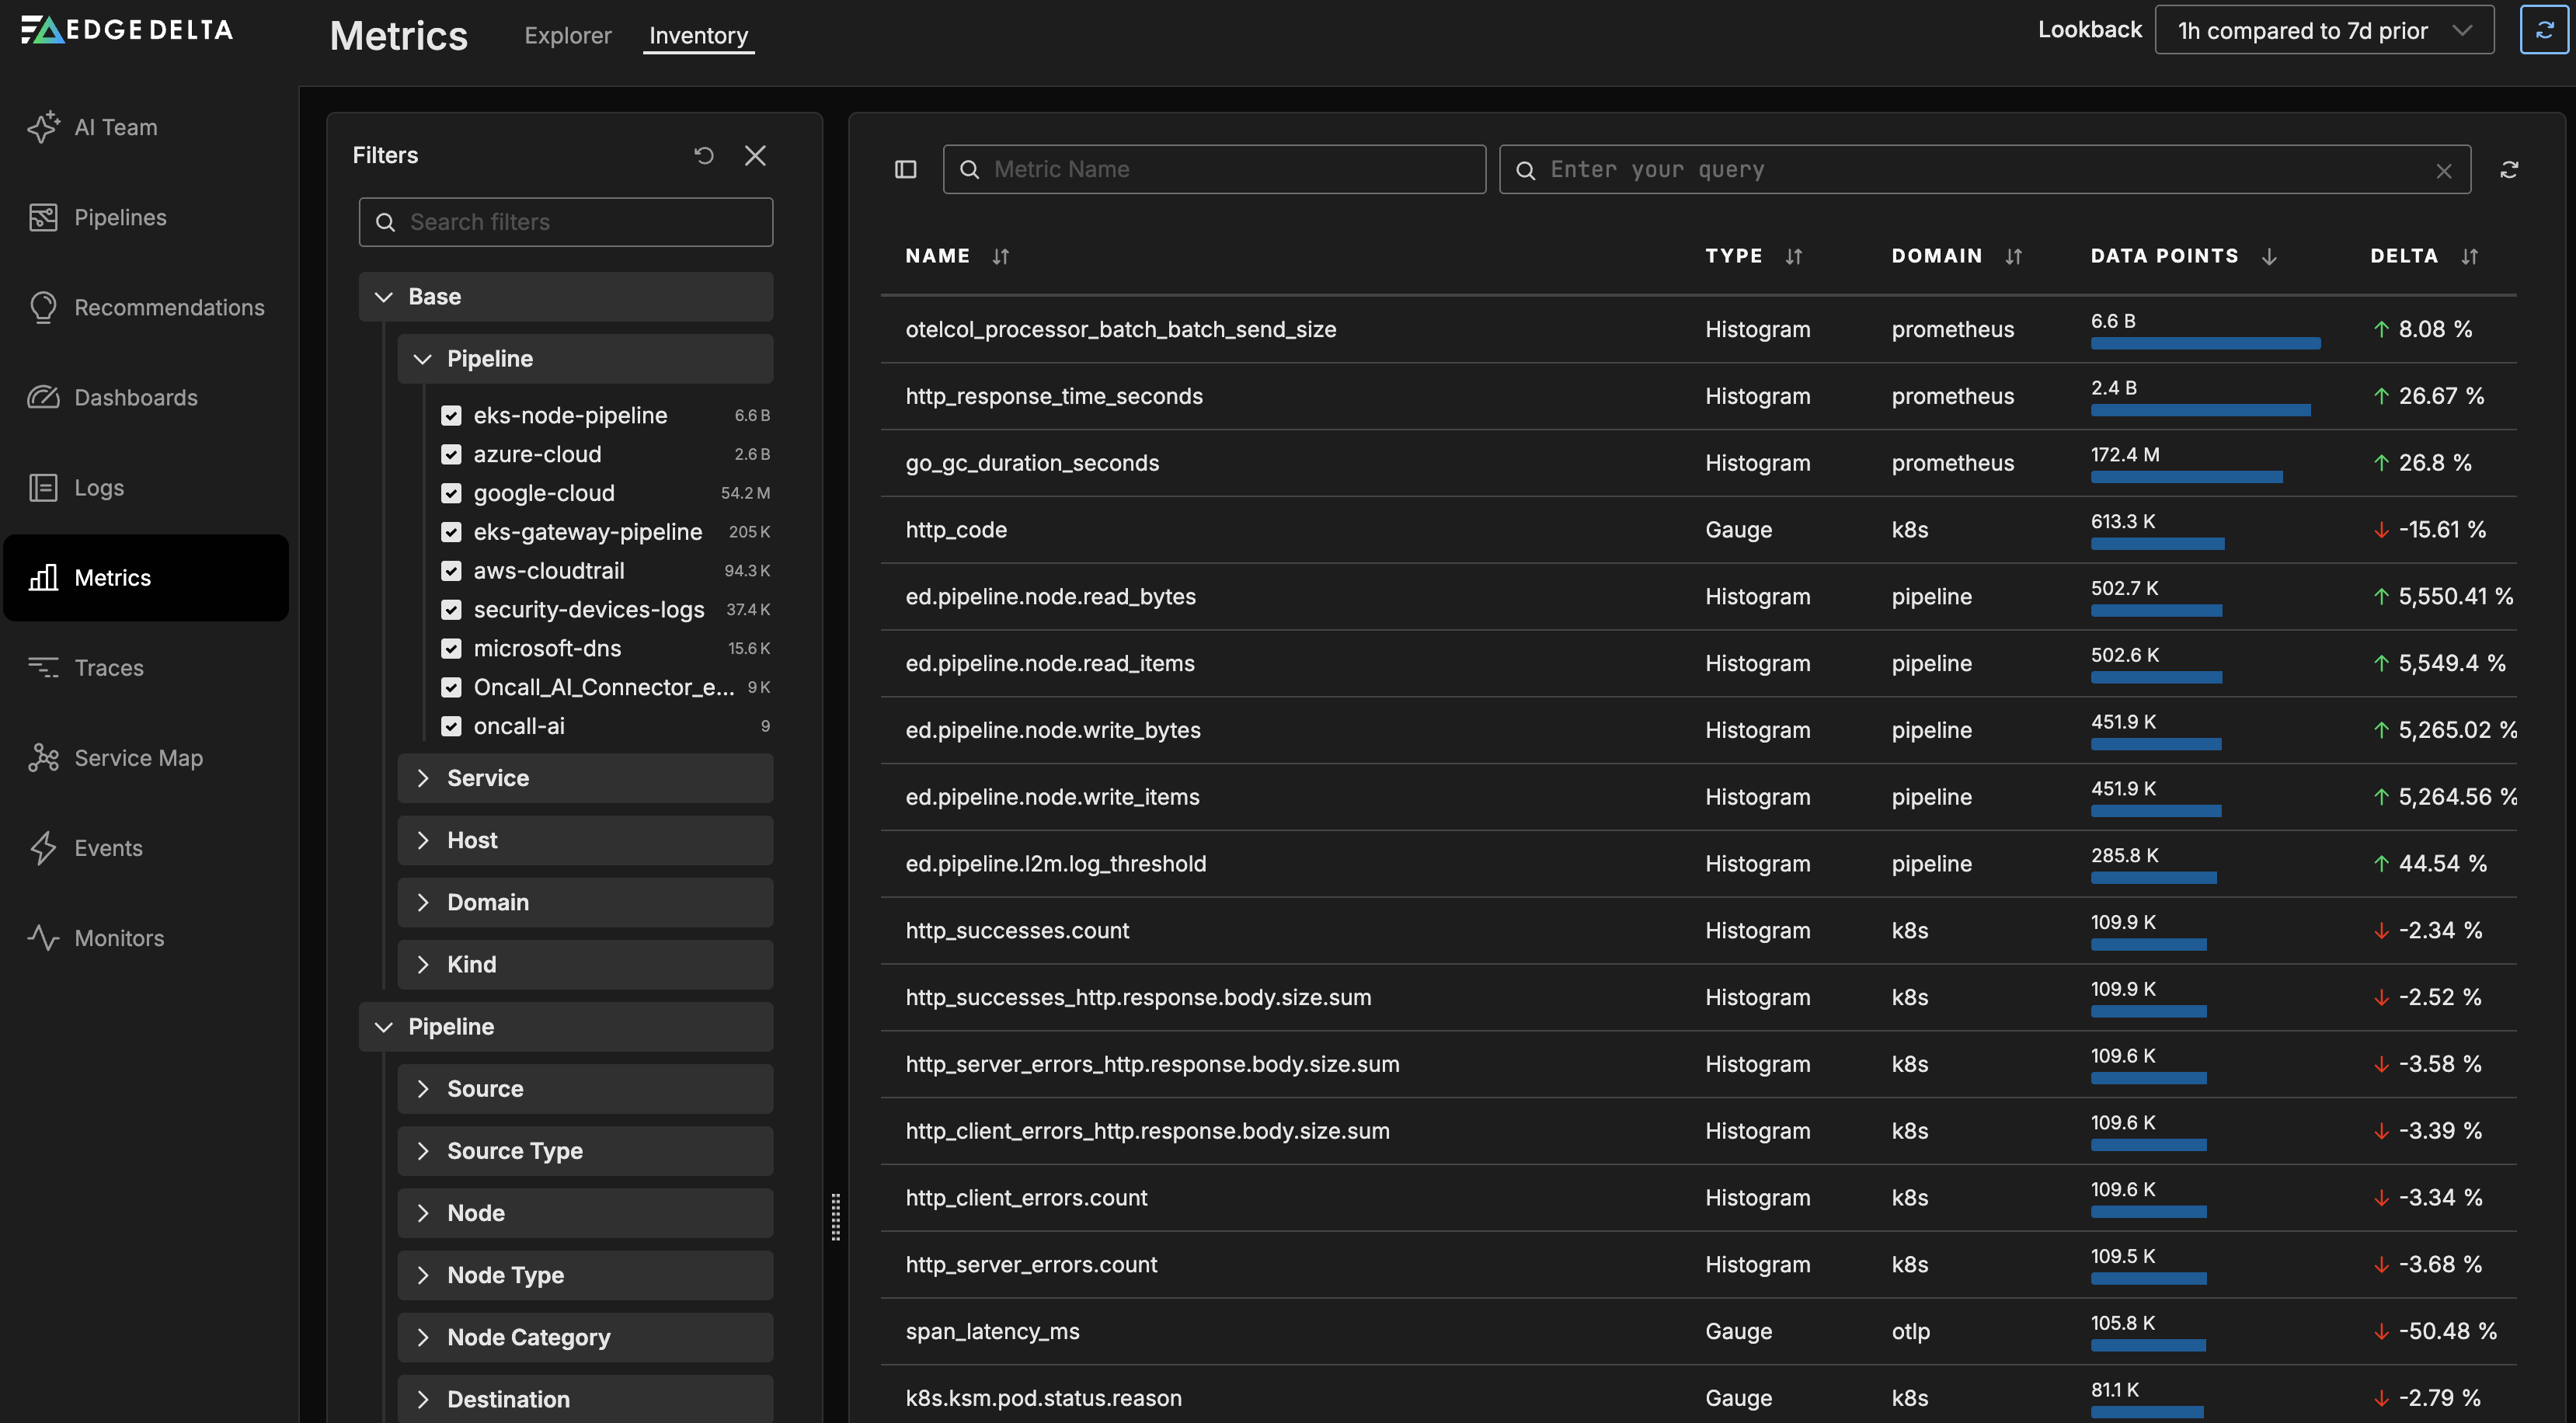
Inventory
Click the Inventory tab to view the Metrics Inventory: all the metrics being captured.

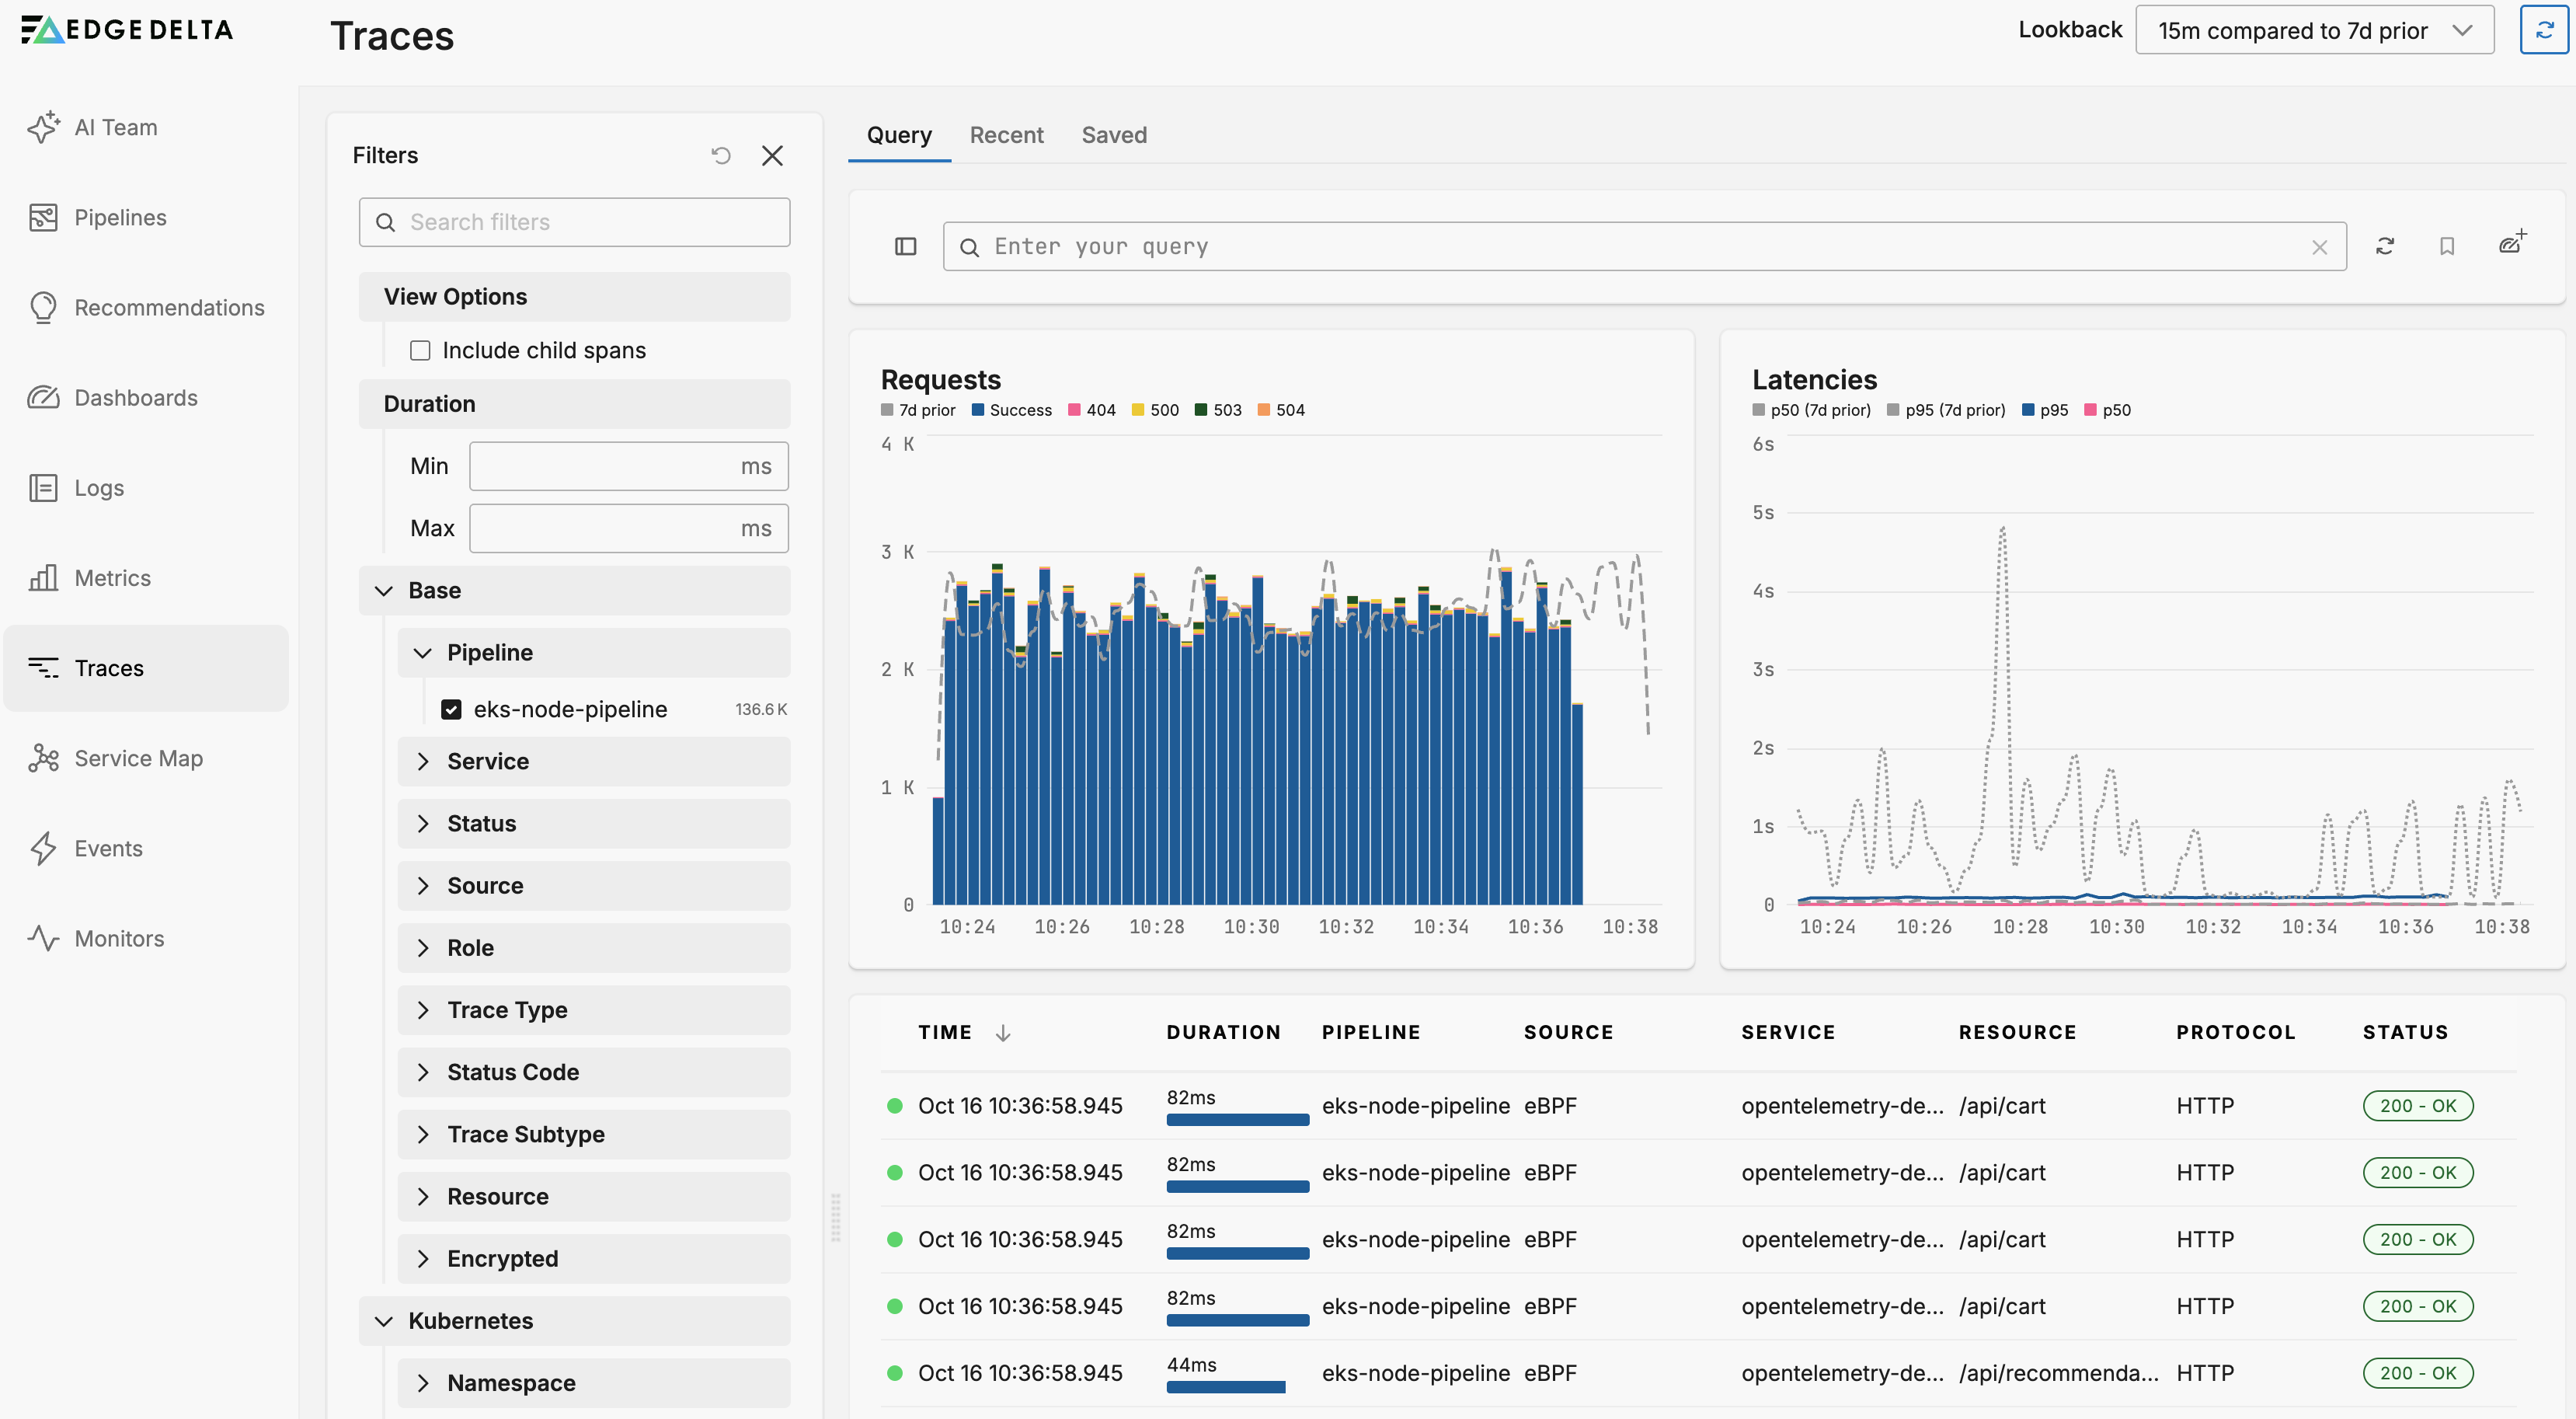
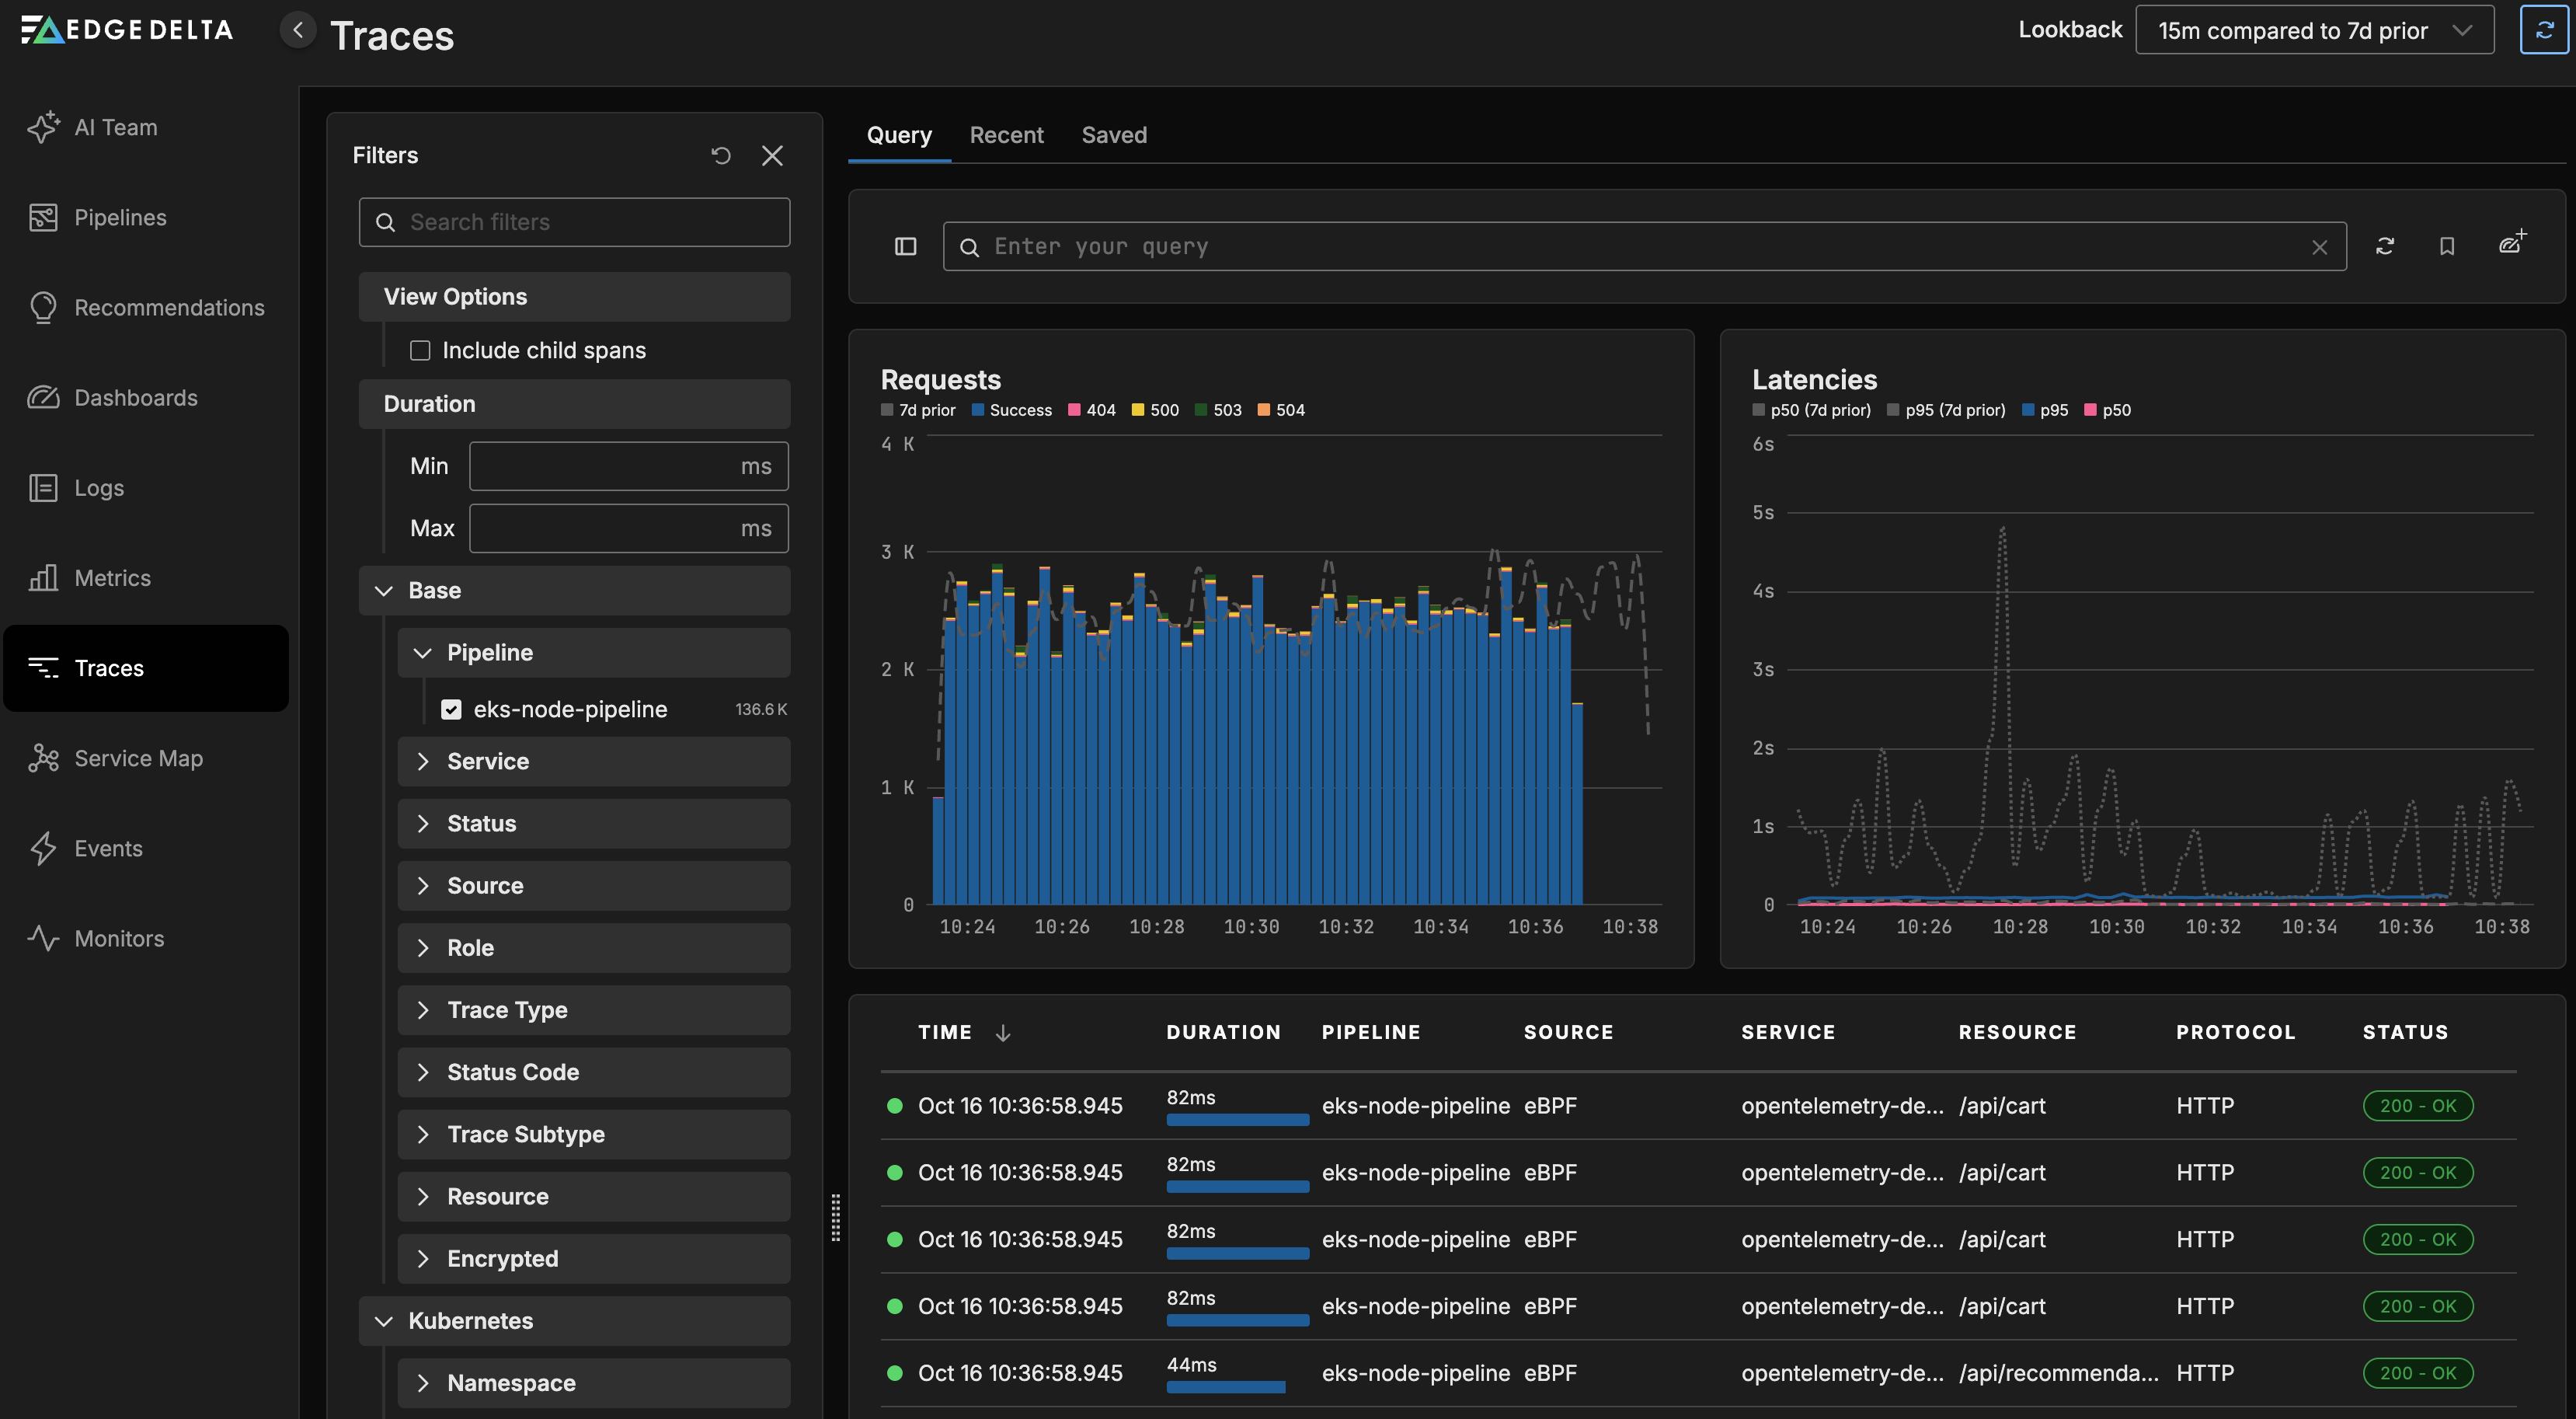
Traces
Click Traces to view request traffic between services.
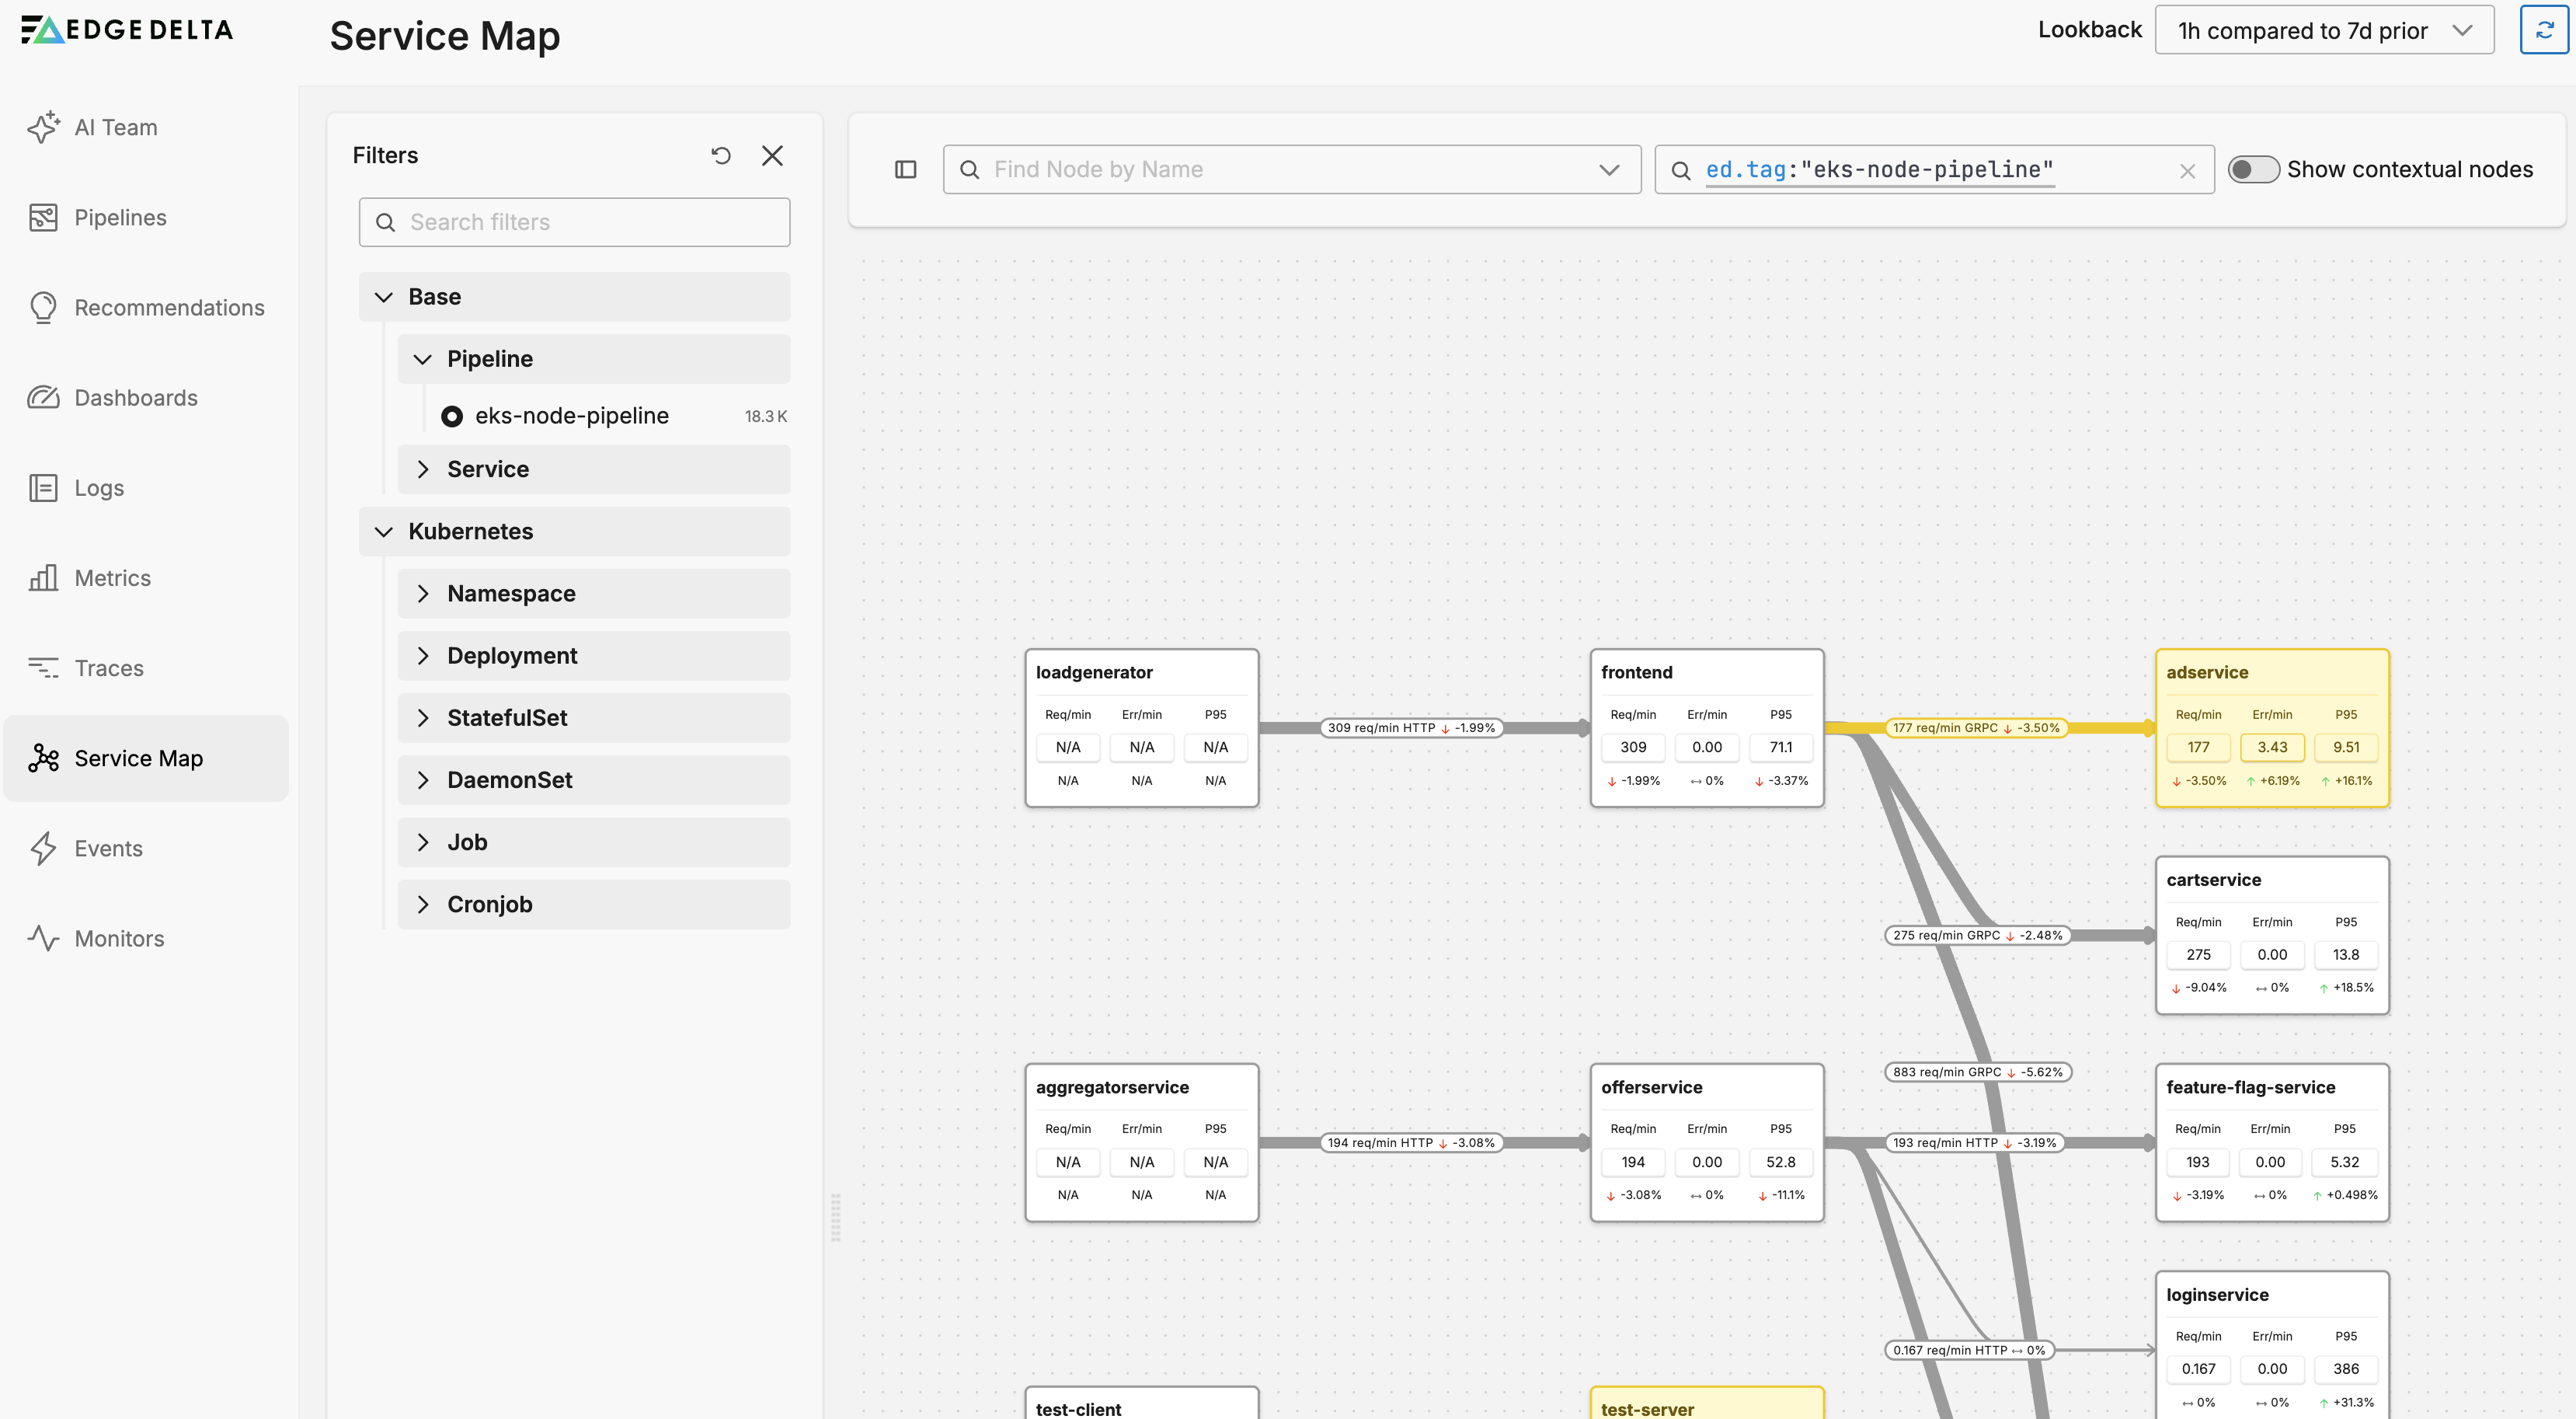
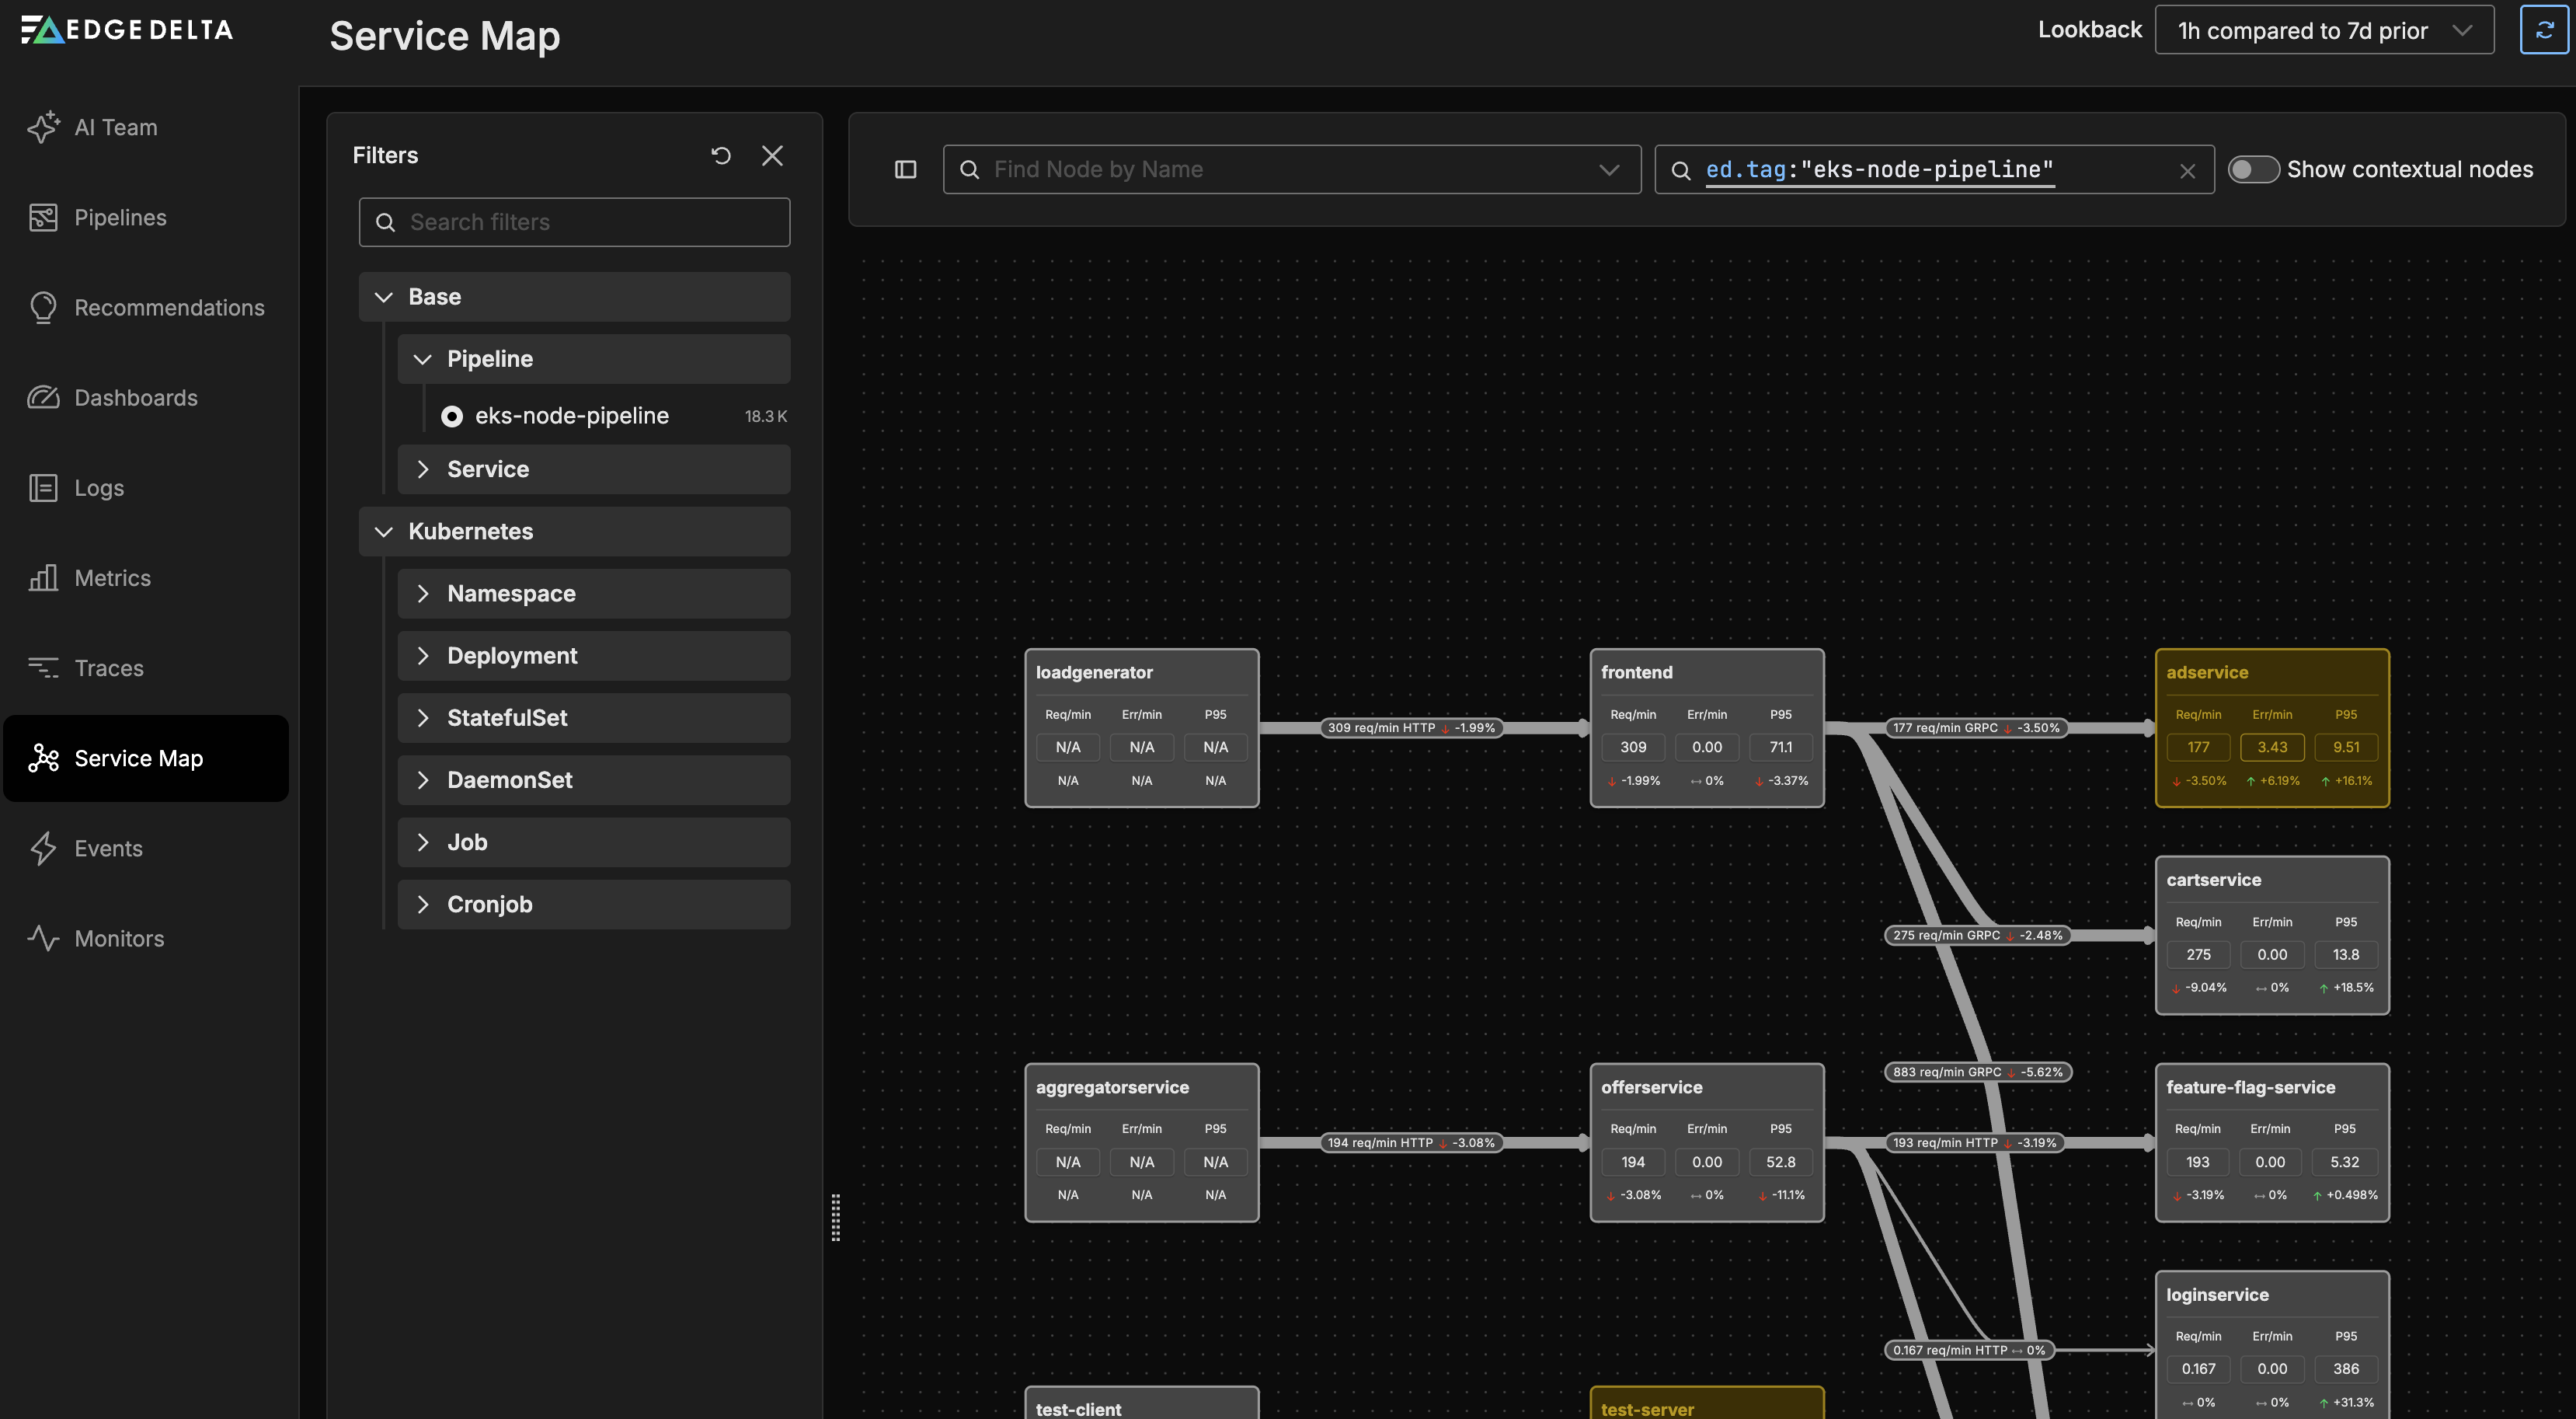
Service Map
Click Service Map to view a map of the services within your application architecture and how they interconnect.
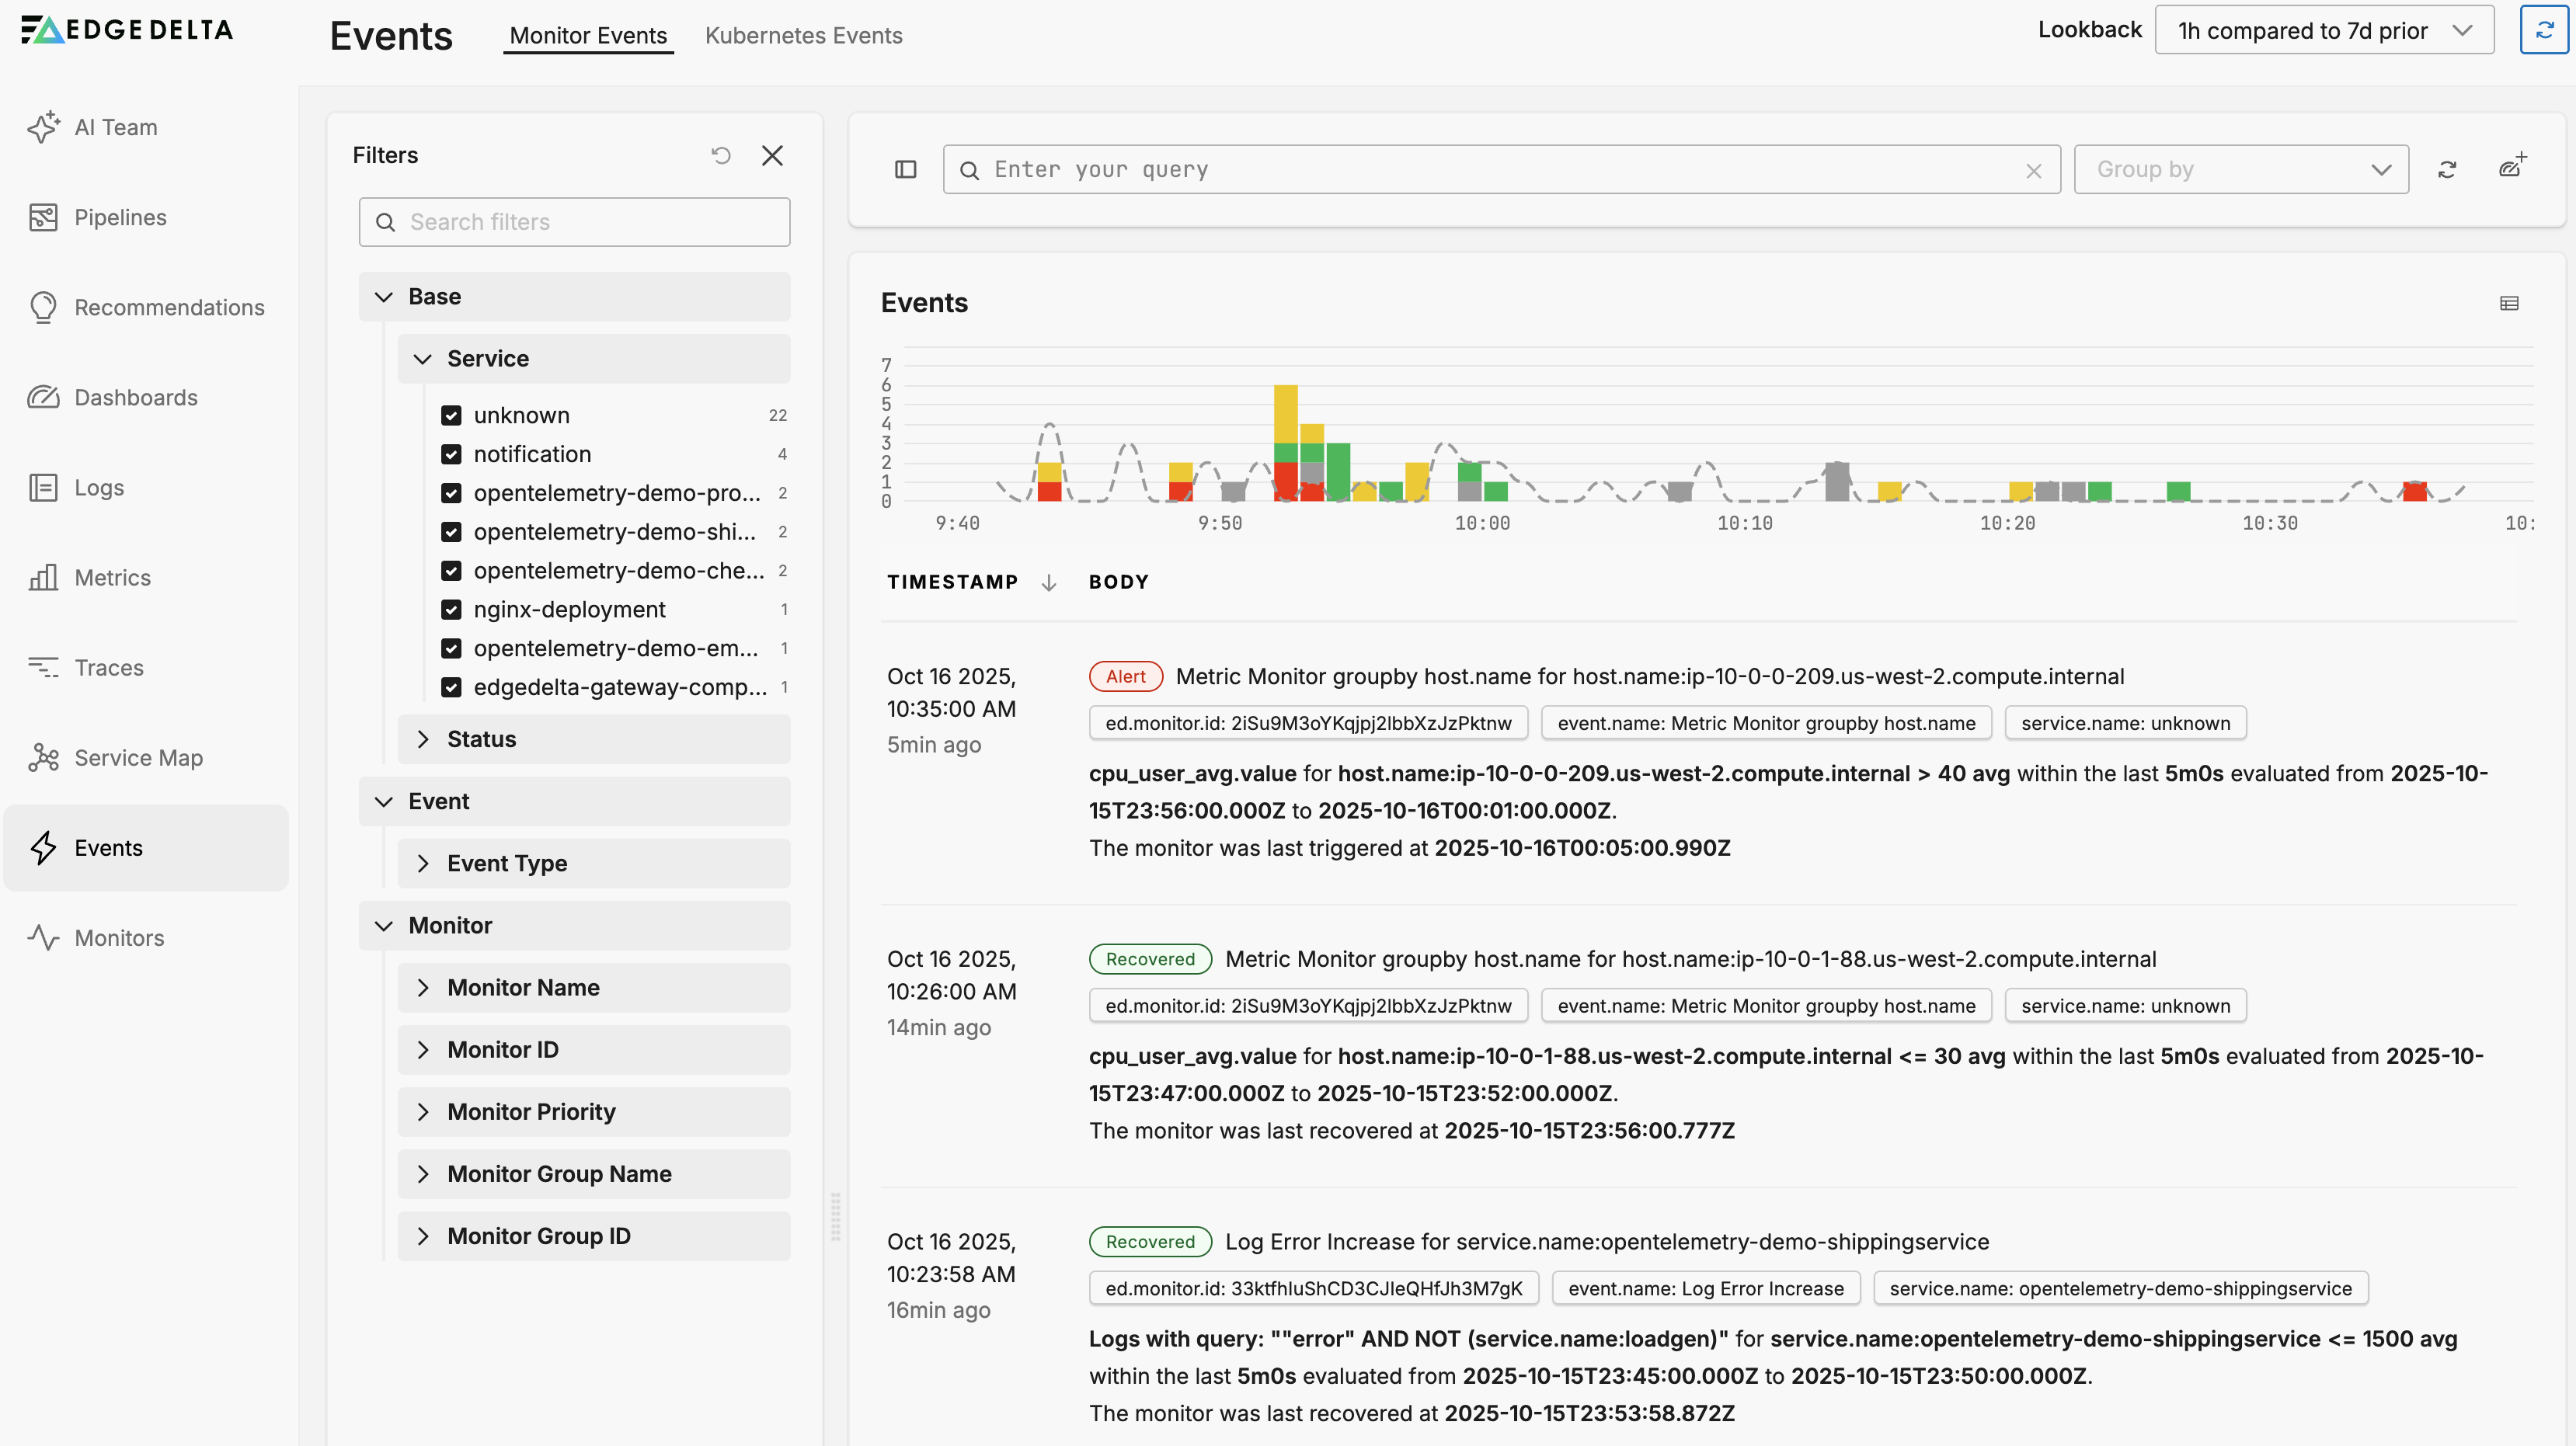
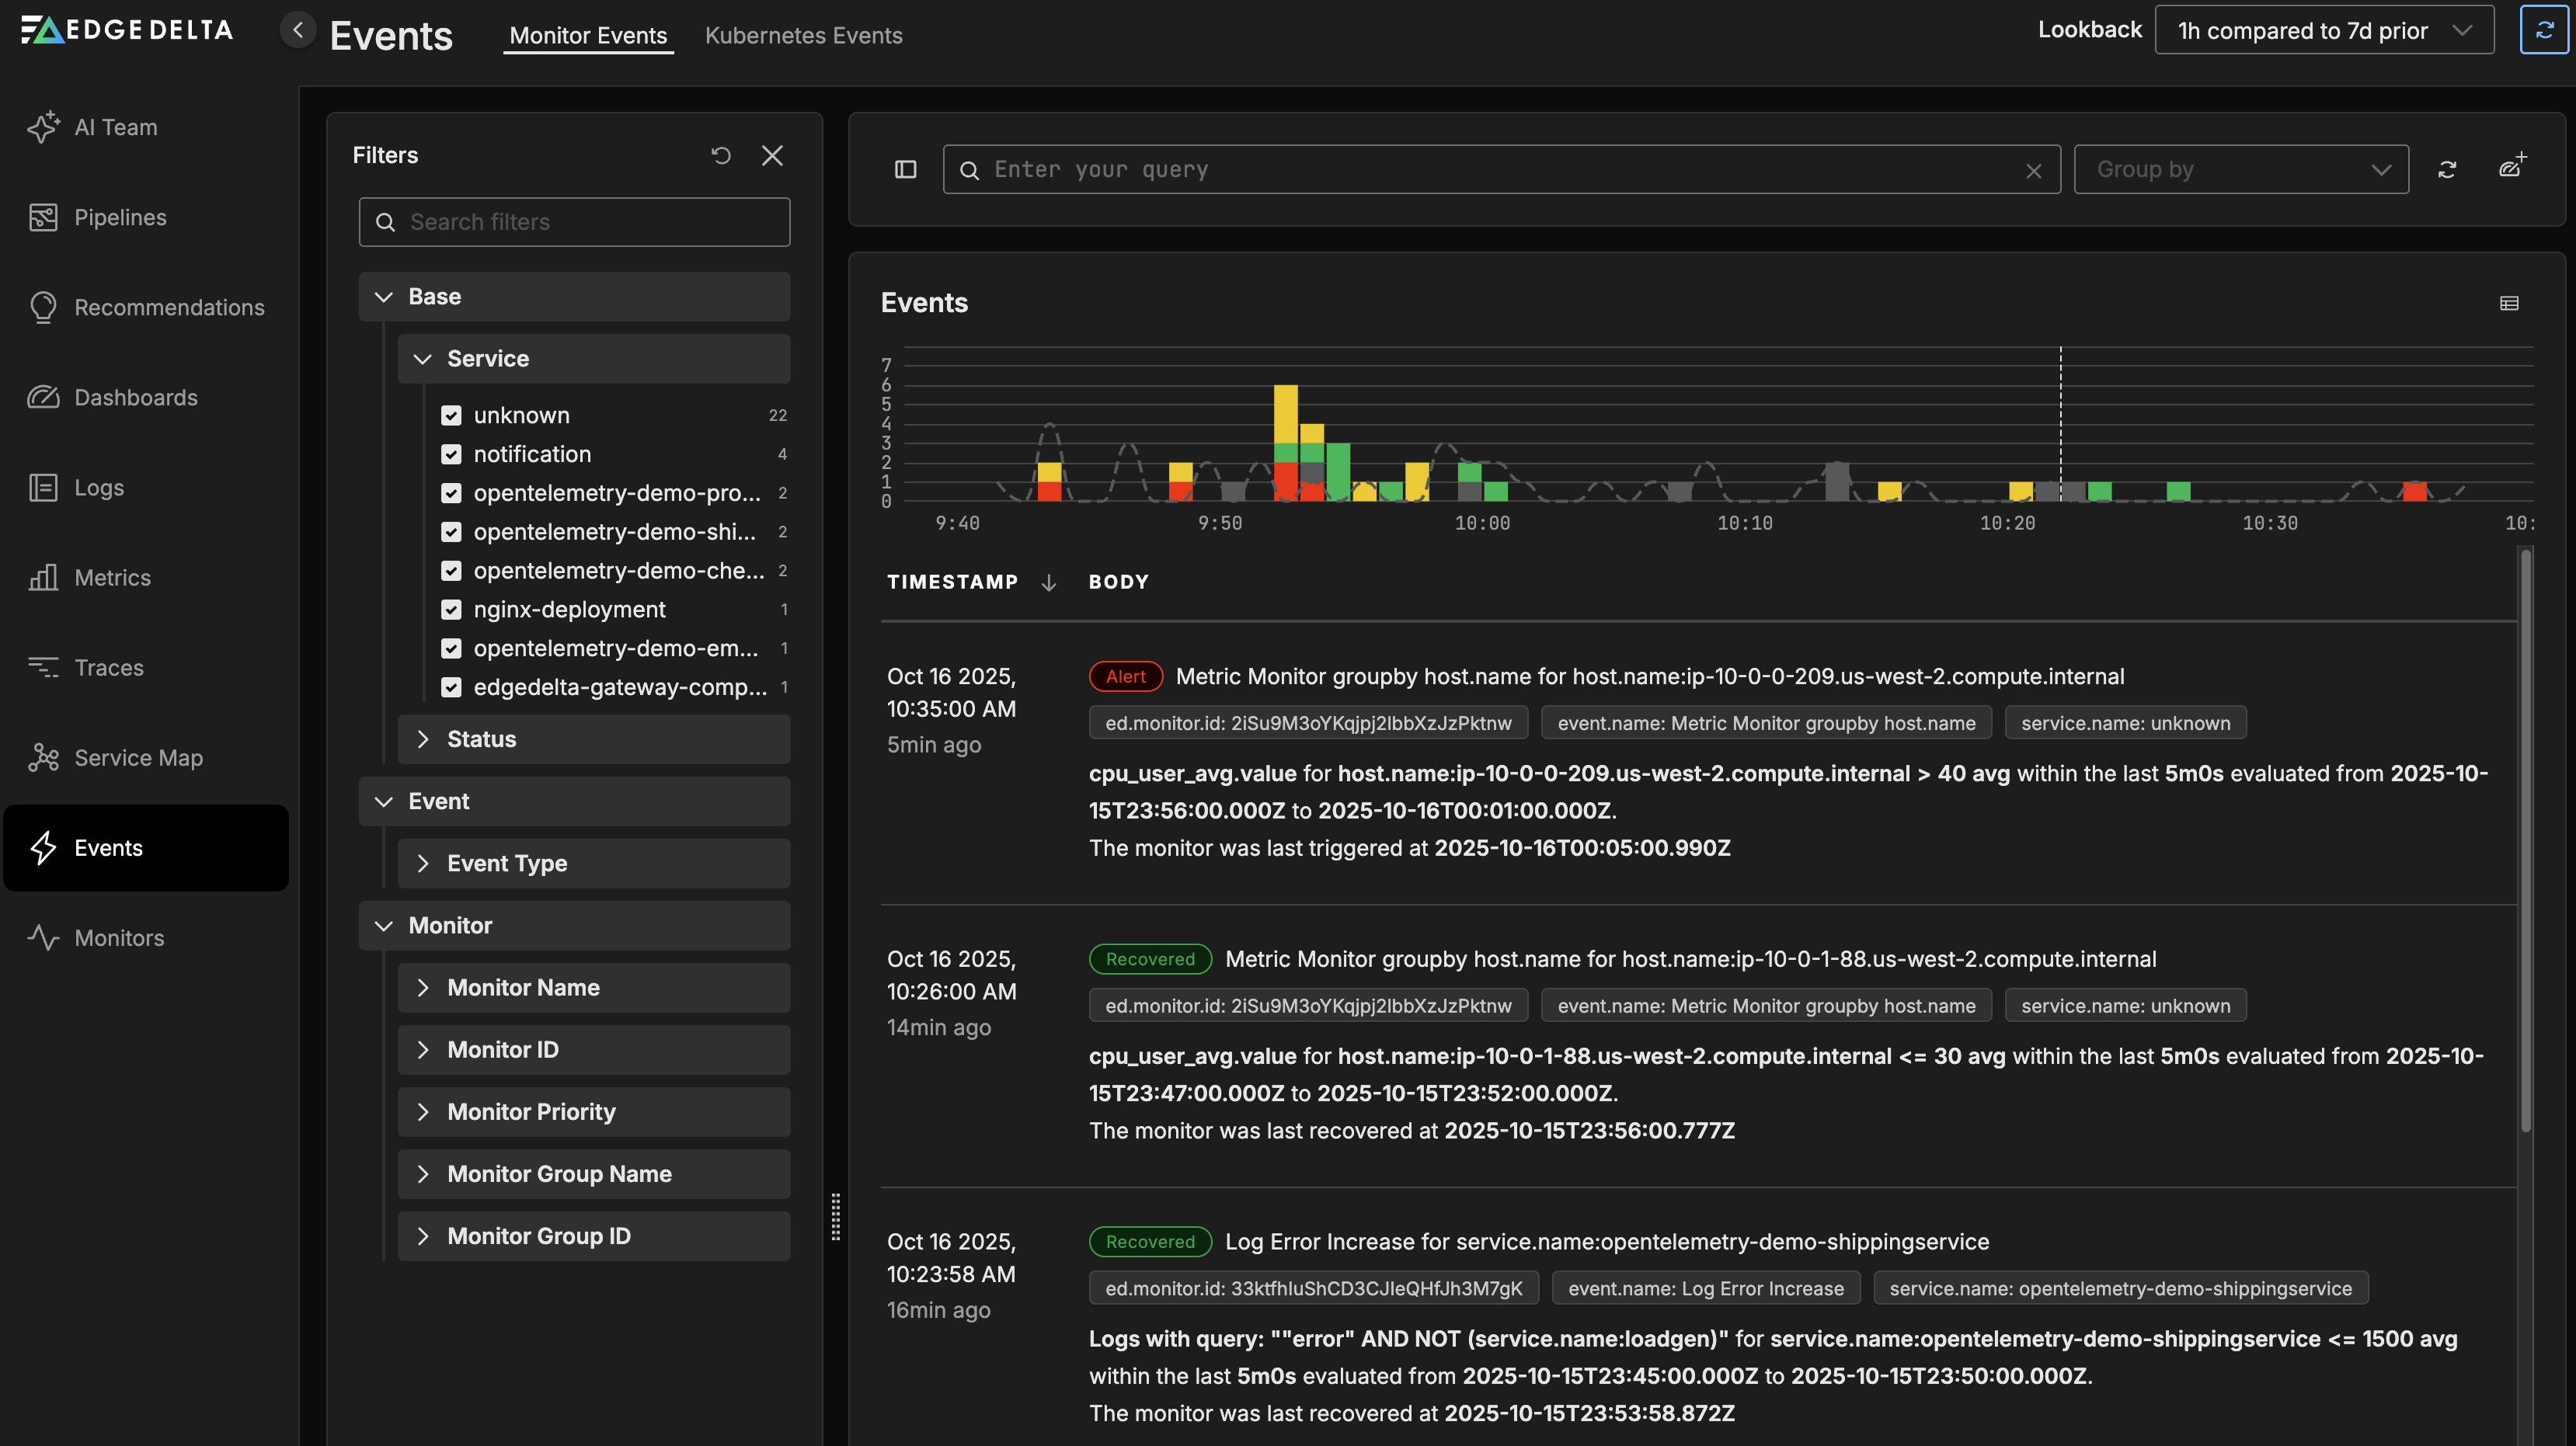
Events
Click Events to view Monitor Events.
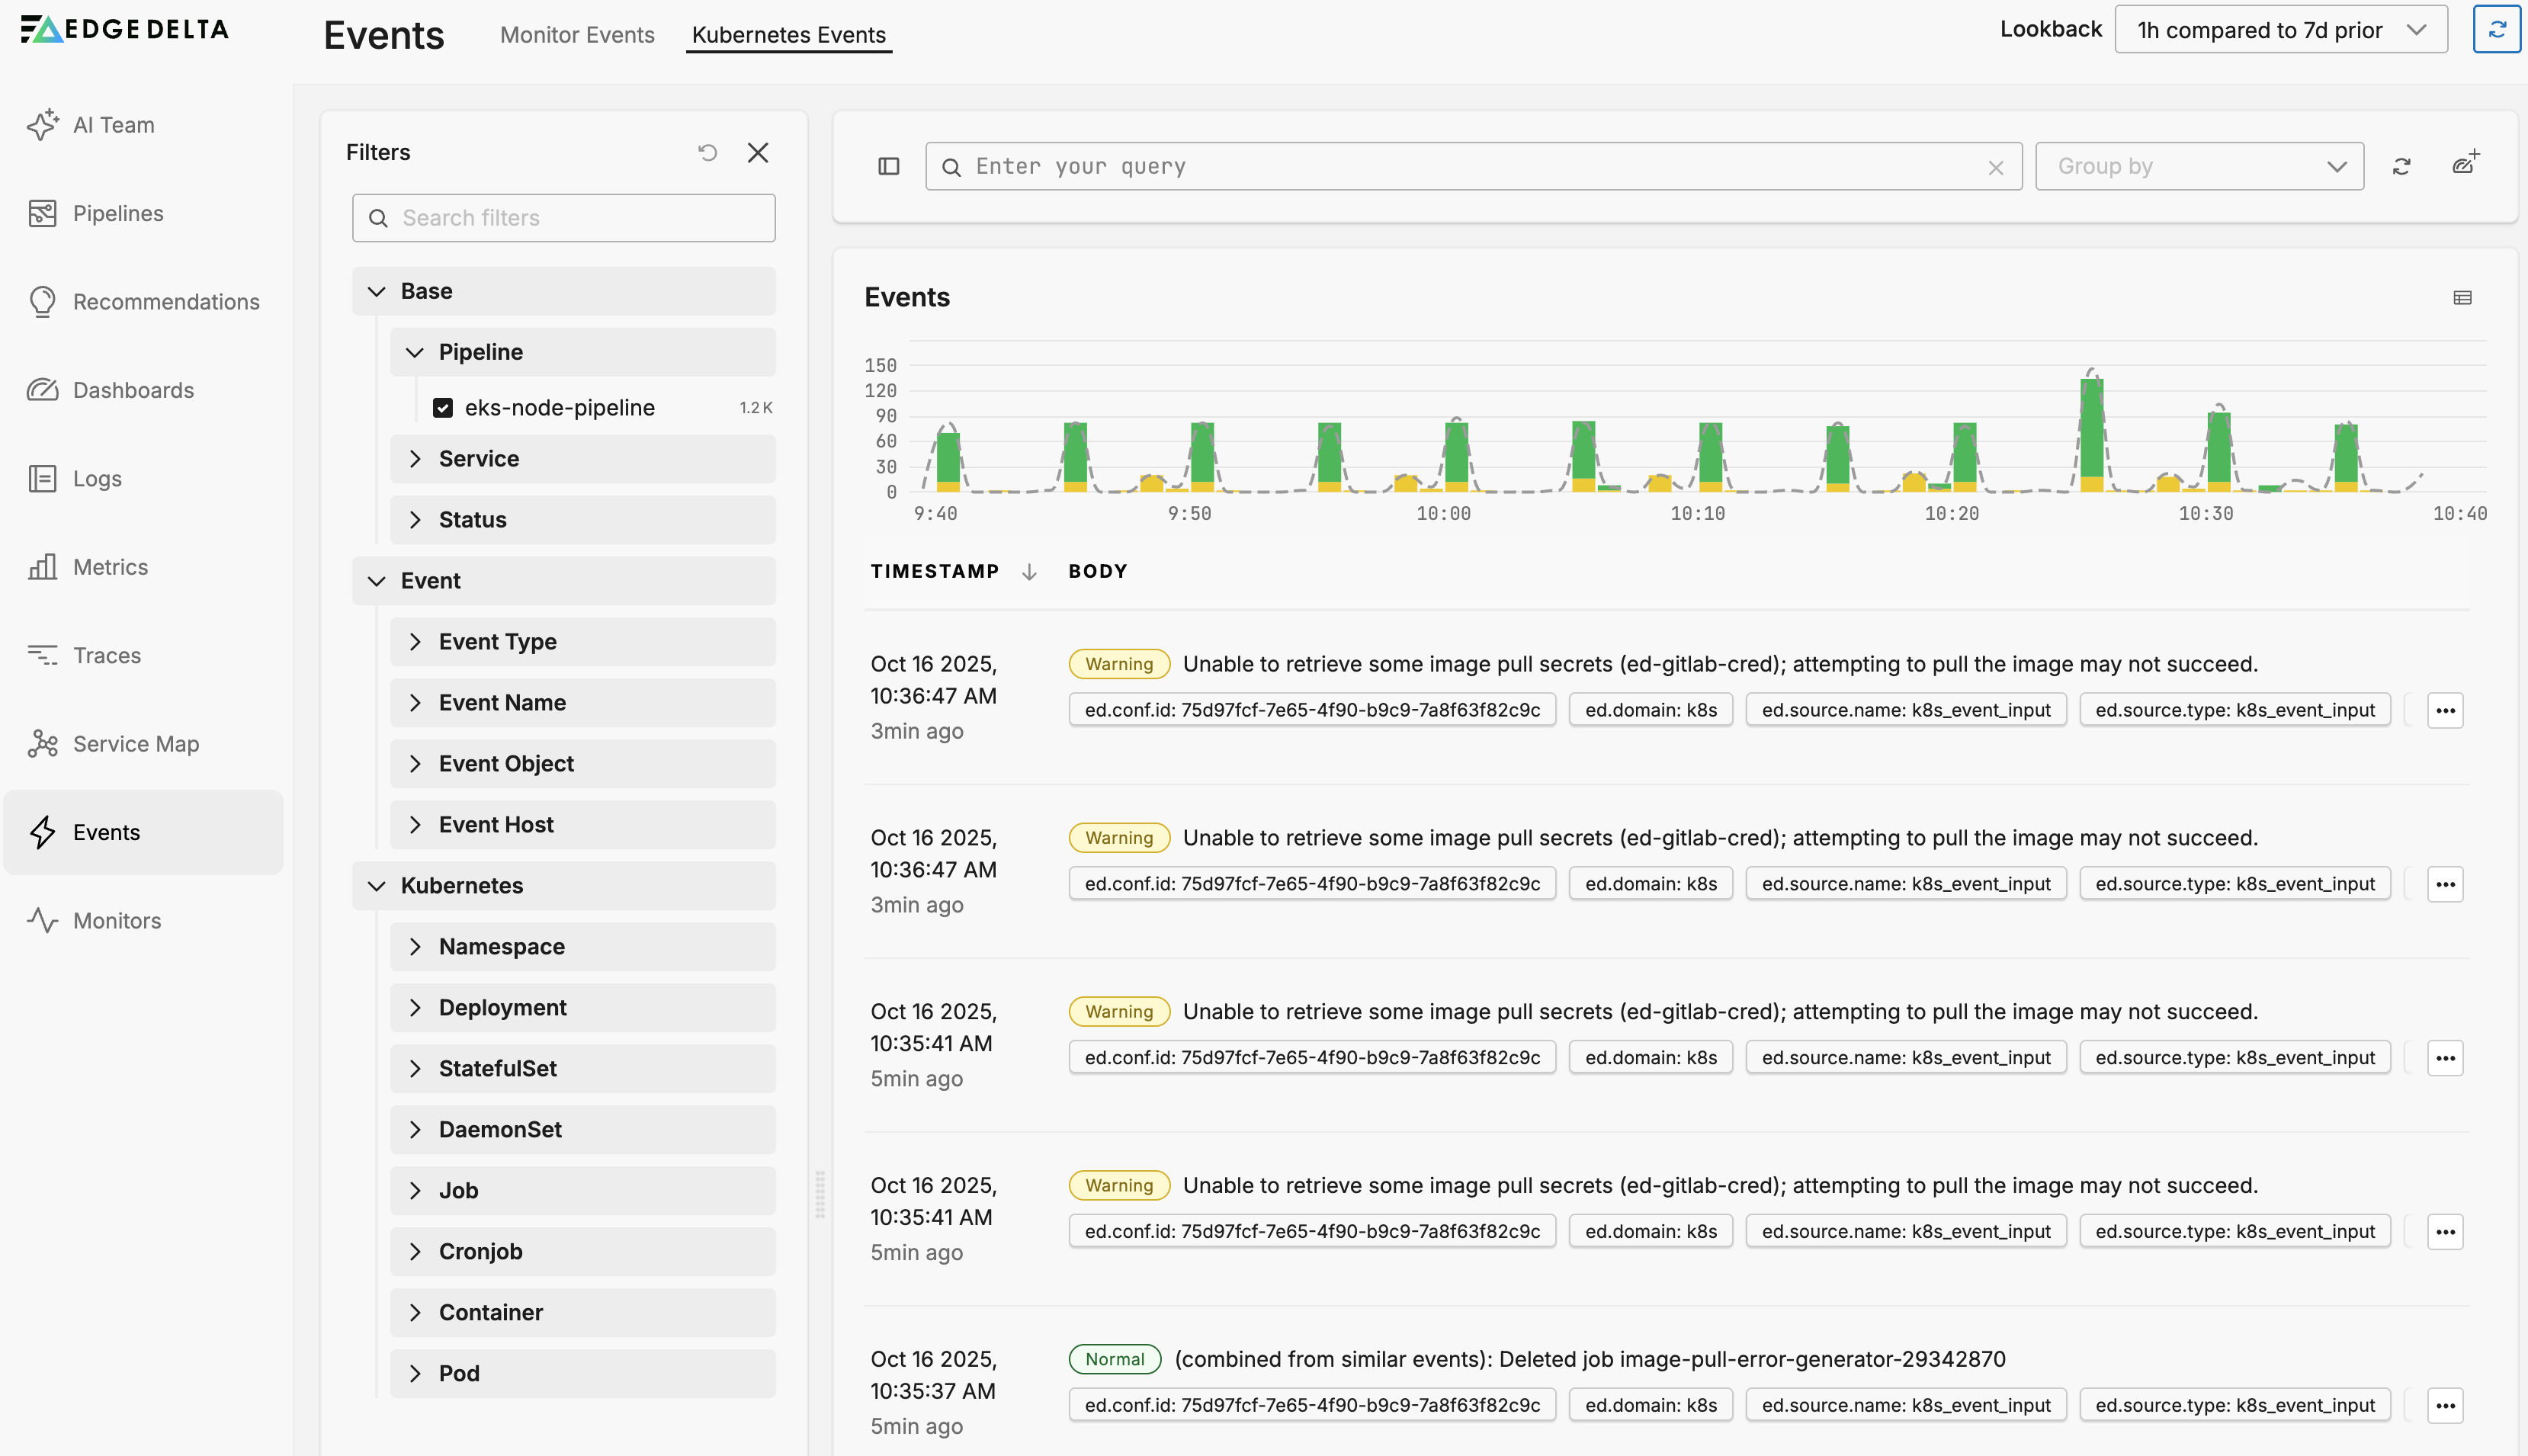
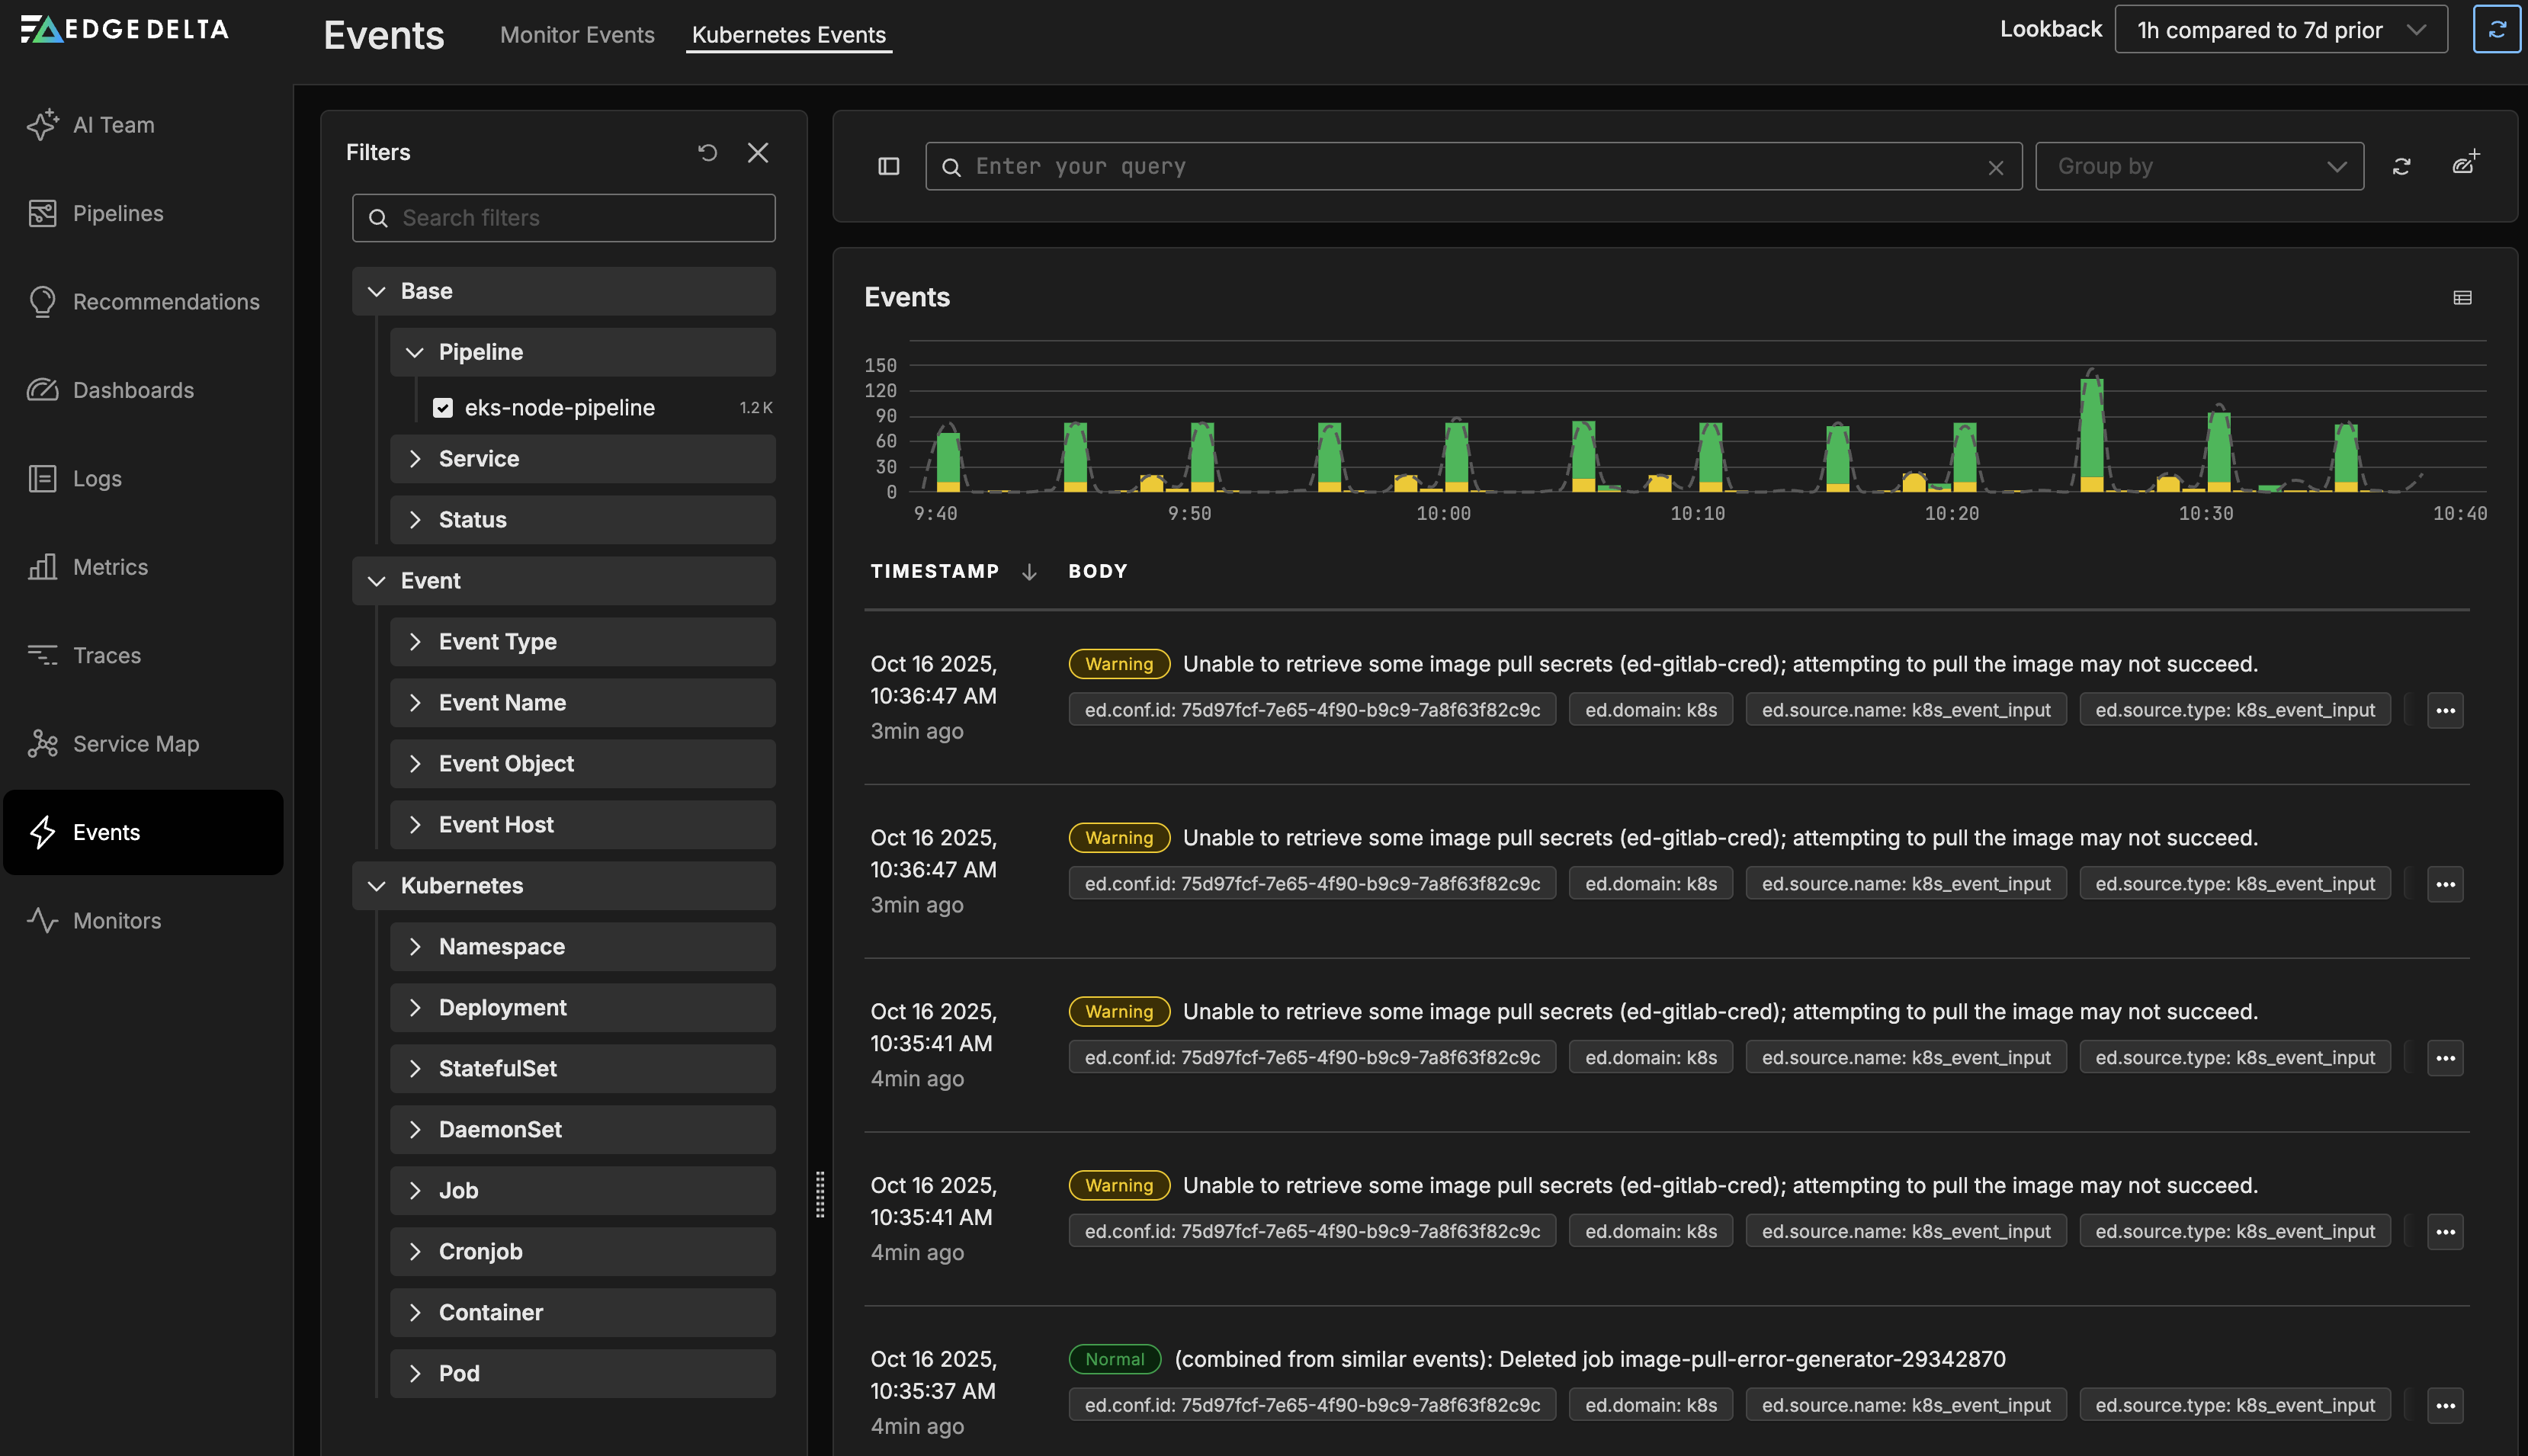
Kubernetes Events
Click the Kubernetes Events tab to view events from Kubernetes.
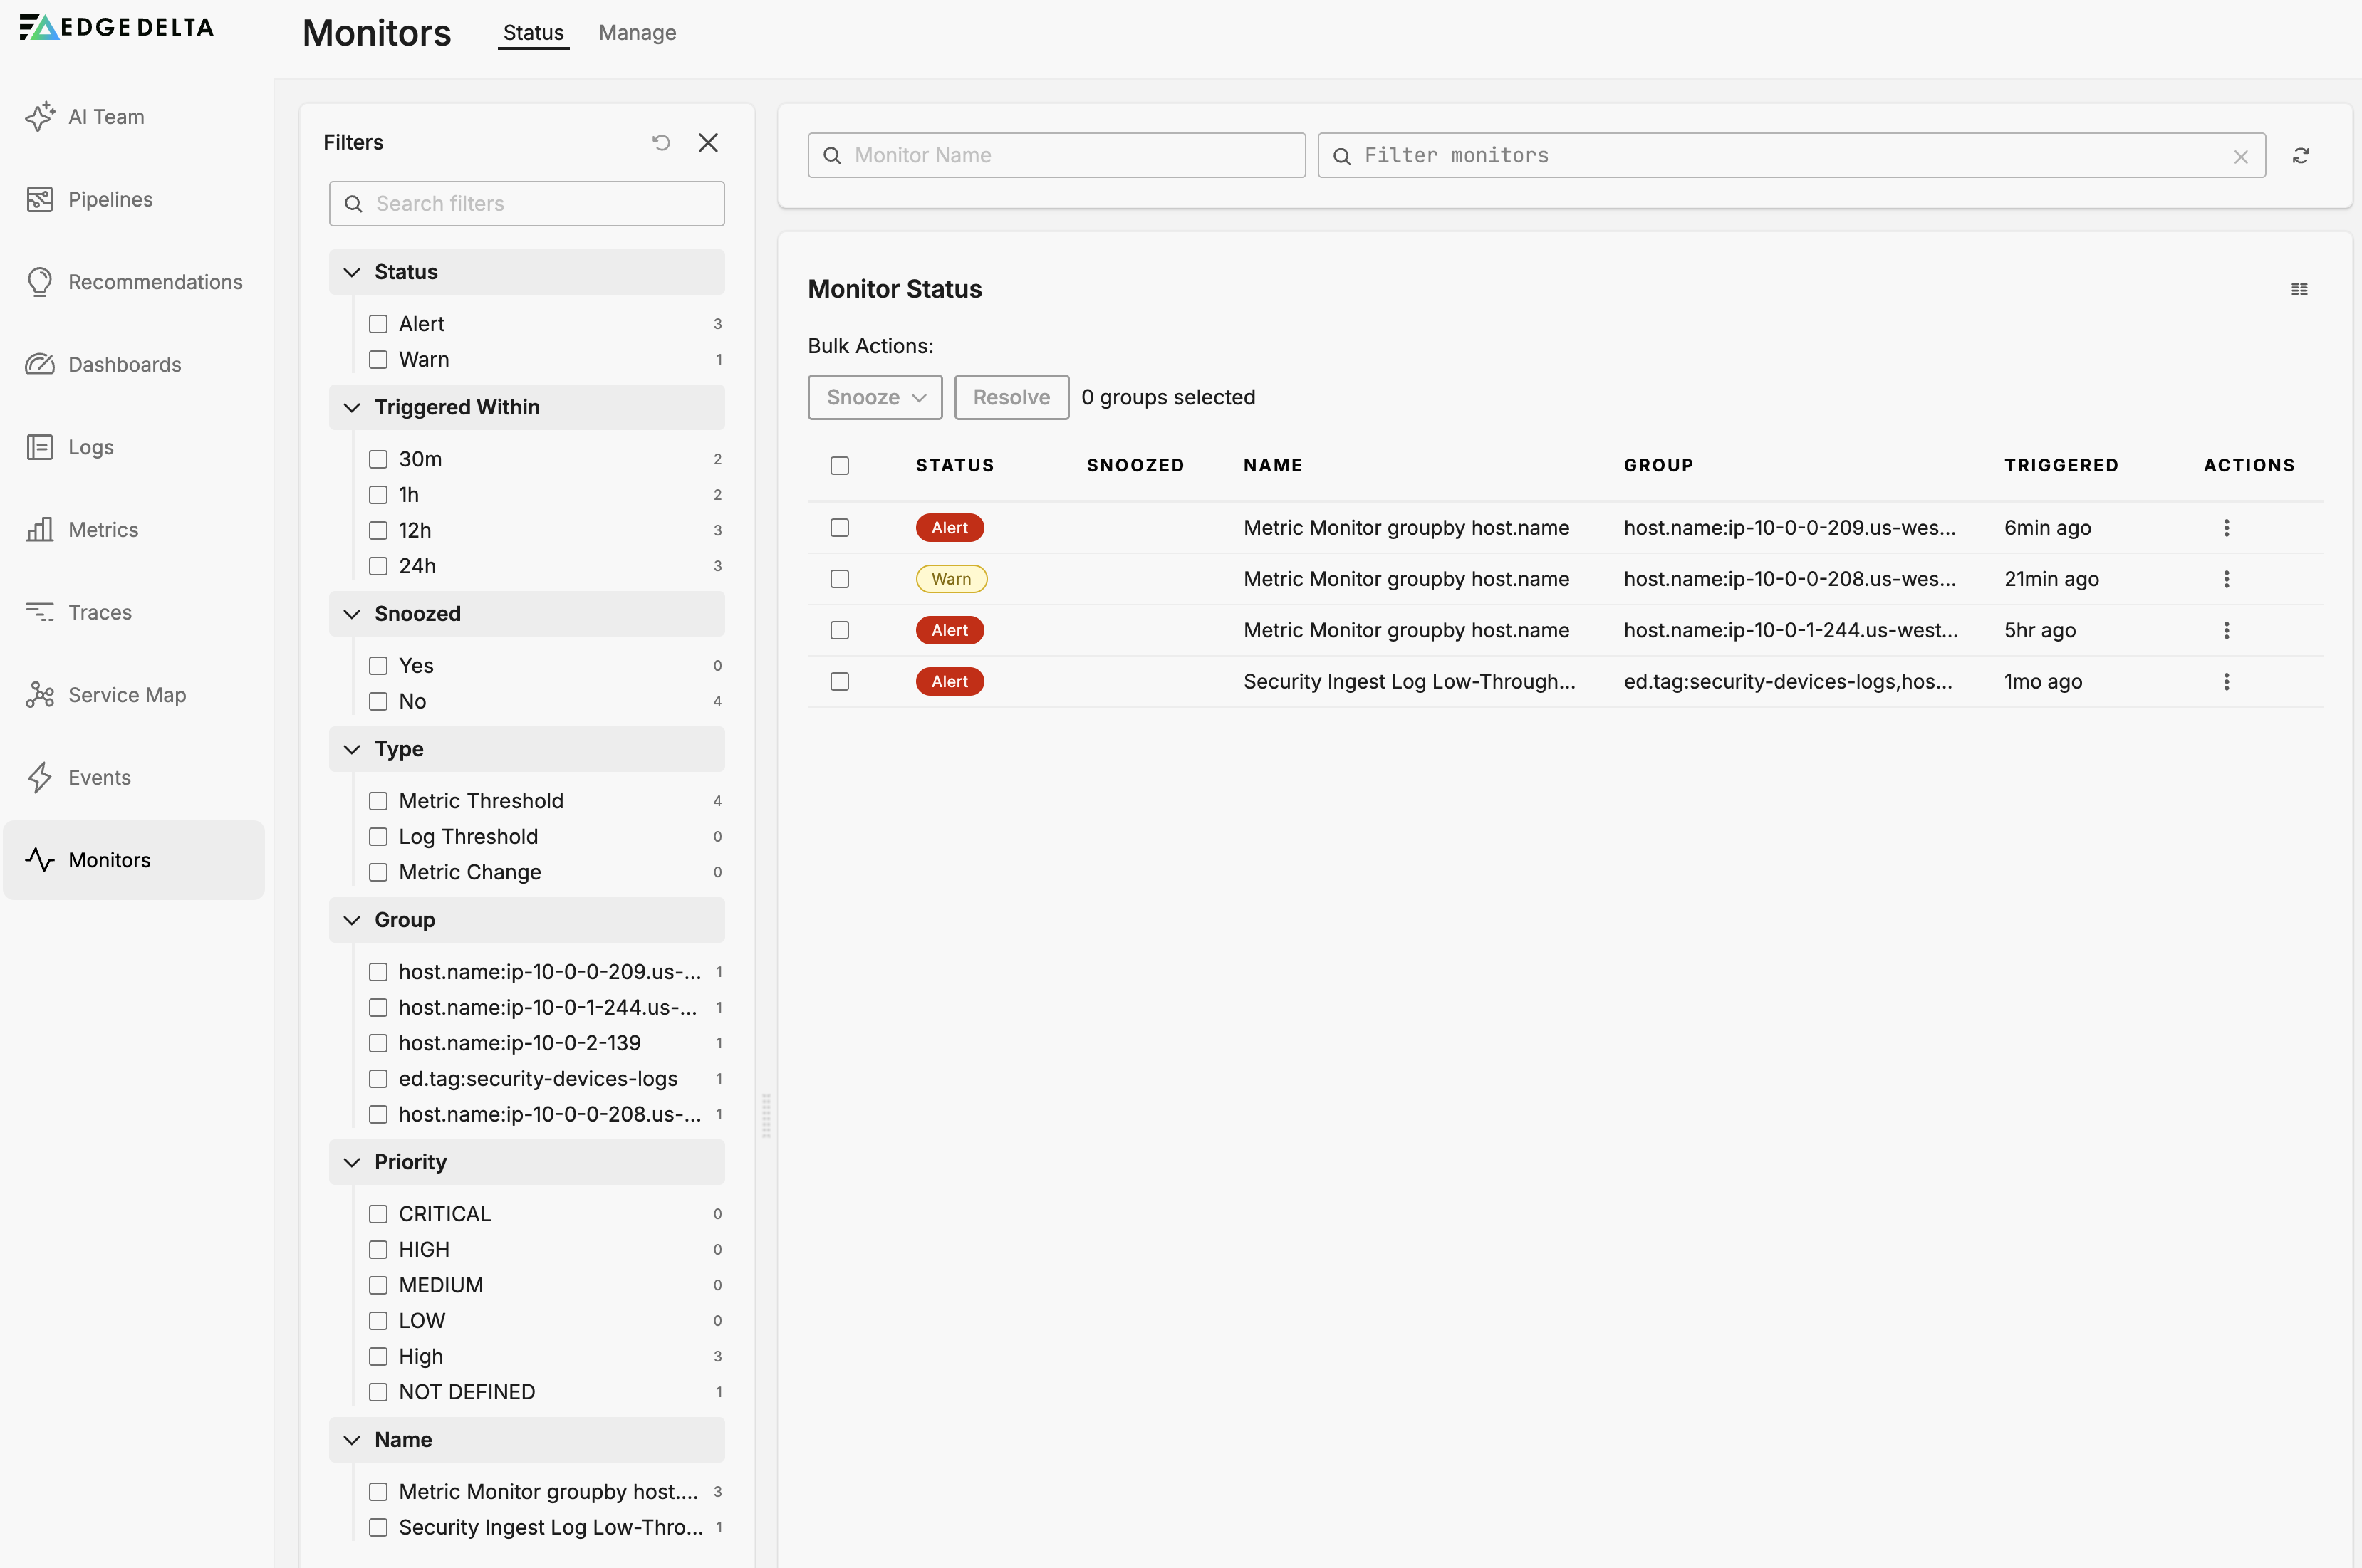
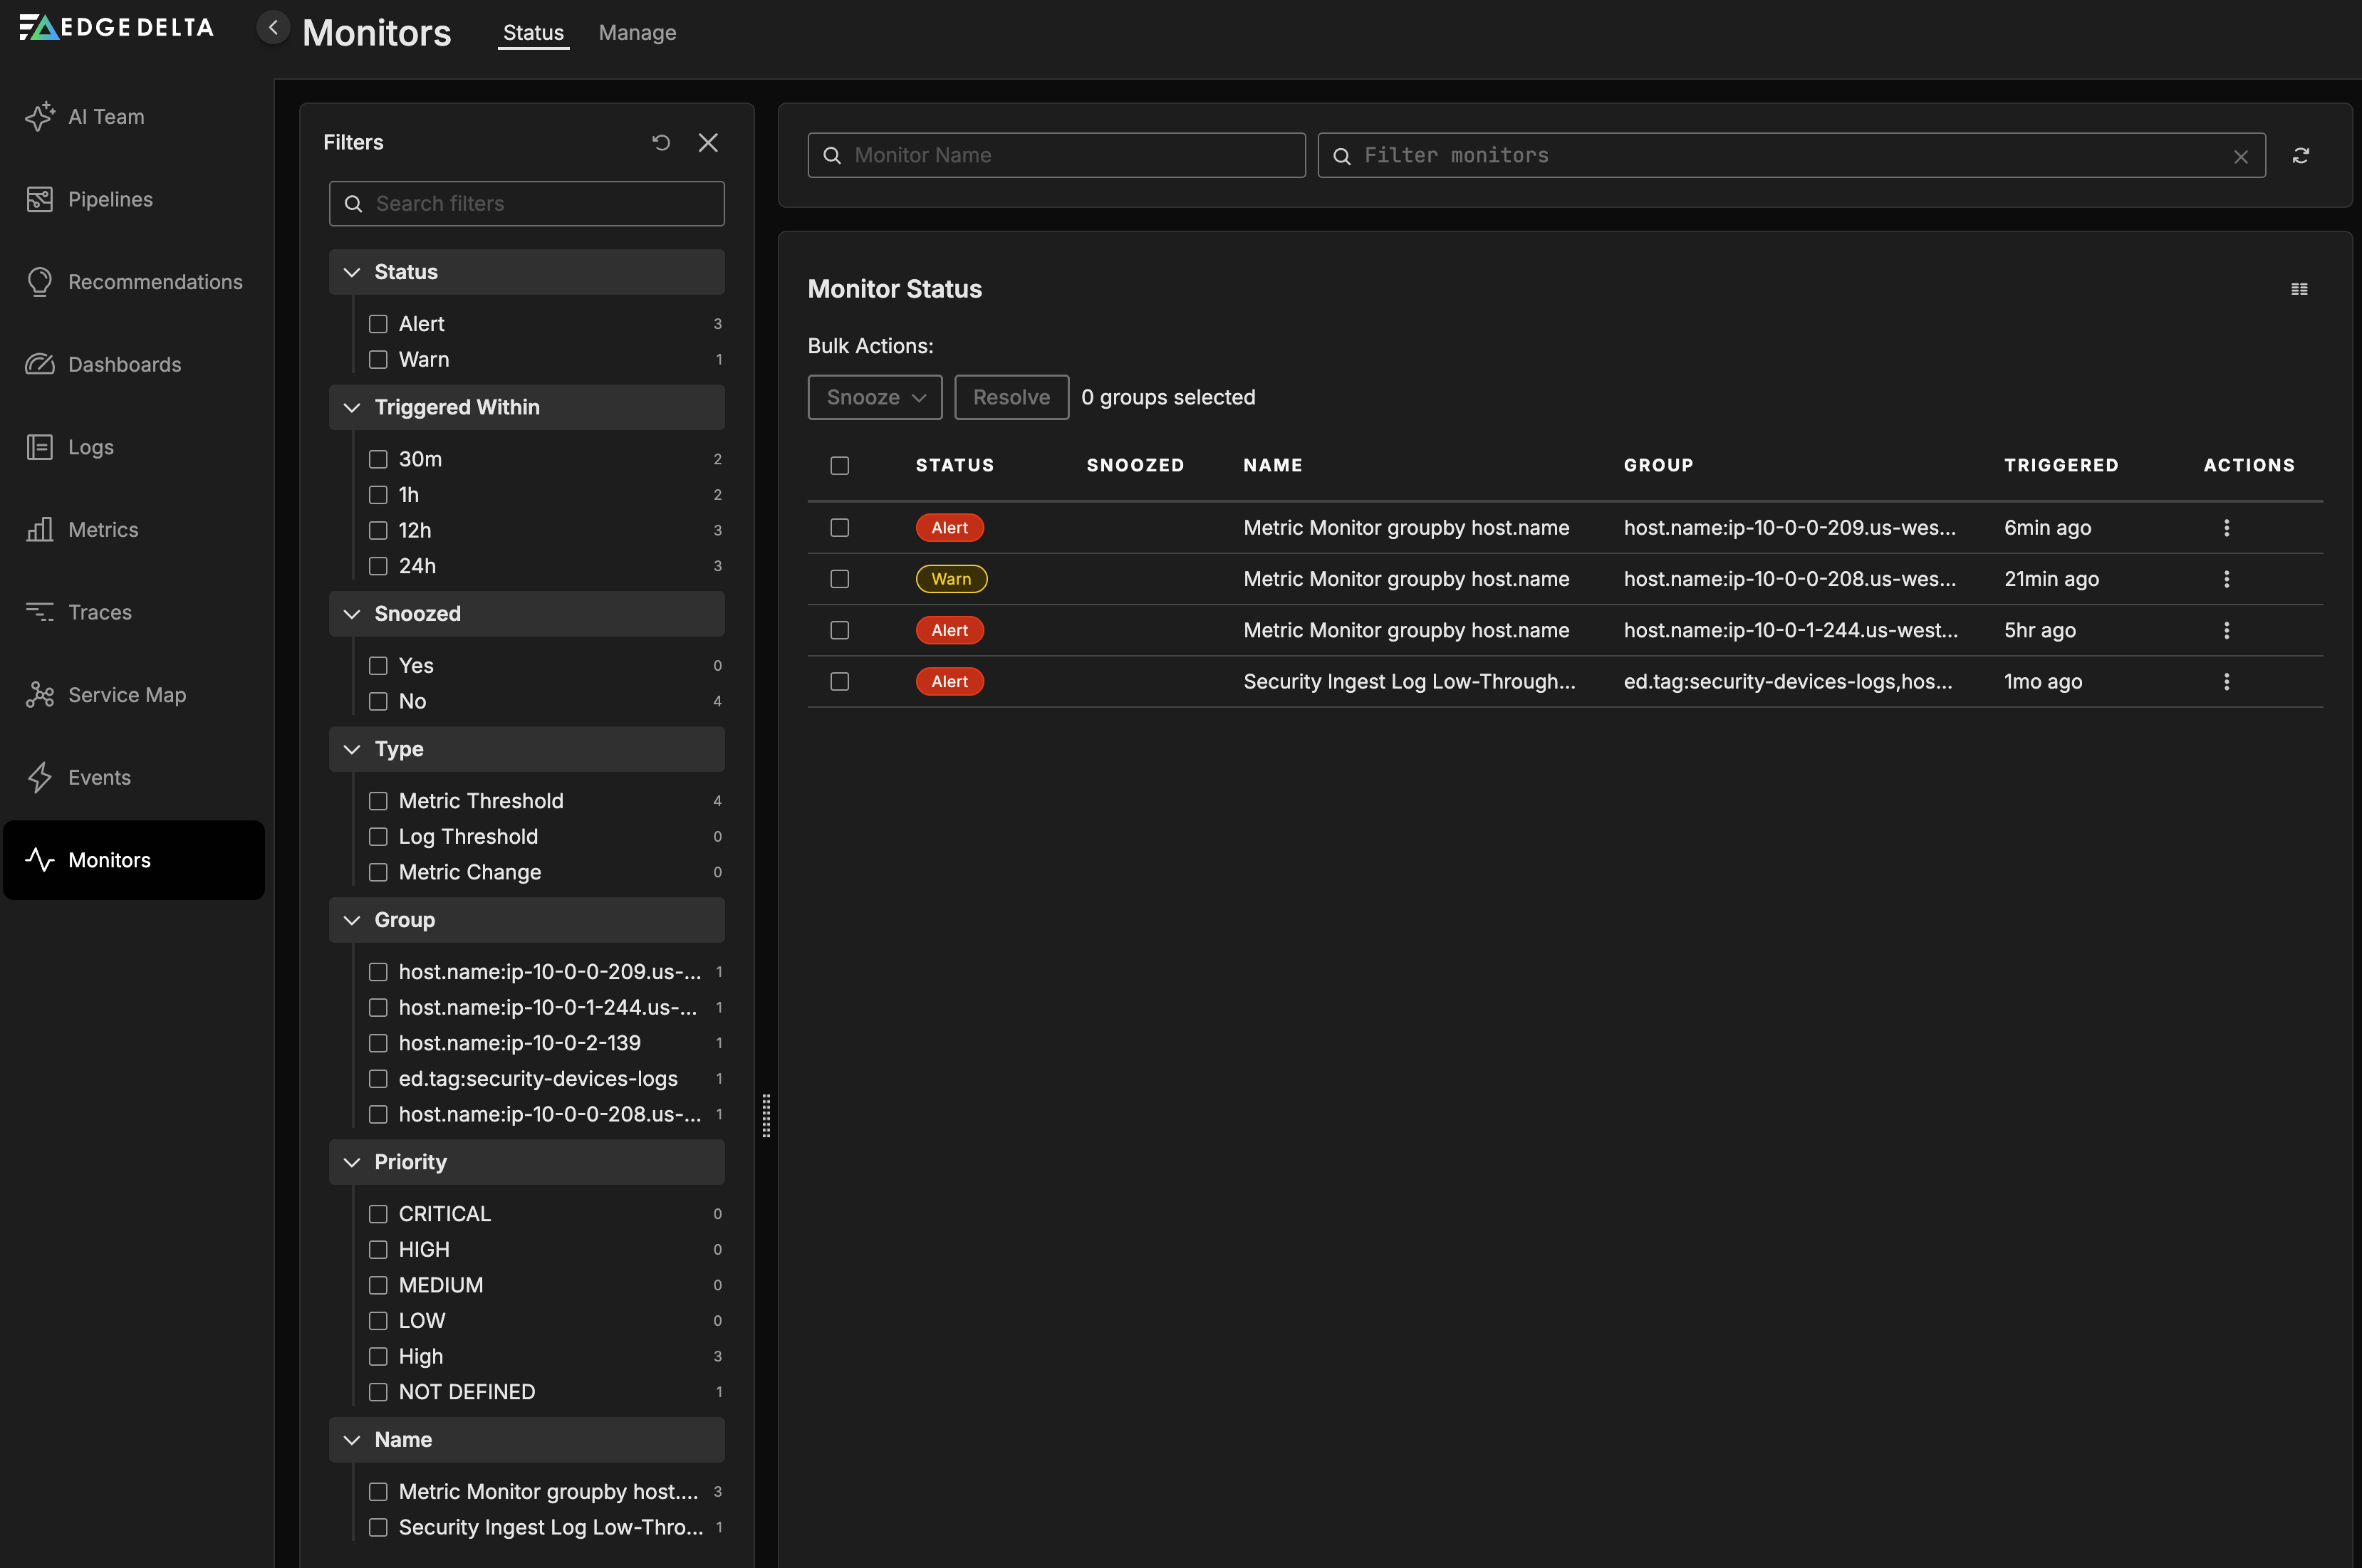
Monitors
Click Monitors and select the Triggered tab to view the default monitors which generate monitor events from across all pipelines and send you alerts about events.