Getting Started with AI Team
15 minute read
Overview
This guide walks you through five steps to get Edge Delta’s AI Team fully operational: connect your observability data, review the monitors provisioned for you, integrate your alerting and code tools, and start AI-powered investigations.
AI teammates operate read-only by default. Any write action (creating an incident, merging a PR, updating a ticket) requires your explicit approval before it executes.
What AI teammates do
Edge Delta ships with five out-of-the-box teammates, each with deep expertise in a specific domain:
- OnCall AI: Orchestrates investigations, routes requests to the right specialist, and synthesizes findings into actionable summaries.
- SRE: Detects incidents, correlates logs, metrics, and traces, builds timelines, proposes mitigations, and pages on-call engineers.
- Code Analyzer: Reviews pull requests for risks and missing tests, investigates CI/CD failures, and correlates code changes with production issues.
- Security Engineer: Analyzes access patterns, reviews IAM configurations, surfaces code vulnerabilities, and detects leaked secrets.
- Work Tracker: Tracks work across GitHub, Jira, and Linear, surfaces unowned items, and proposes ticket creation for gaps.
Each teammate activates fully once the right connectors are in place. The steps below walk you through connecting them in the recommended order.
For full details on each teammate’s capabilities, see Specialized Teammates.
Sign up and prerequisites
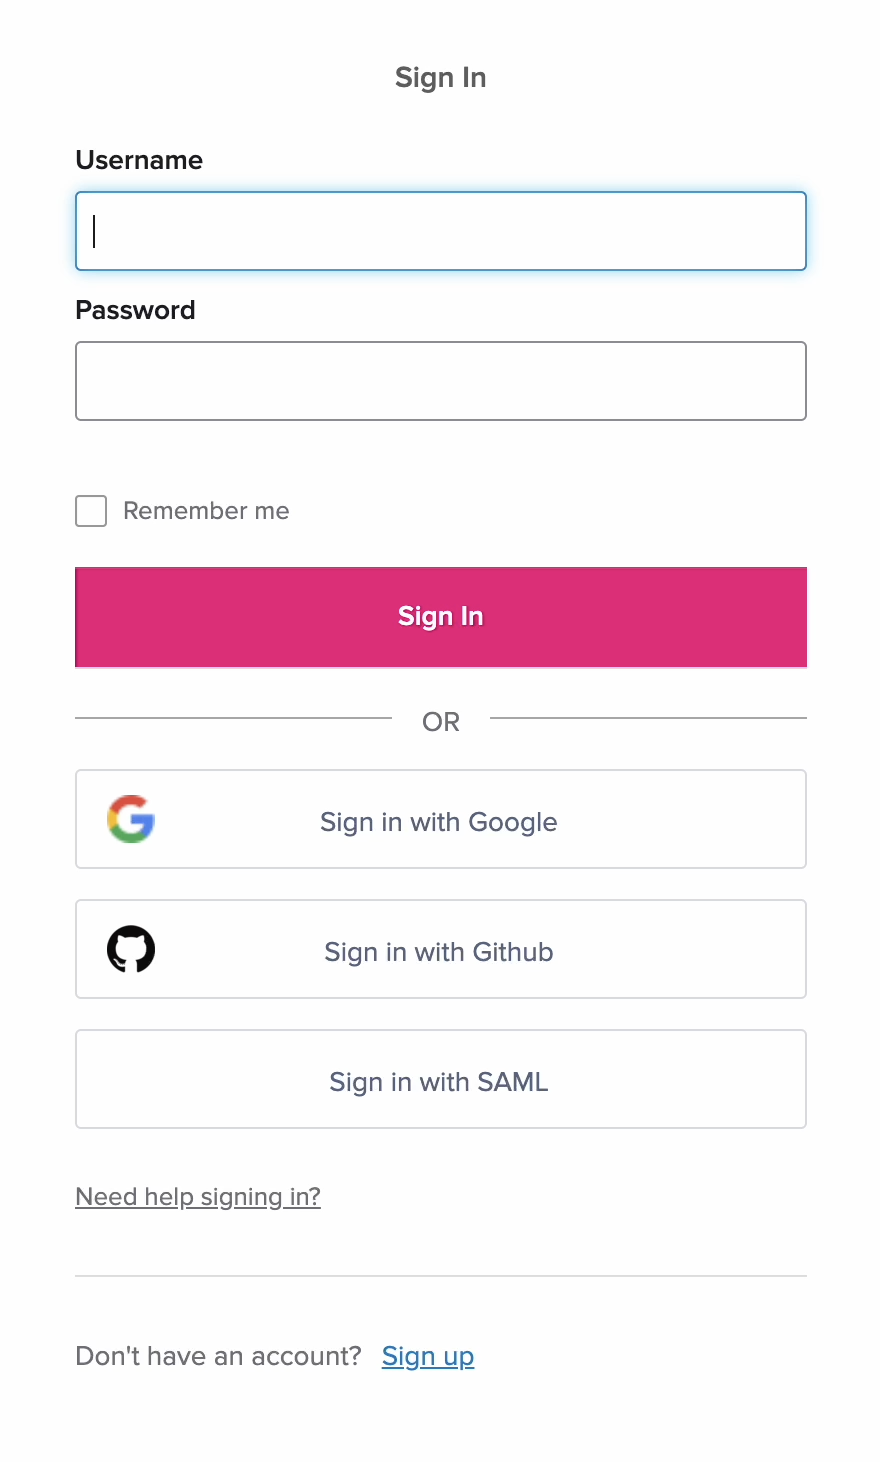
If you do not have an Edge Delta account:
- Visit the Edge Delta application.
- Click Sign Up.
Select a plan and click Create Your Account.
Complete the payment setup in the plan payment portal.
Enter your account details and click Register. Alternatively, click Sign up with Google.
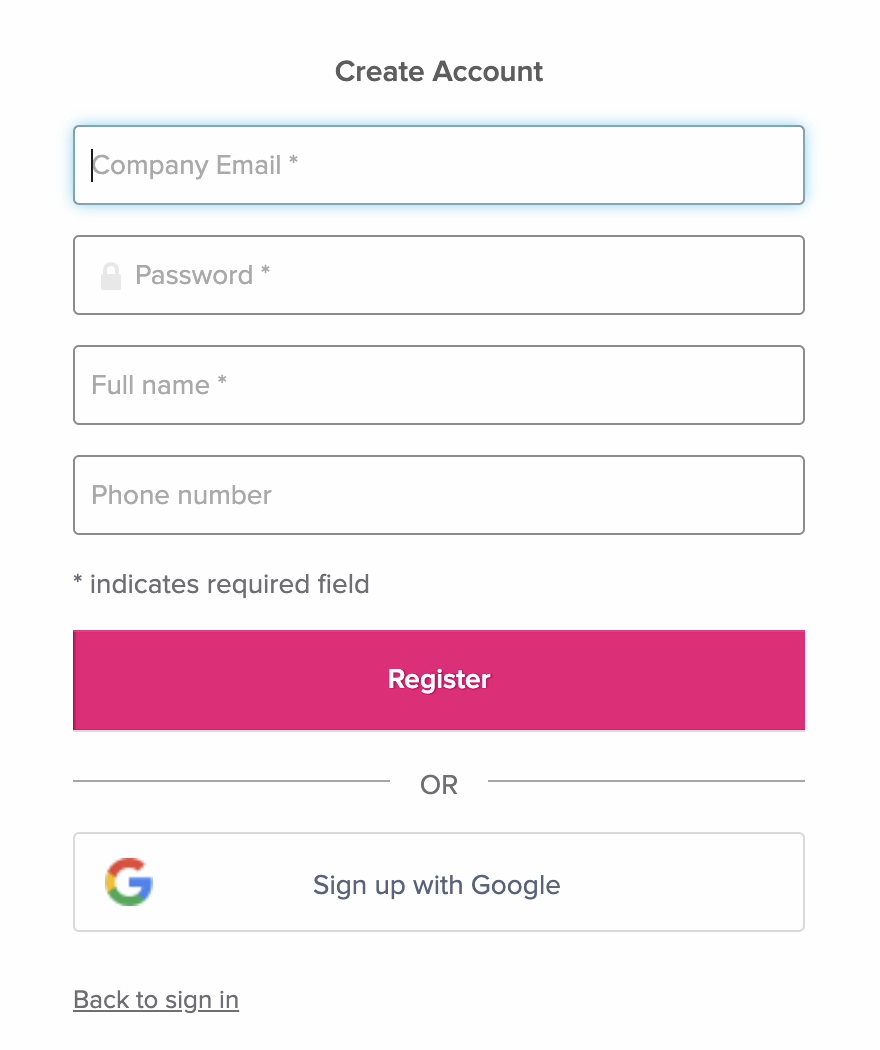
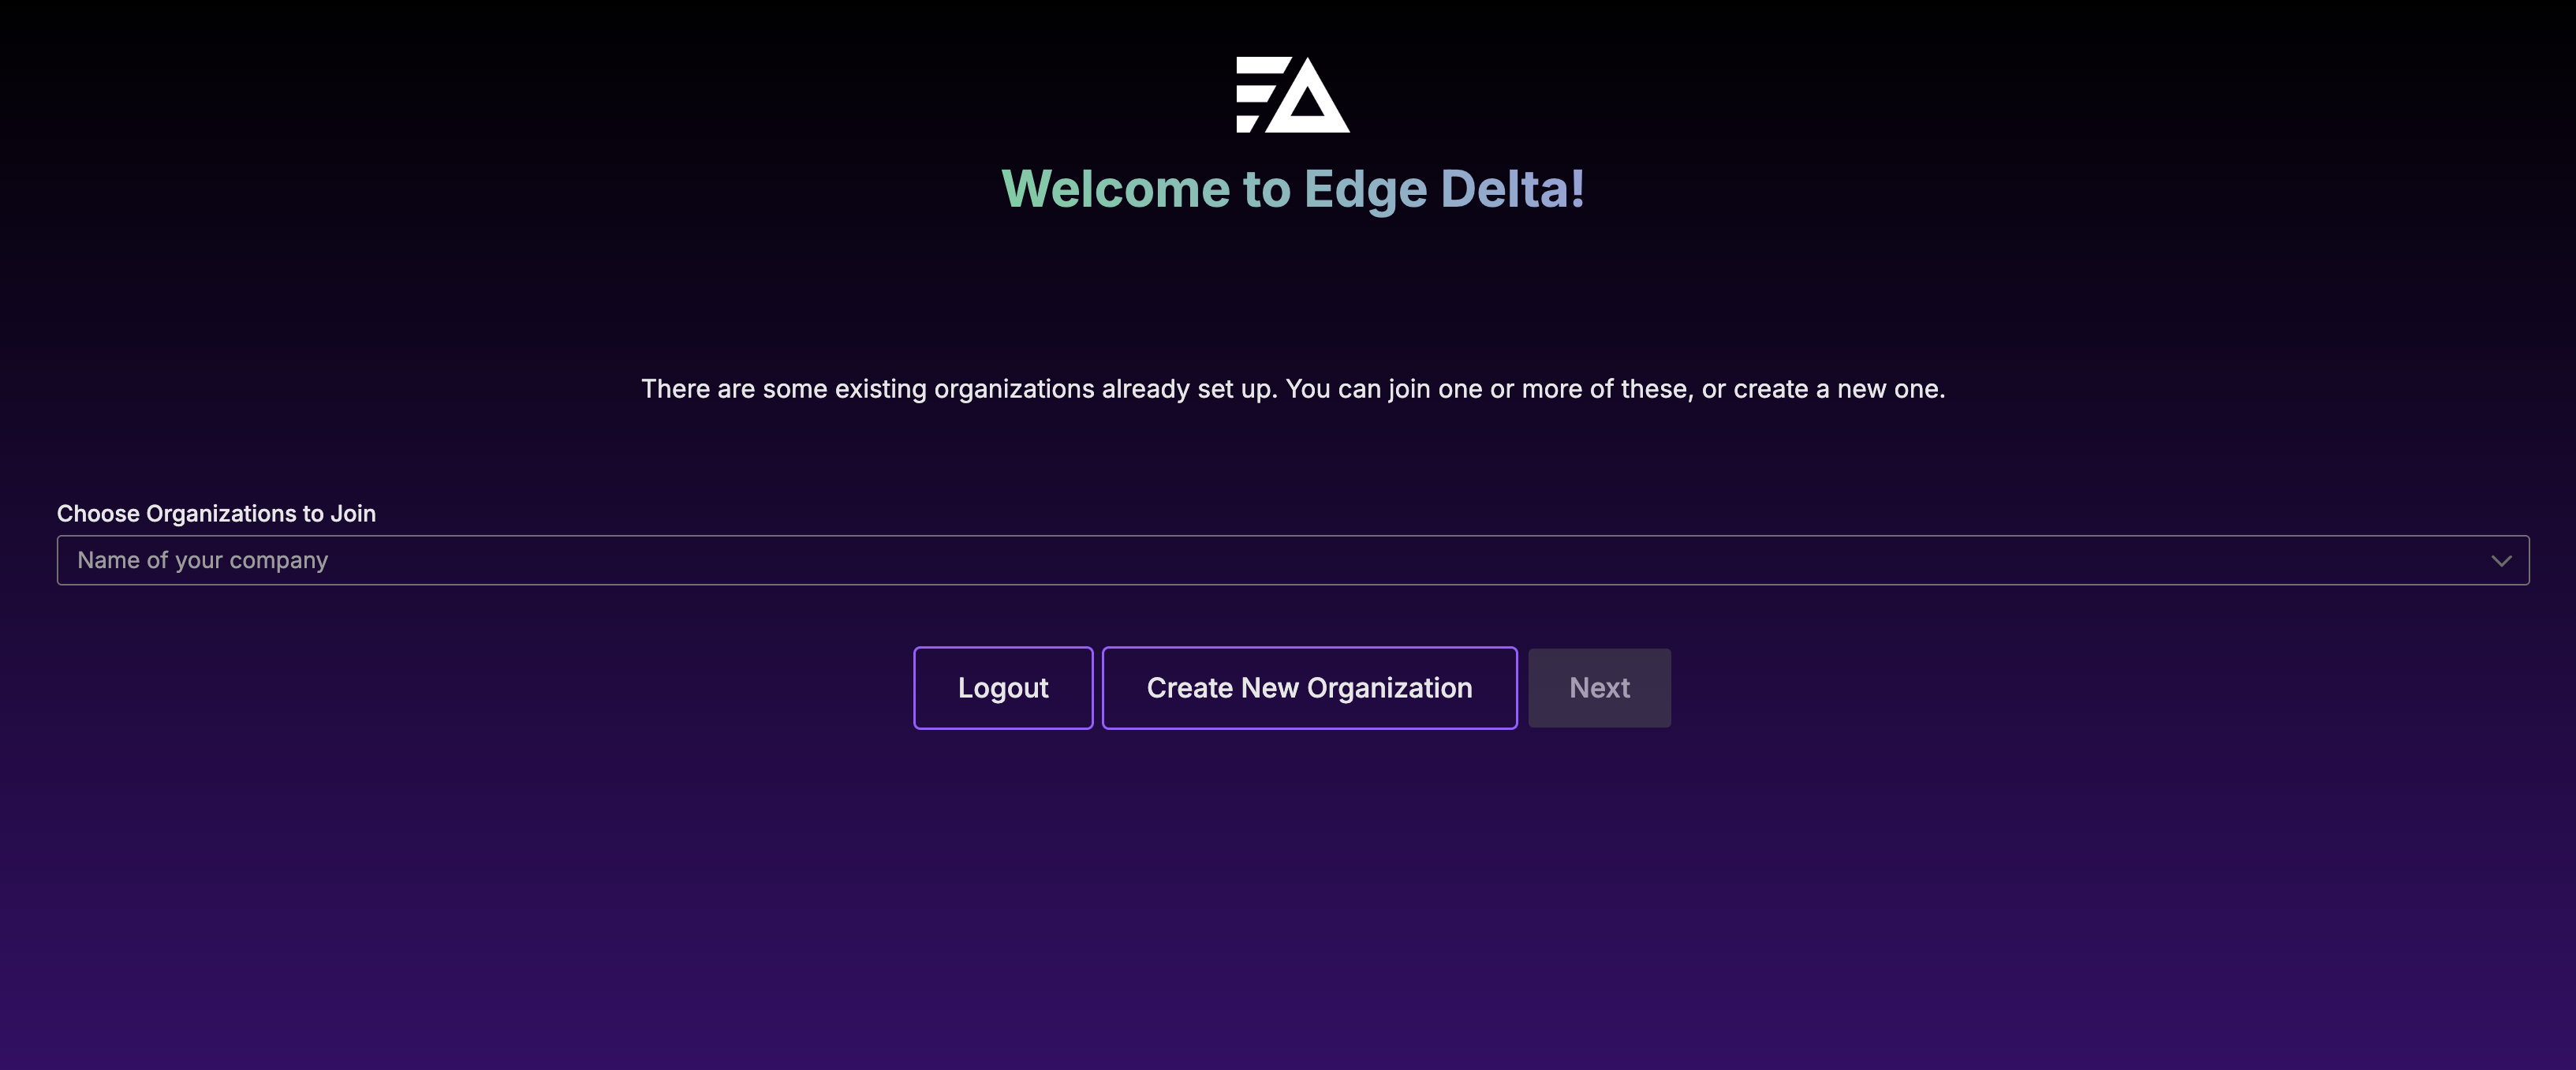
Your selected password must adhere to the criteria for validation. You can join an existing organization if they allow your email domain. For a quick start in your own organization, click Create New Organization.
You also need:
- Access to a Kubernetes cluster (recommended) or another telemetry source
- Credentials for PagerDuty, GitHub/GitLab, and Jira/Linear if you use them
Step 1: Connect your observability data
AI teammates need telemetry to reason about your systems. Connecting an observability data source is the required first step.
Kubernetes (fastest path)
The Kubernetes connector is a bundled connector that provisions five telemetry sources in a single action:
| Signal | What it collects |
|---|---|
| Logs | Container stdout/stderr from pods across namespaces |
| Metrics | Cluster and workload metrics (CPU, memory, disk I/O) |
| Traces | Distributed application traces across pod boundaries |
| Service Map | Live inter-service communication topology built from network traffic |
| Events | Pod, Node, Deployment, StatefulSet, and Service lifecycle events |
To connect:
- Navigate to AI Team > Connectors
- Click Browse all Connectors
- Click the Kubernetes connector card
- Enter a connector name
- Click Kubernetes
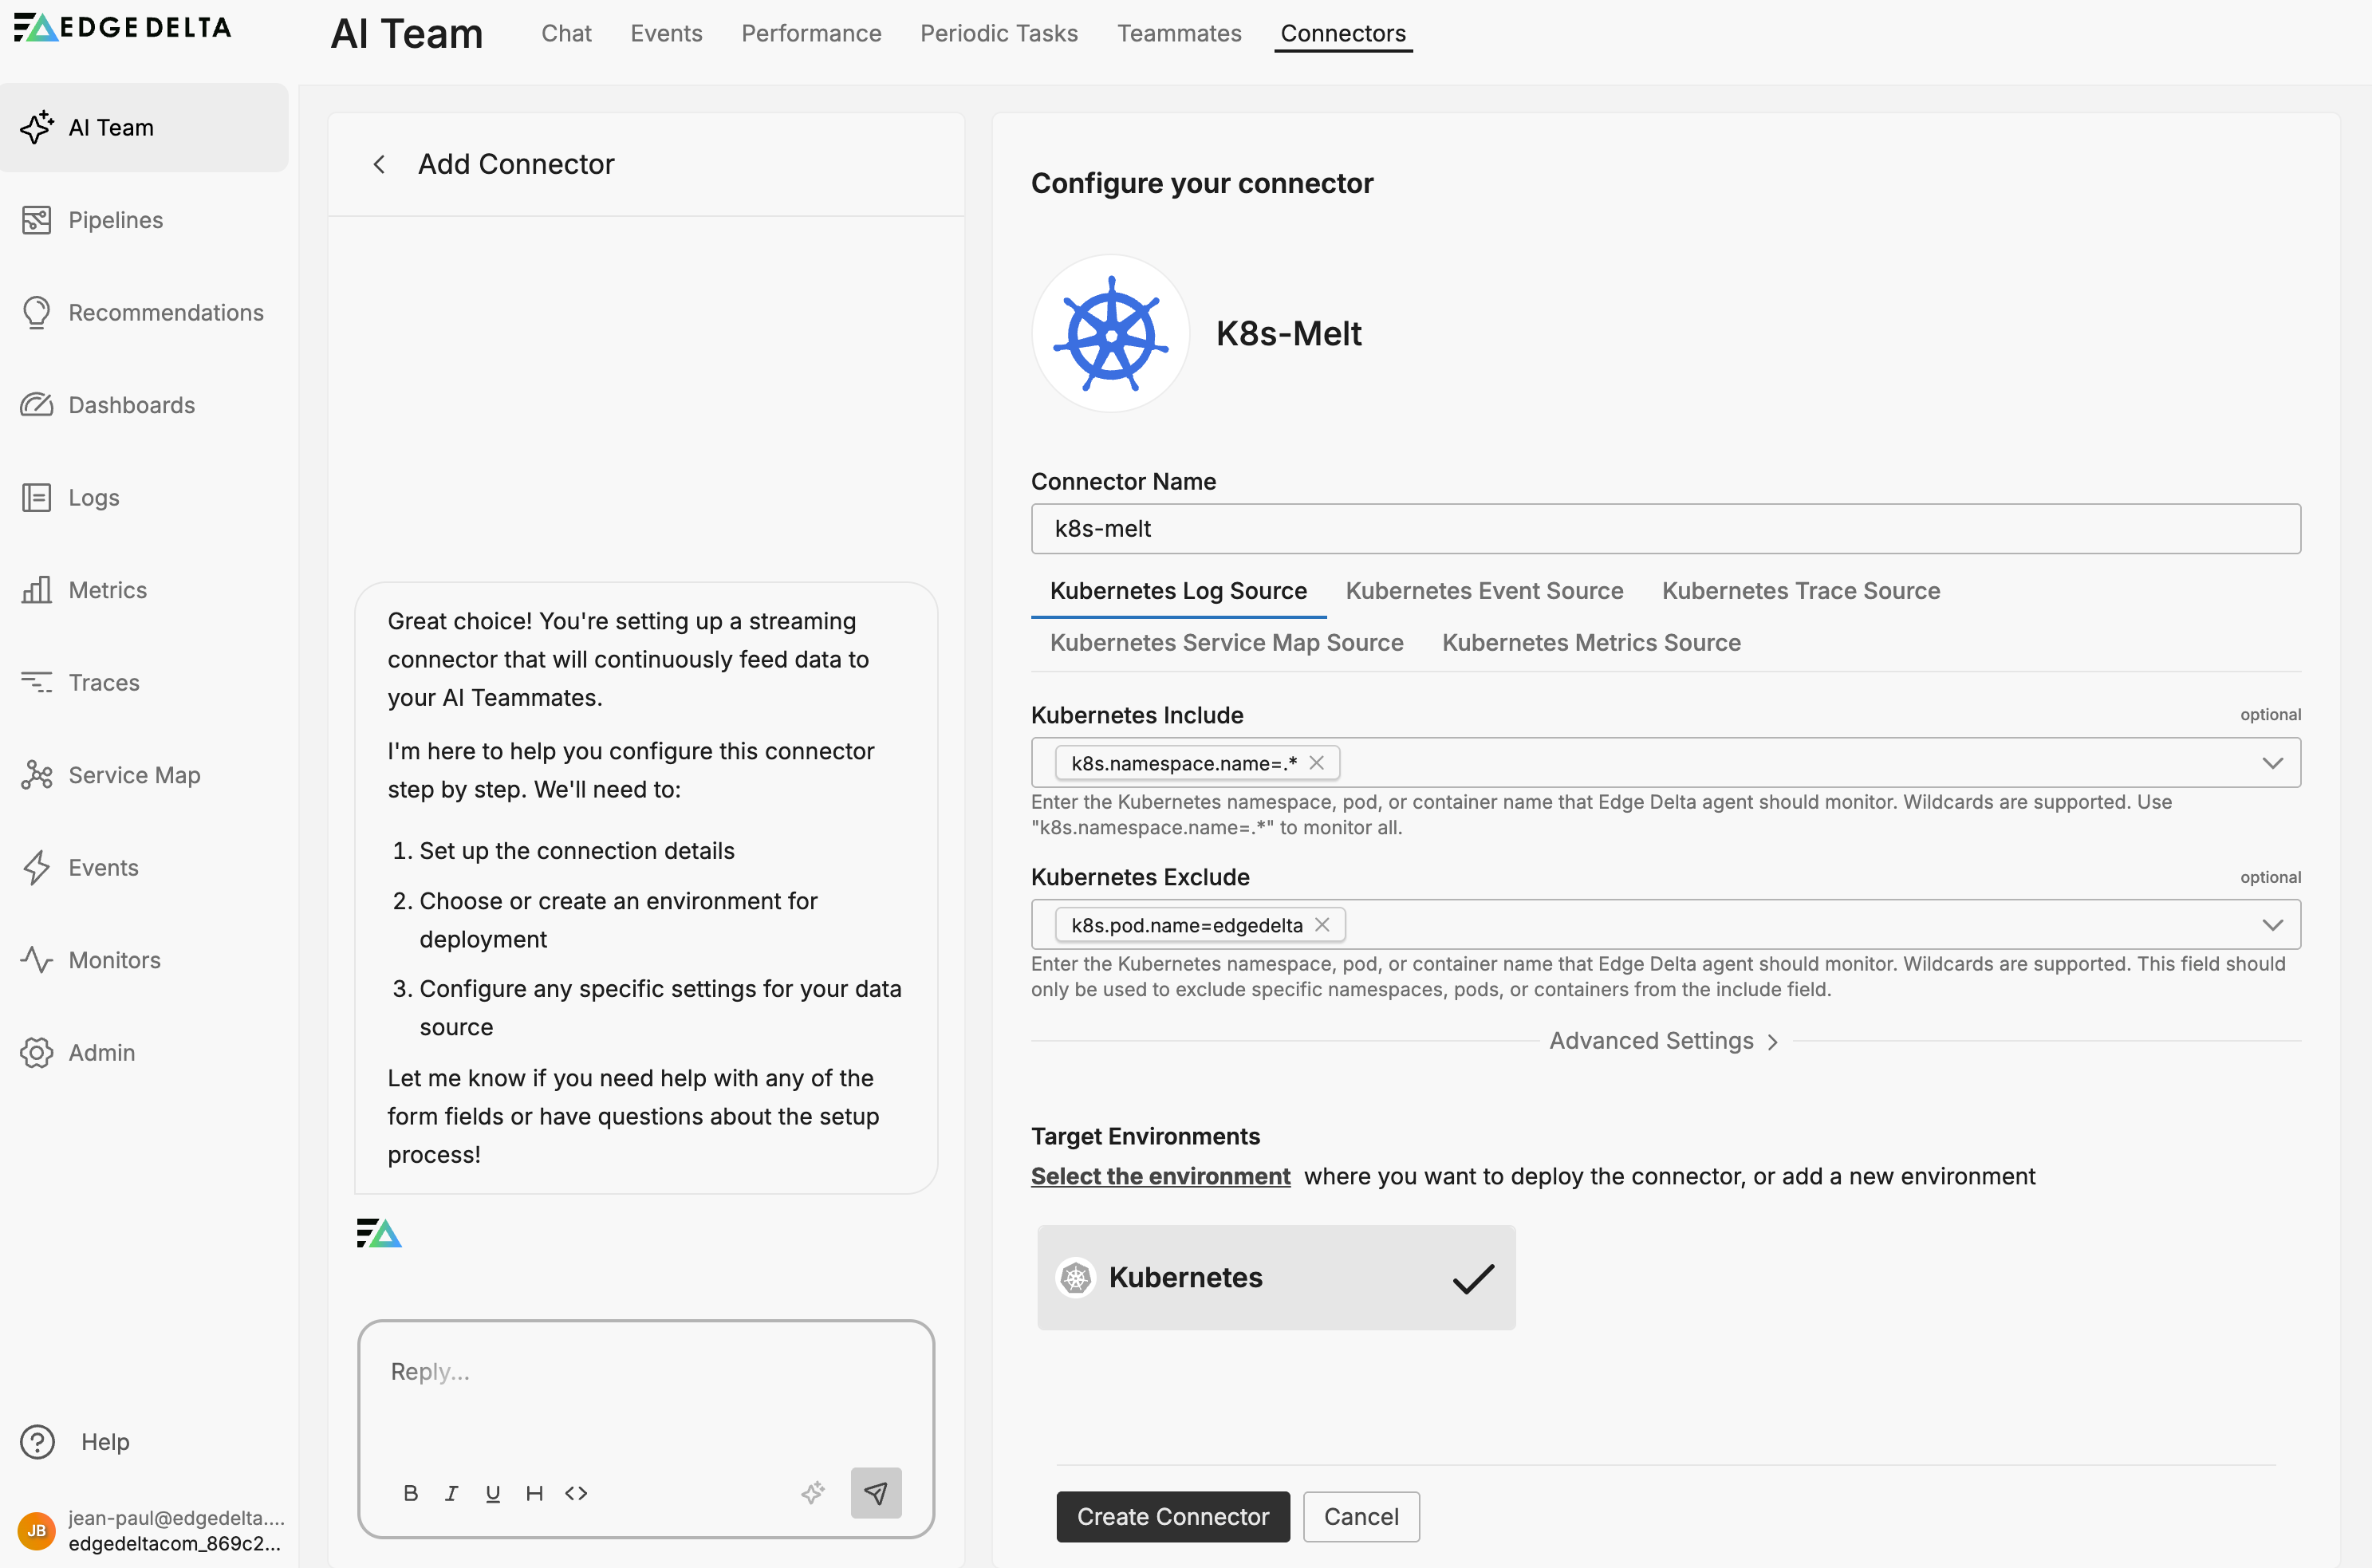
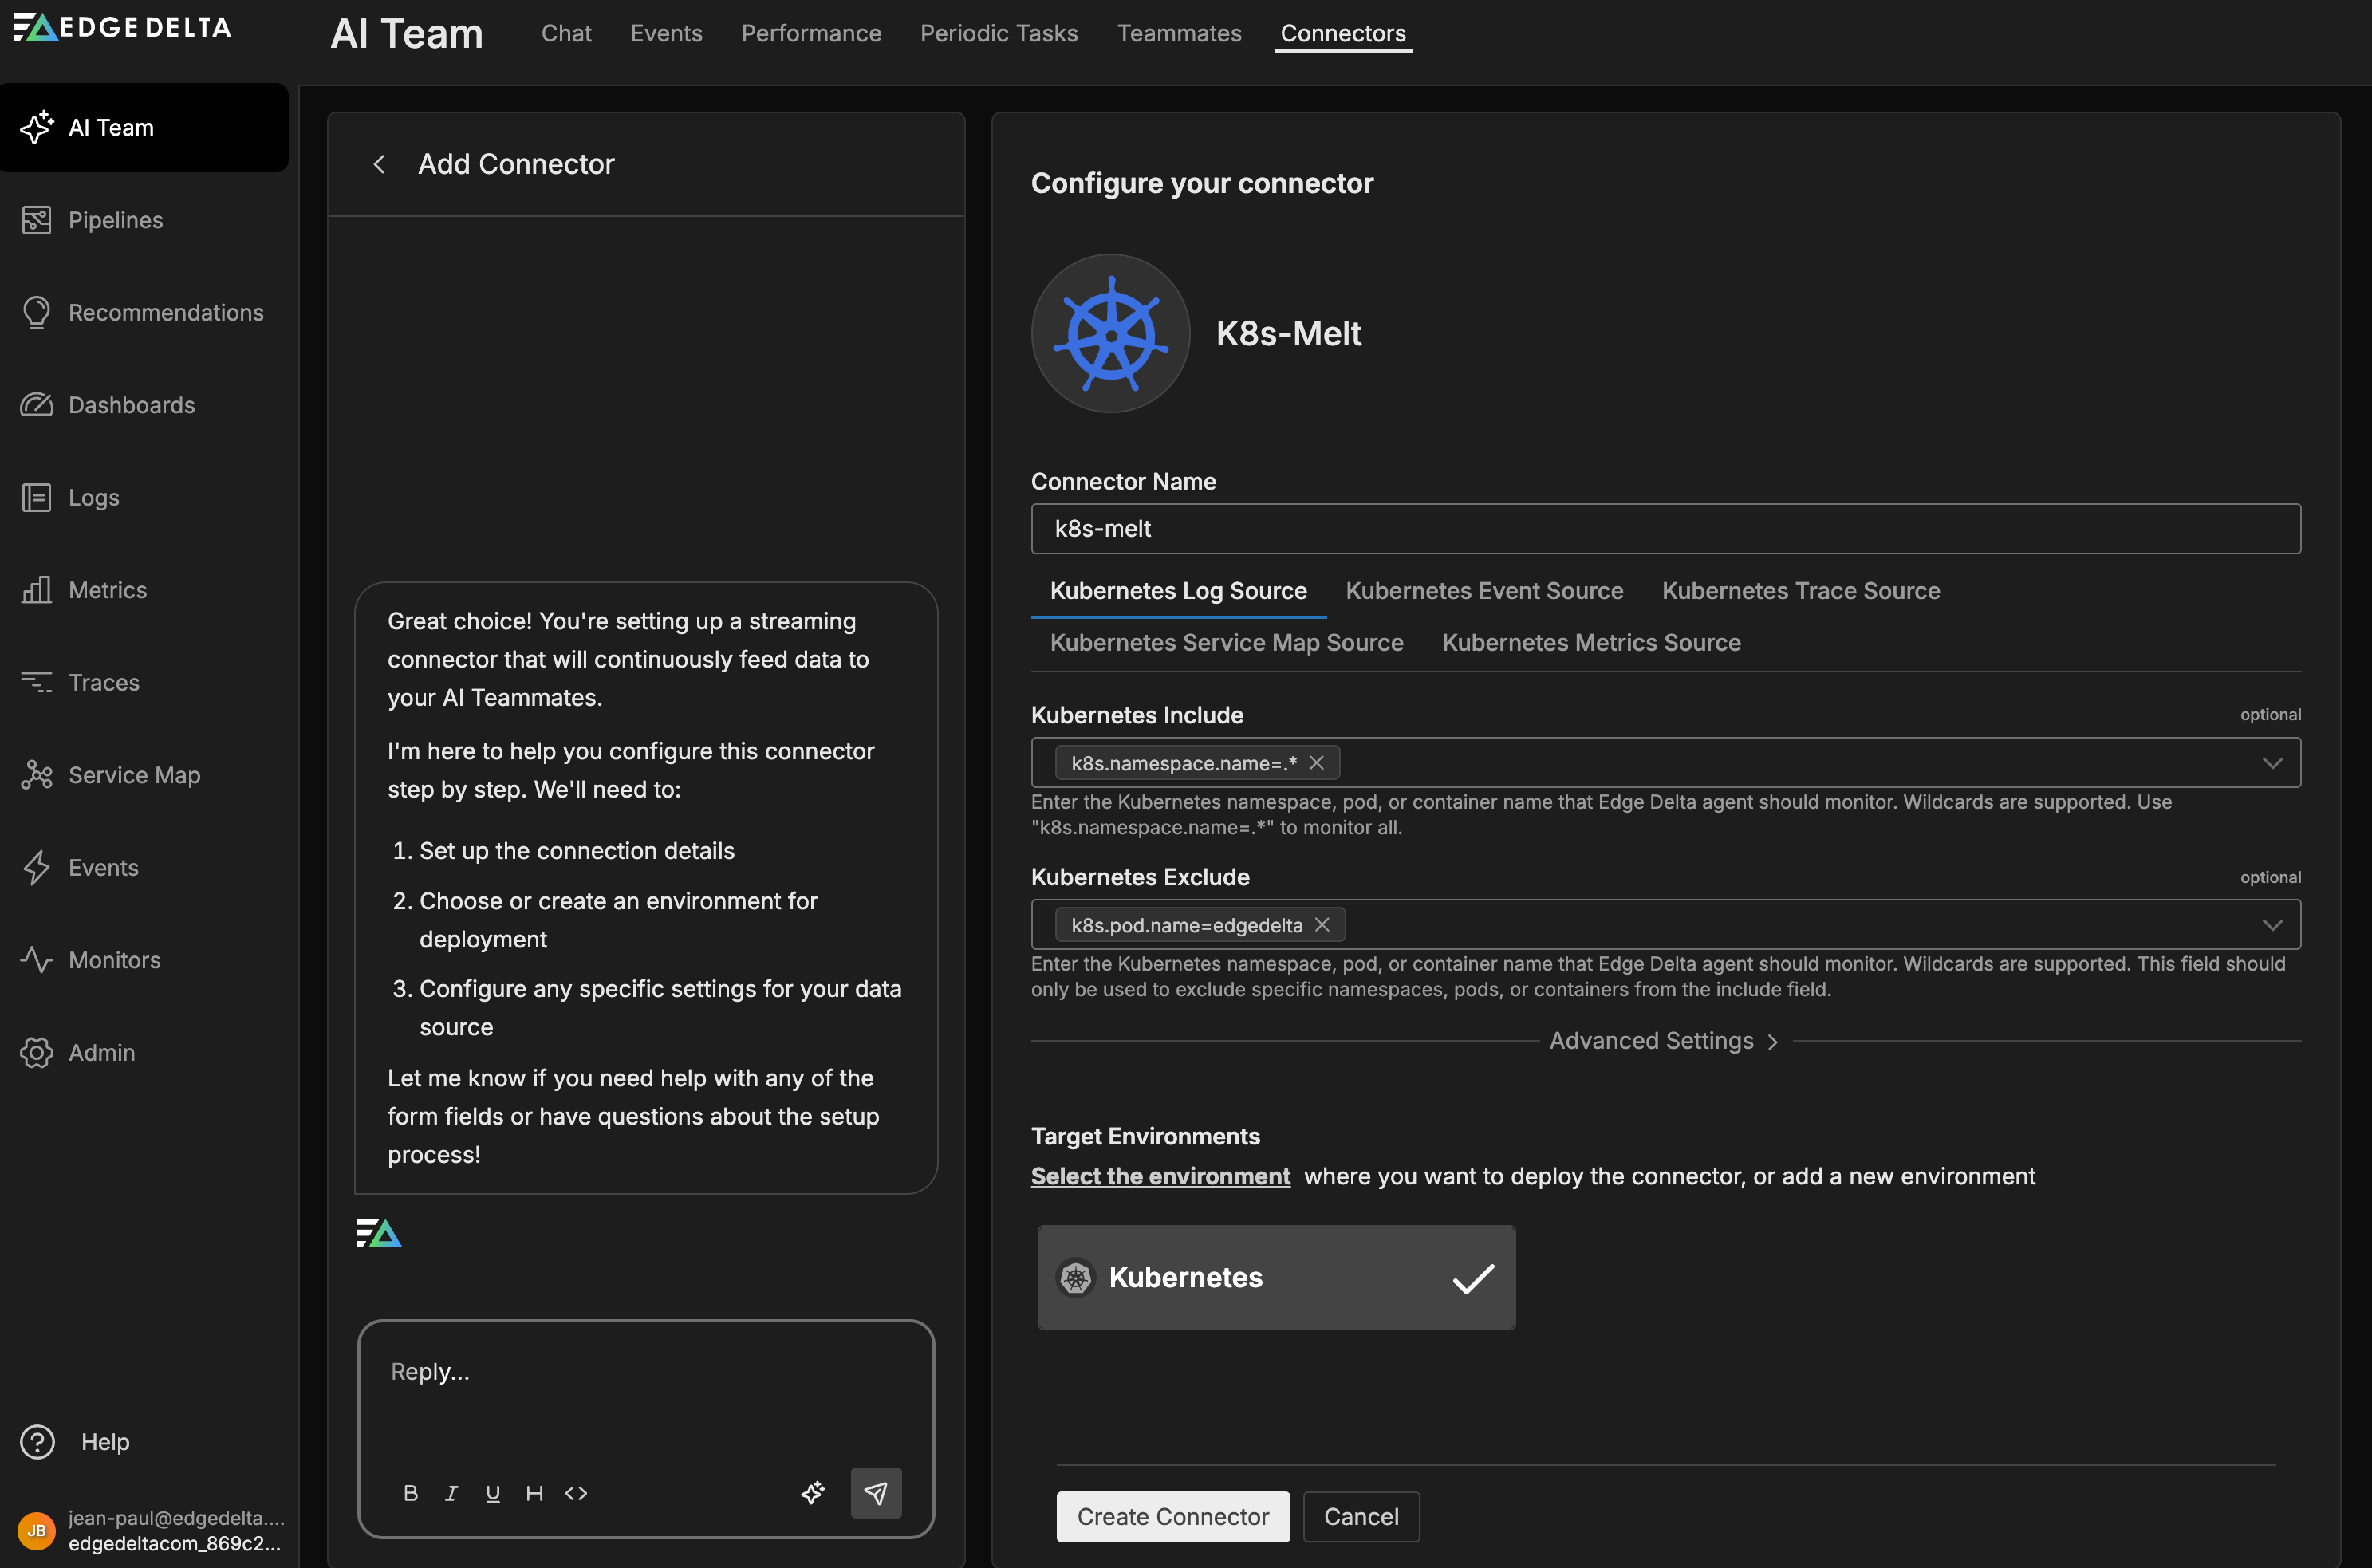
- Click Create Connector
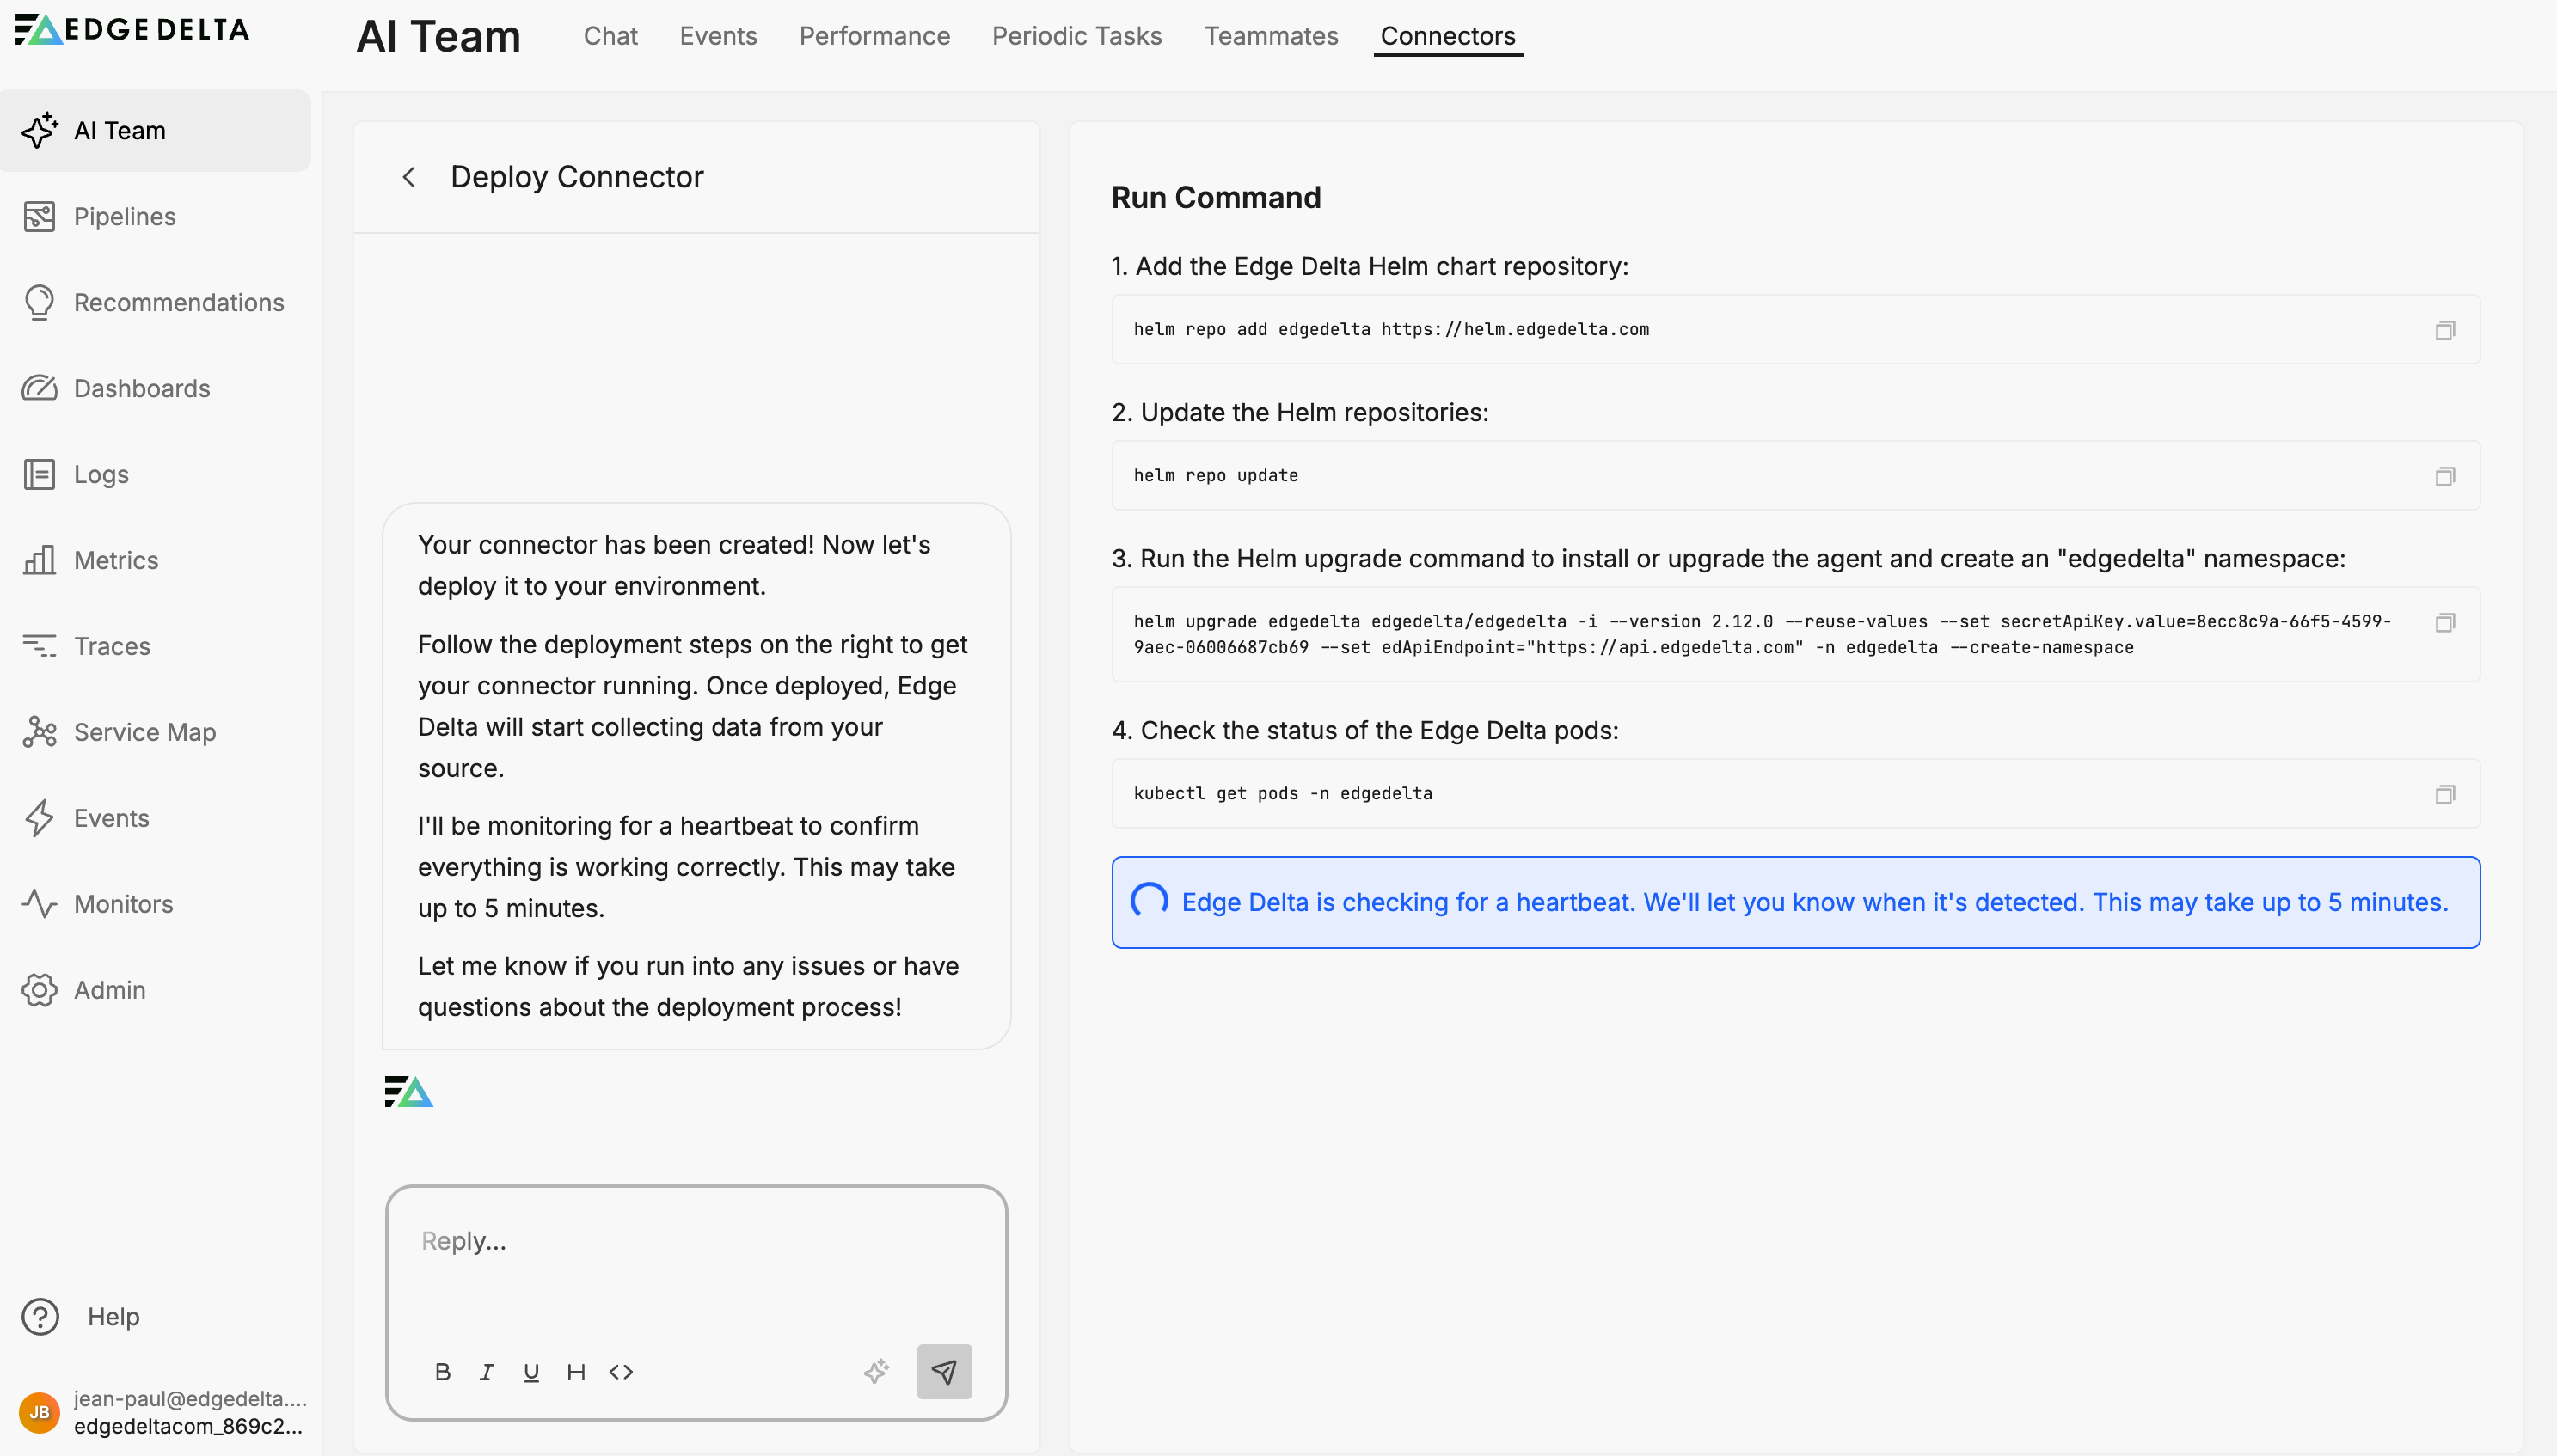
The commands appear to install the new pipeline: run these commands on your cluster.
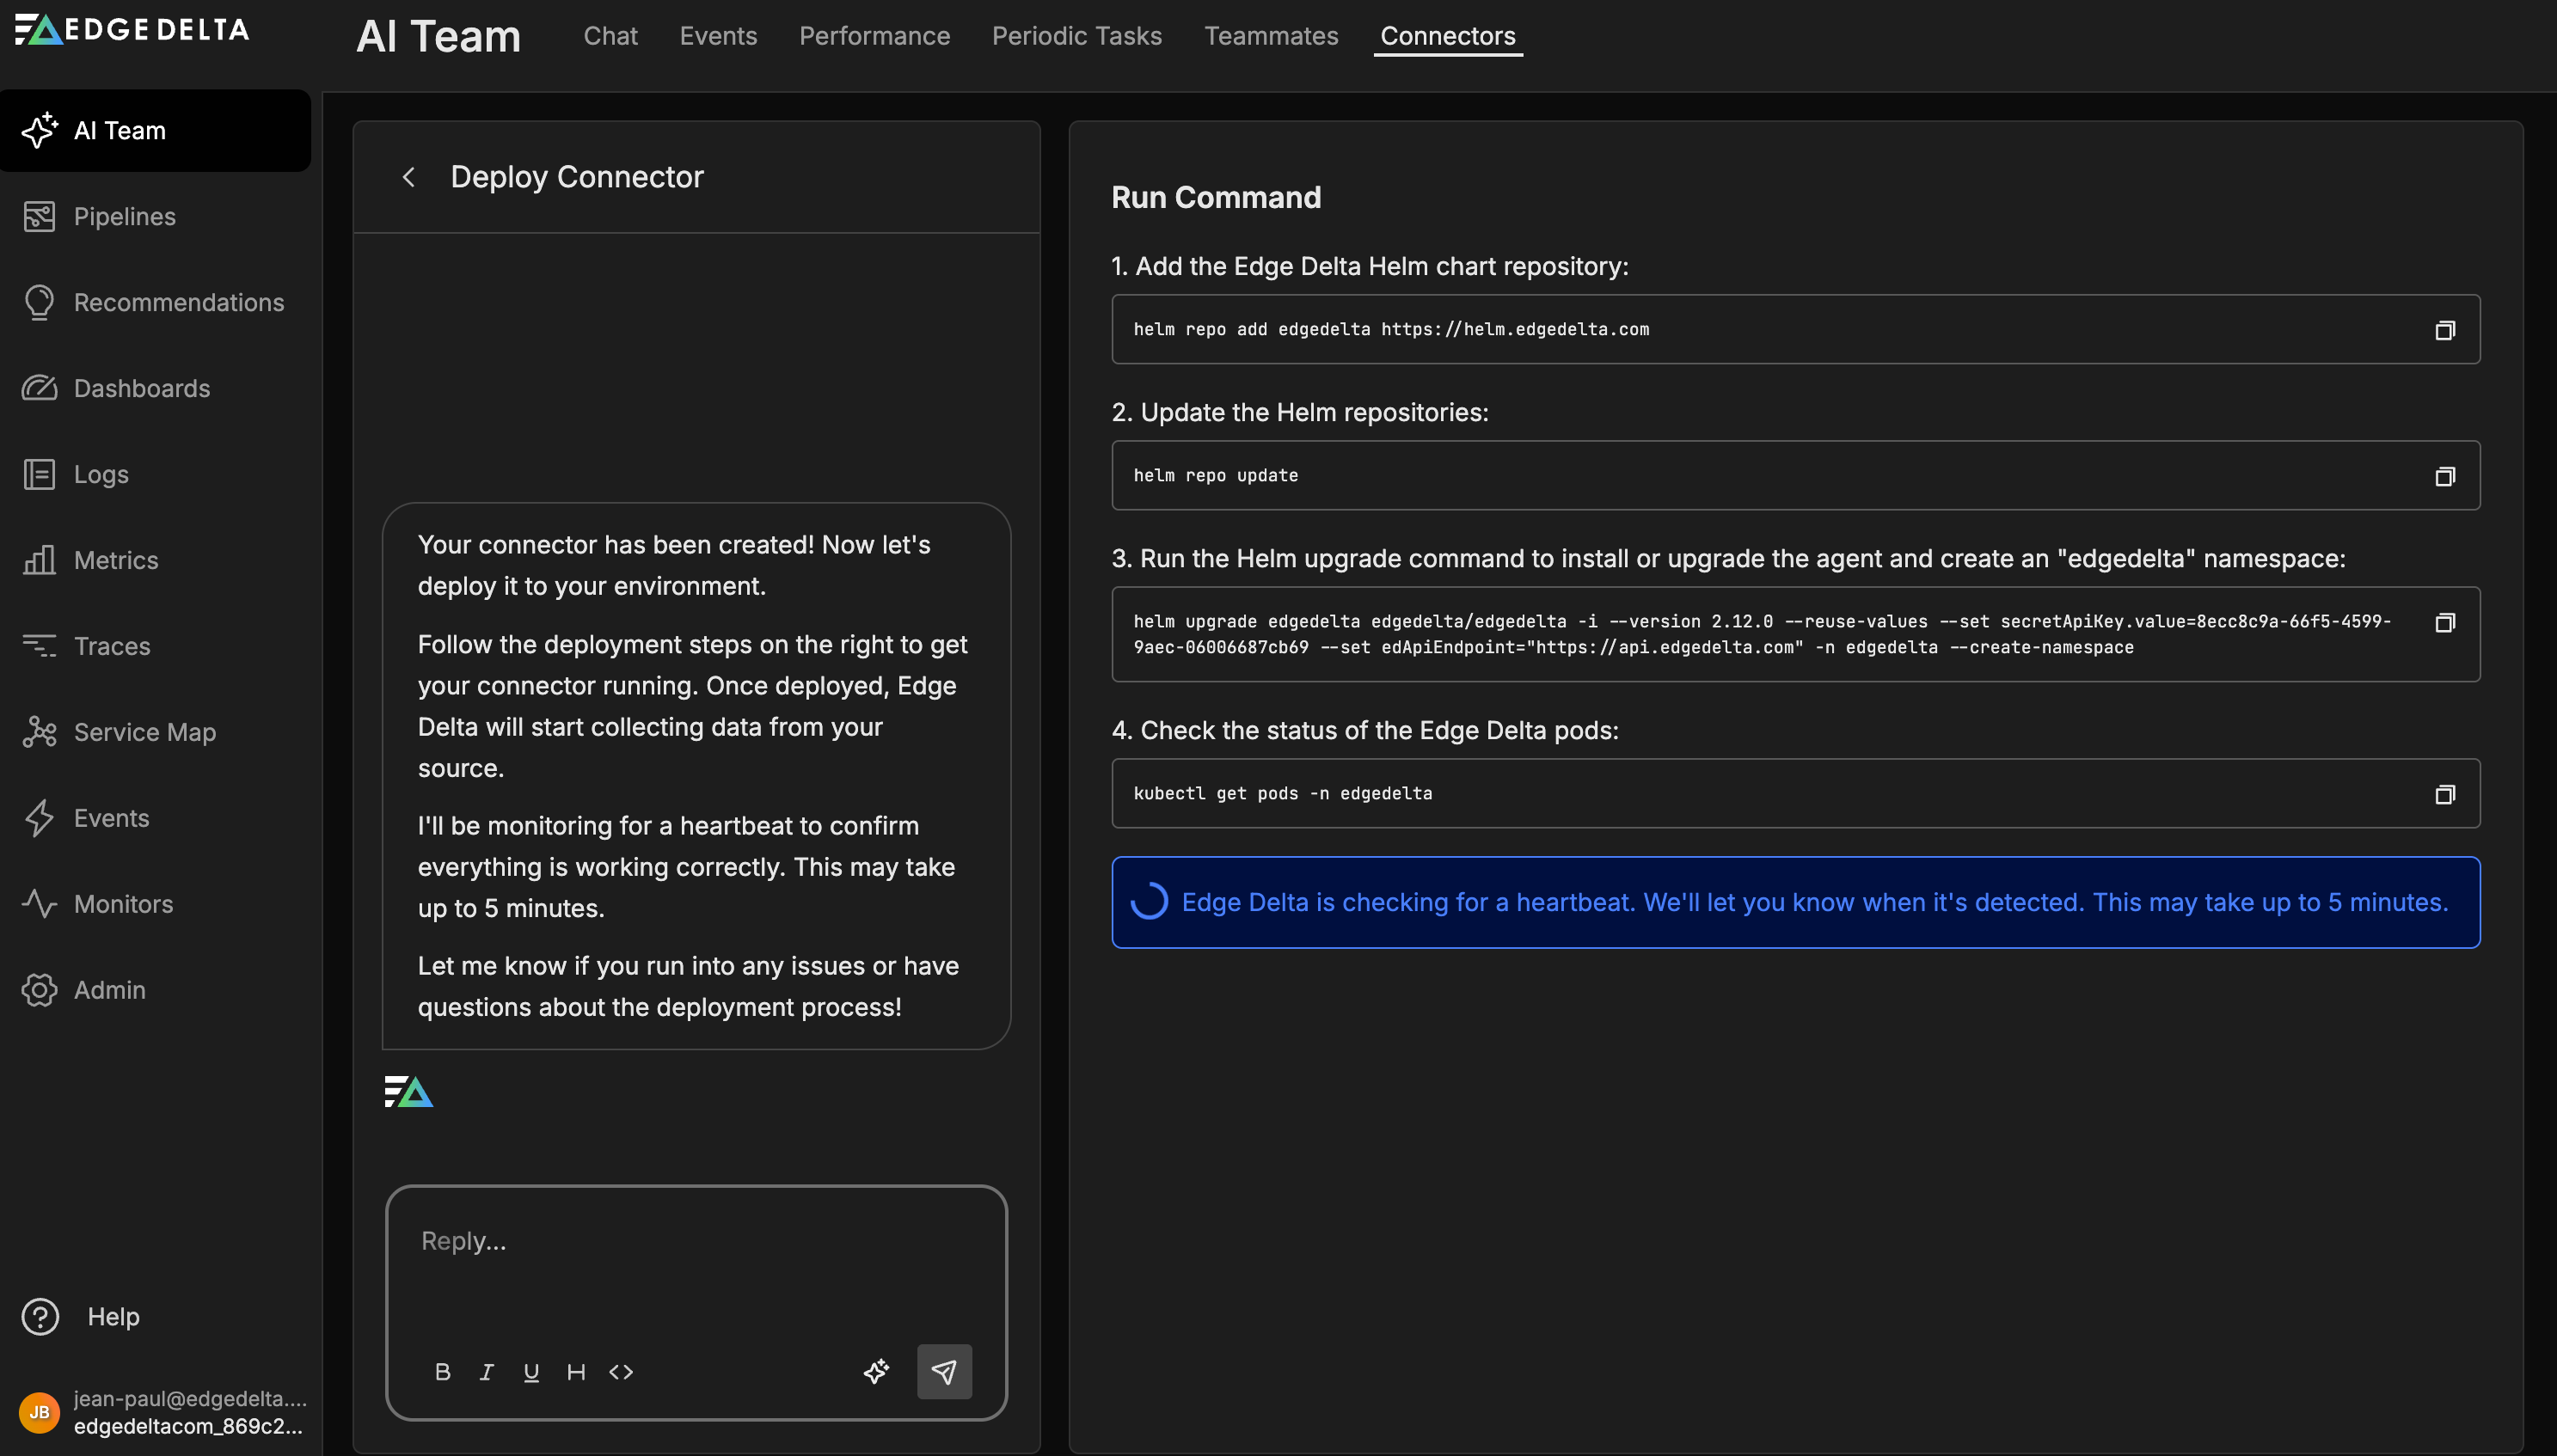
With this single connector, the SRE teammate can begin correlating logs, metrics, events, traces, and service map data to surface issues early.
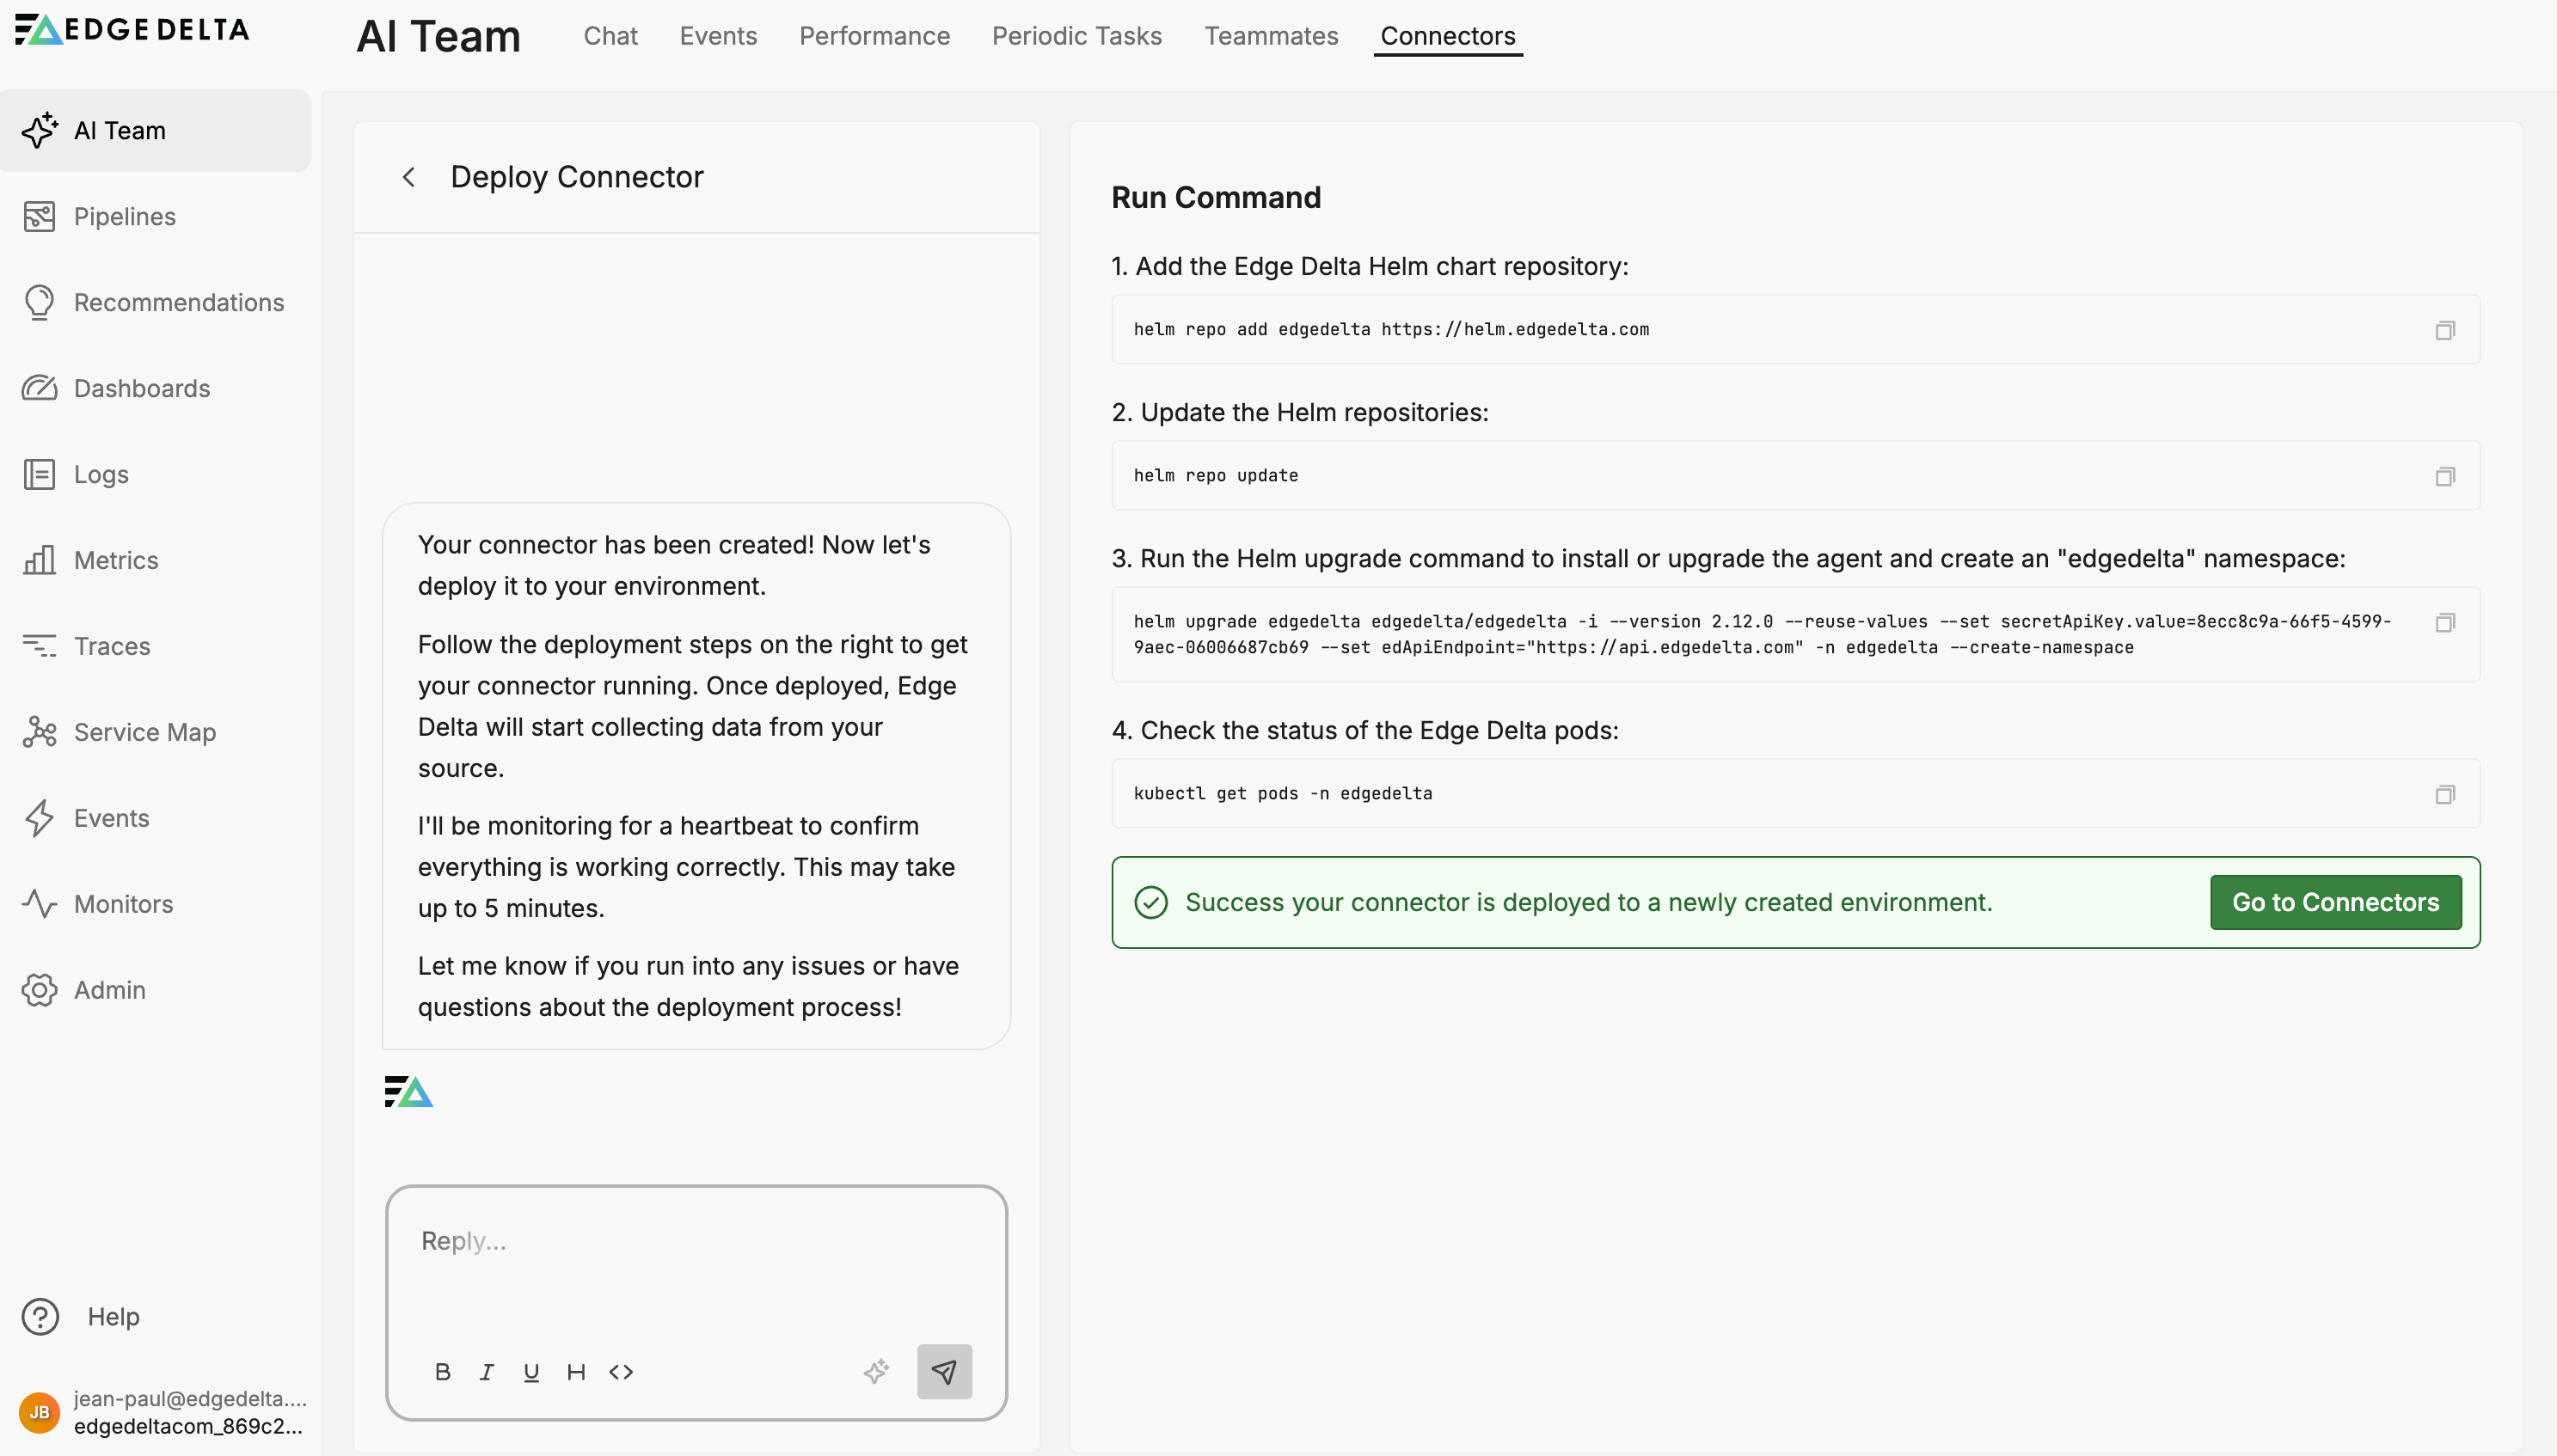
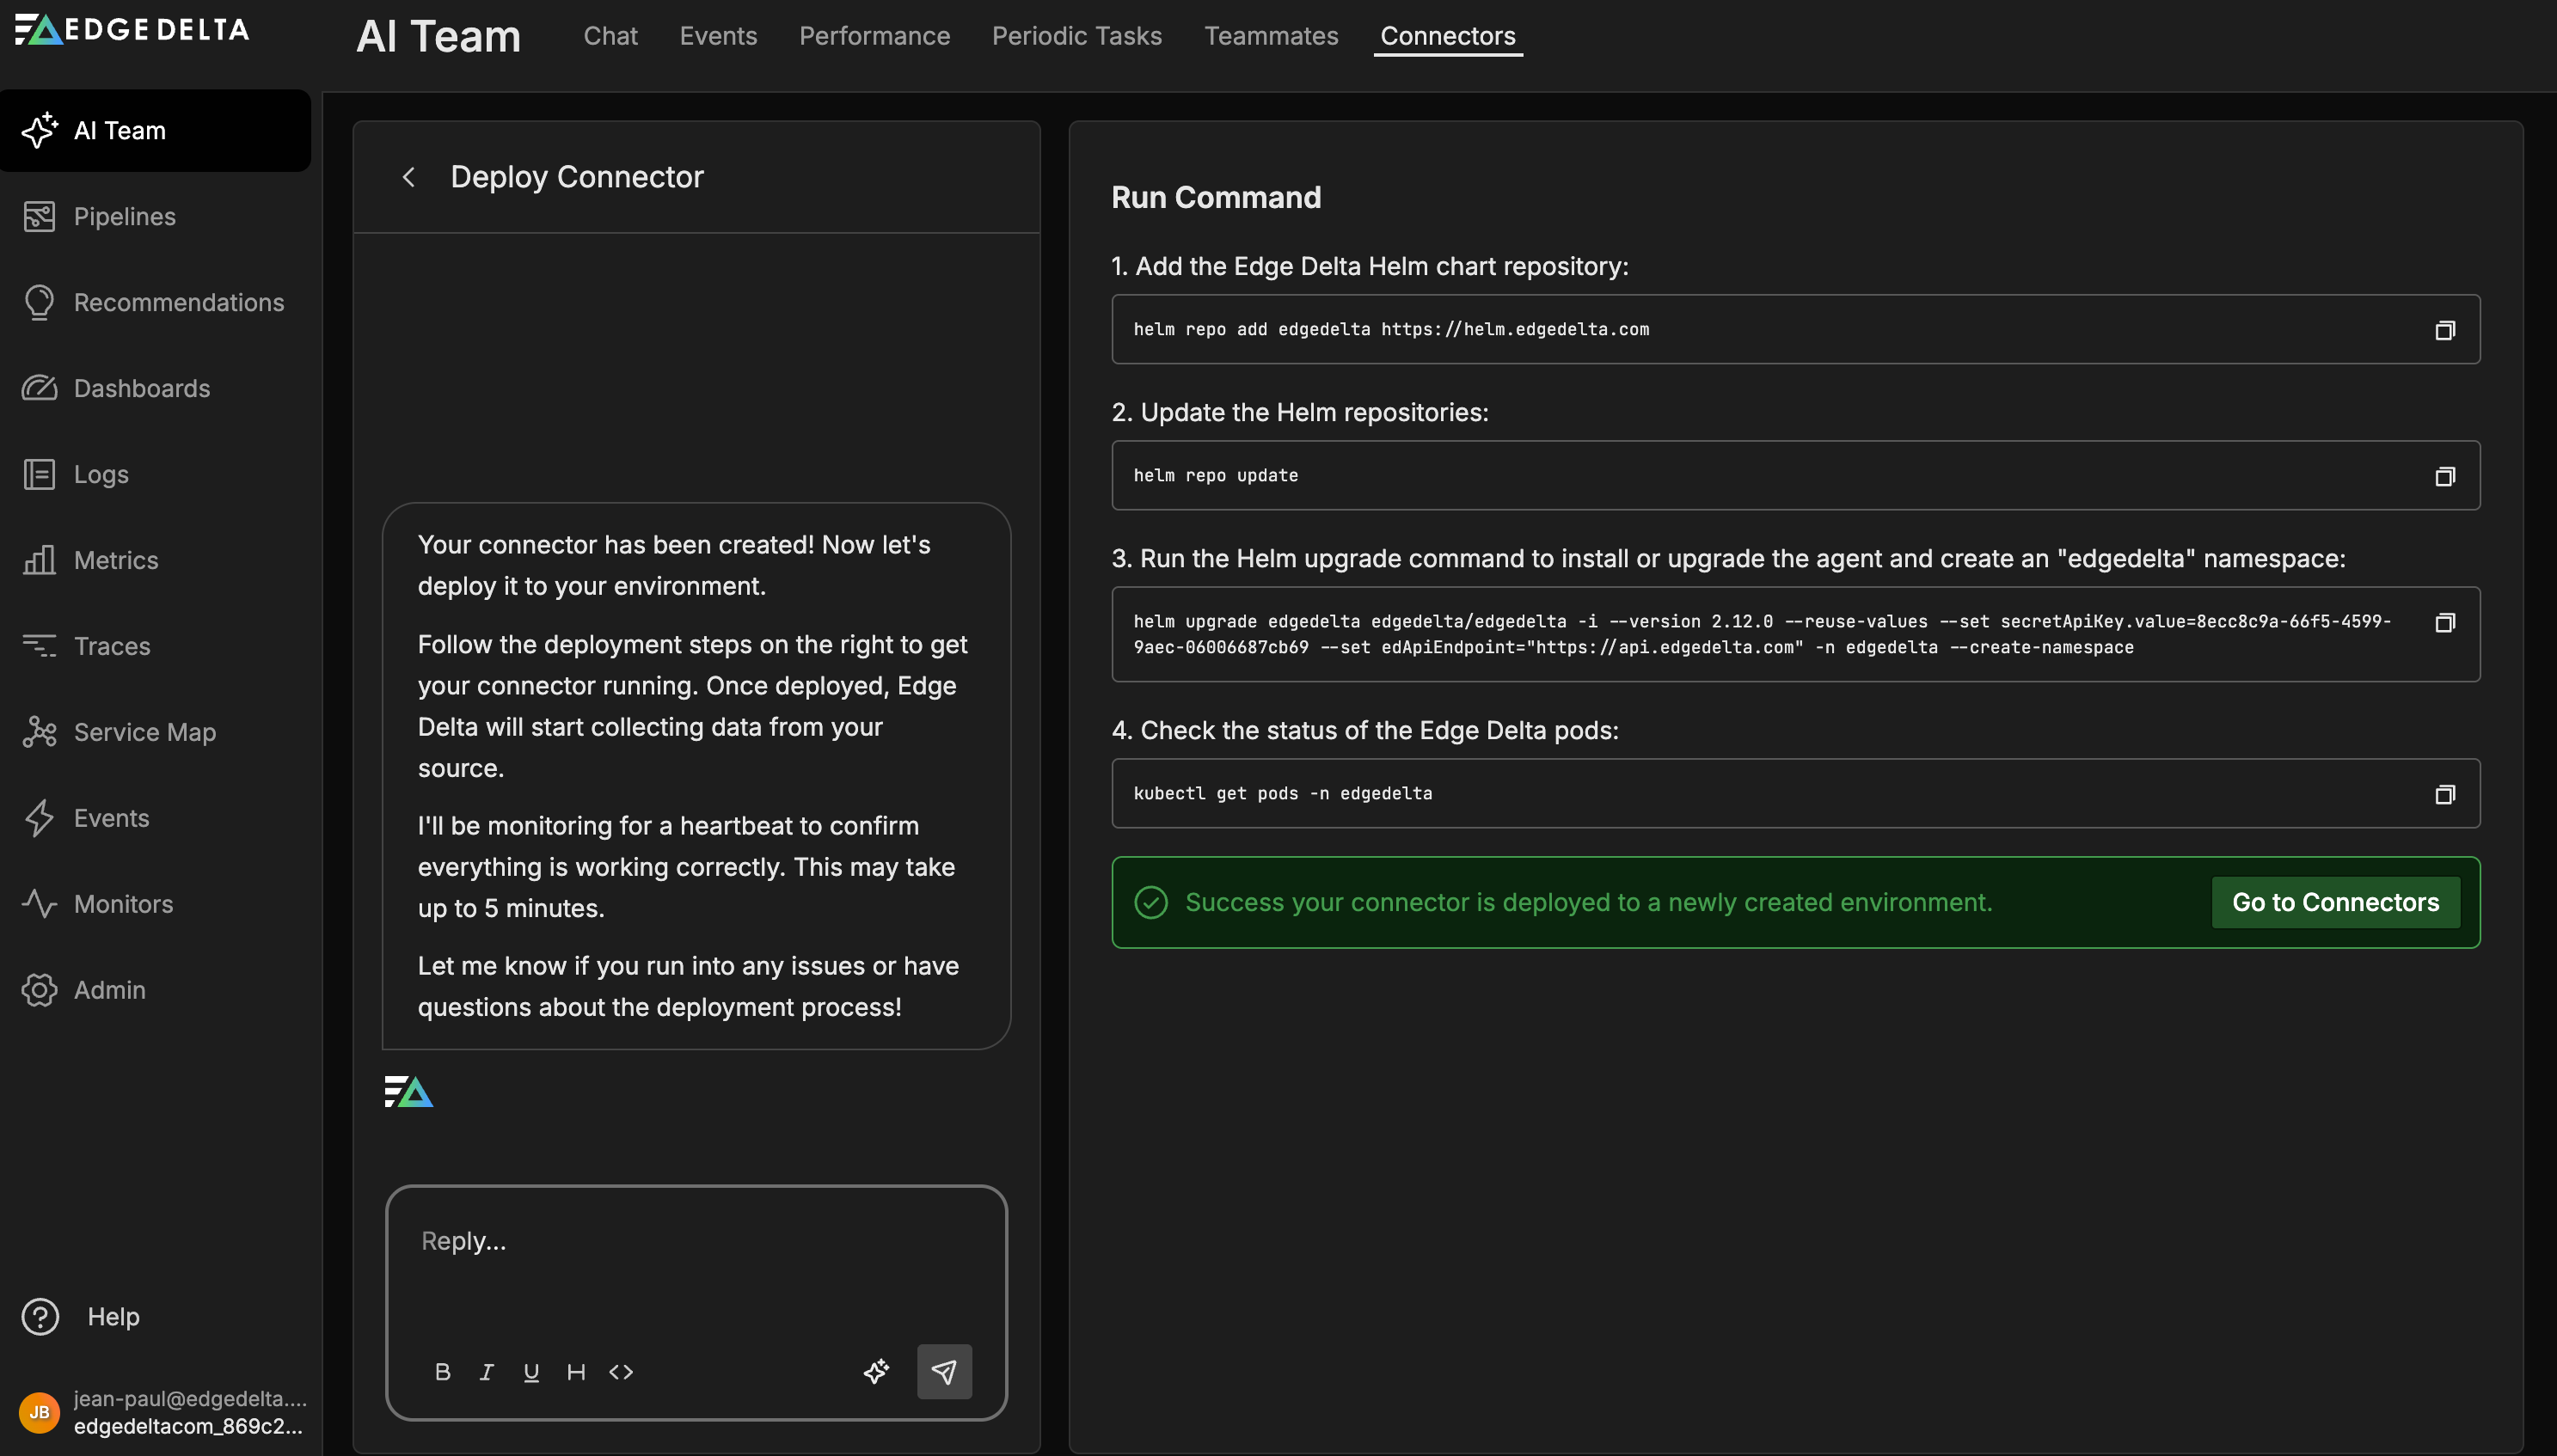
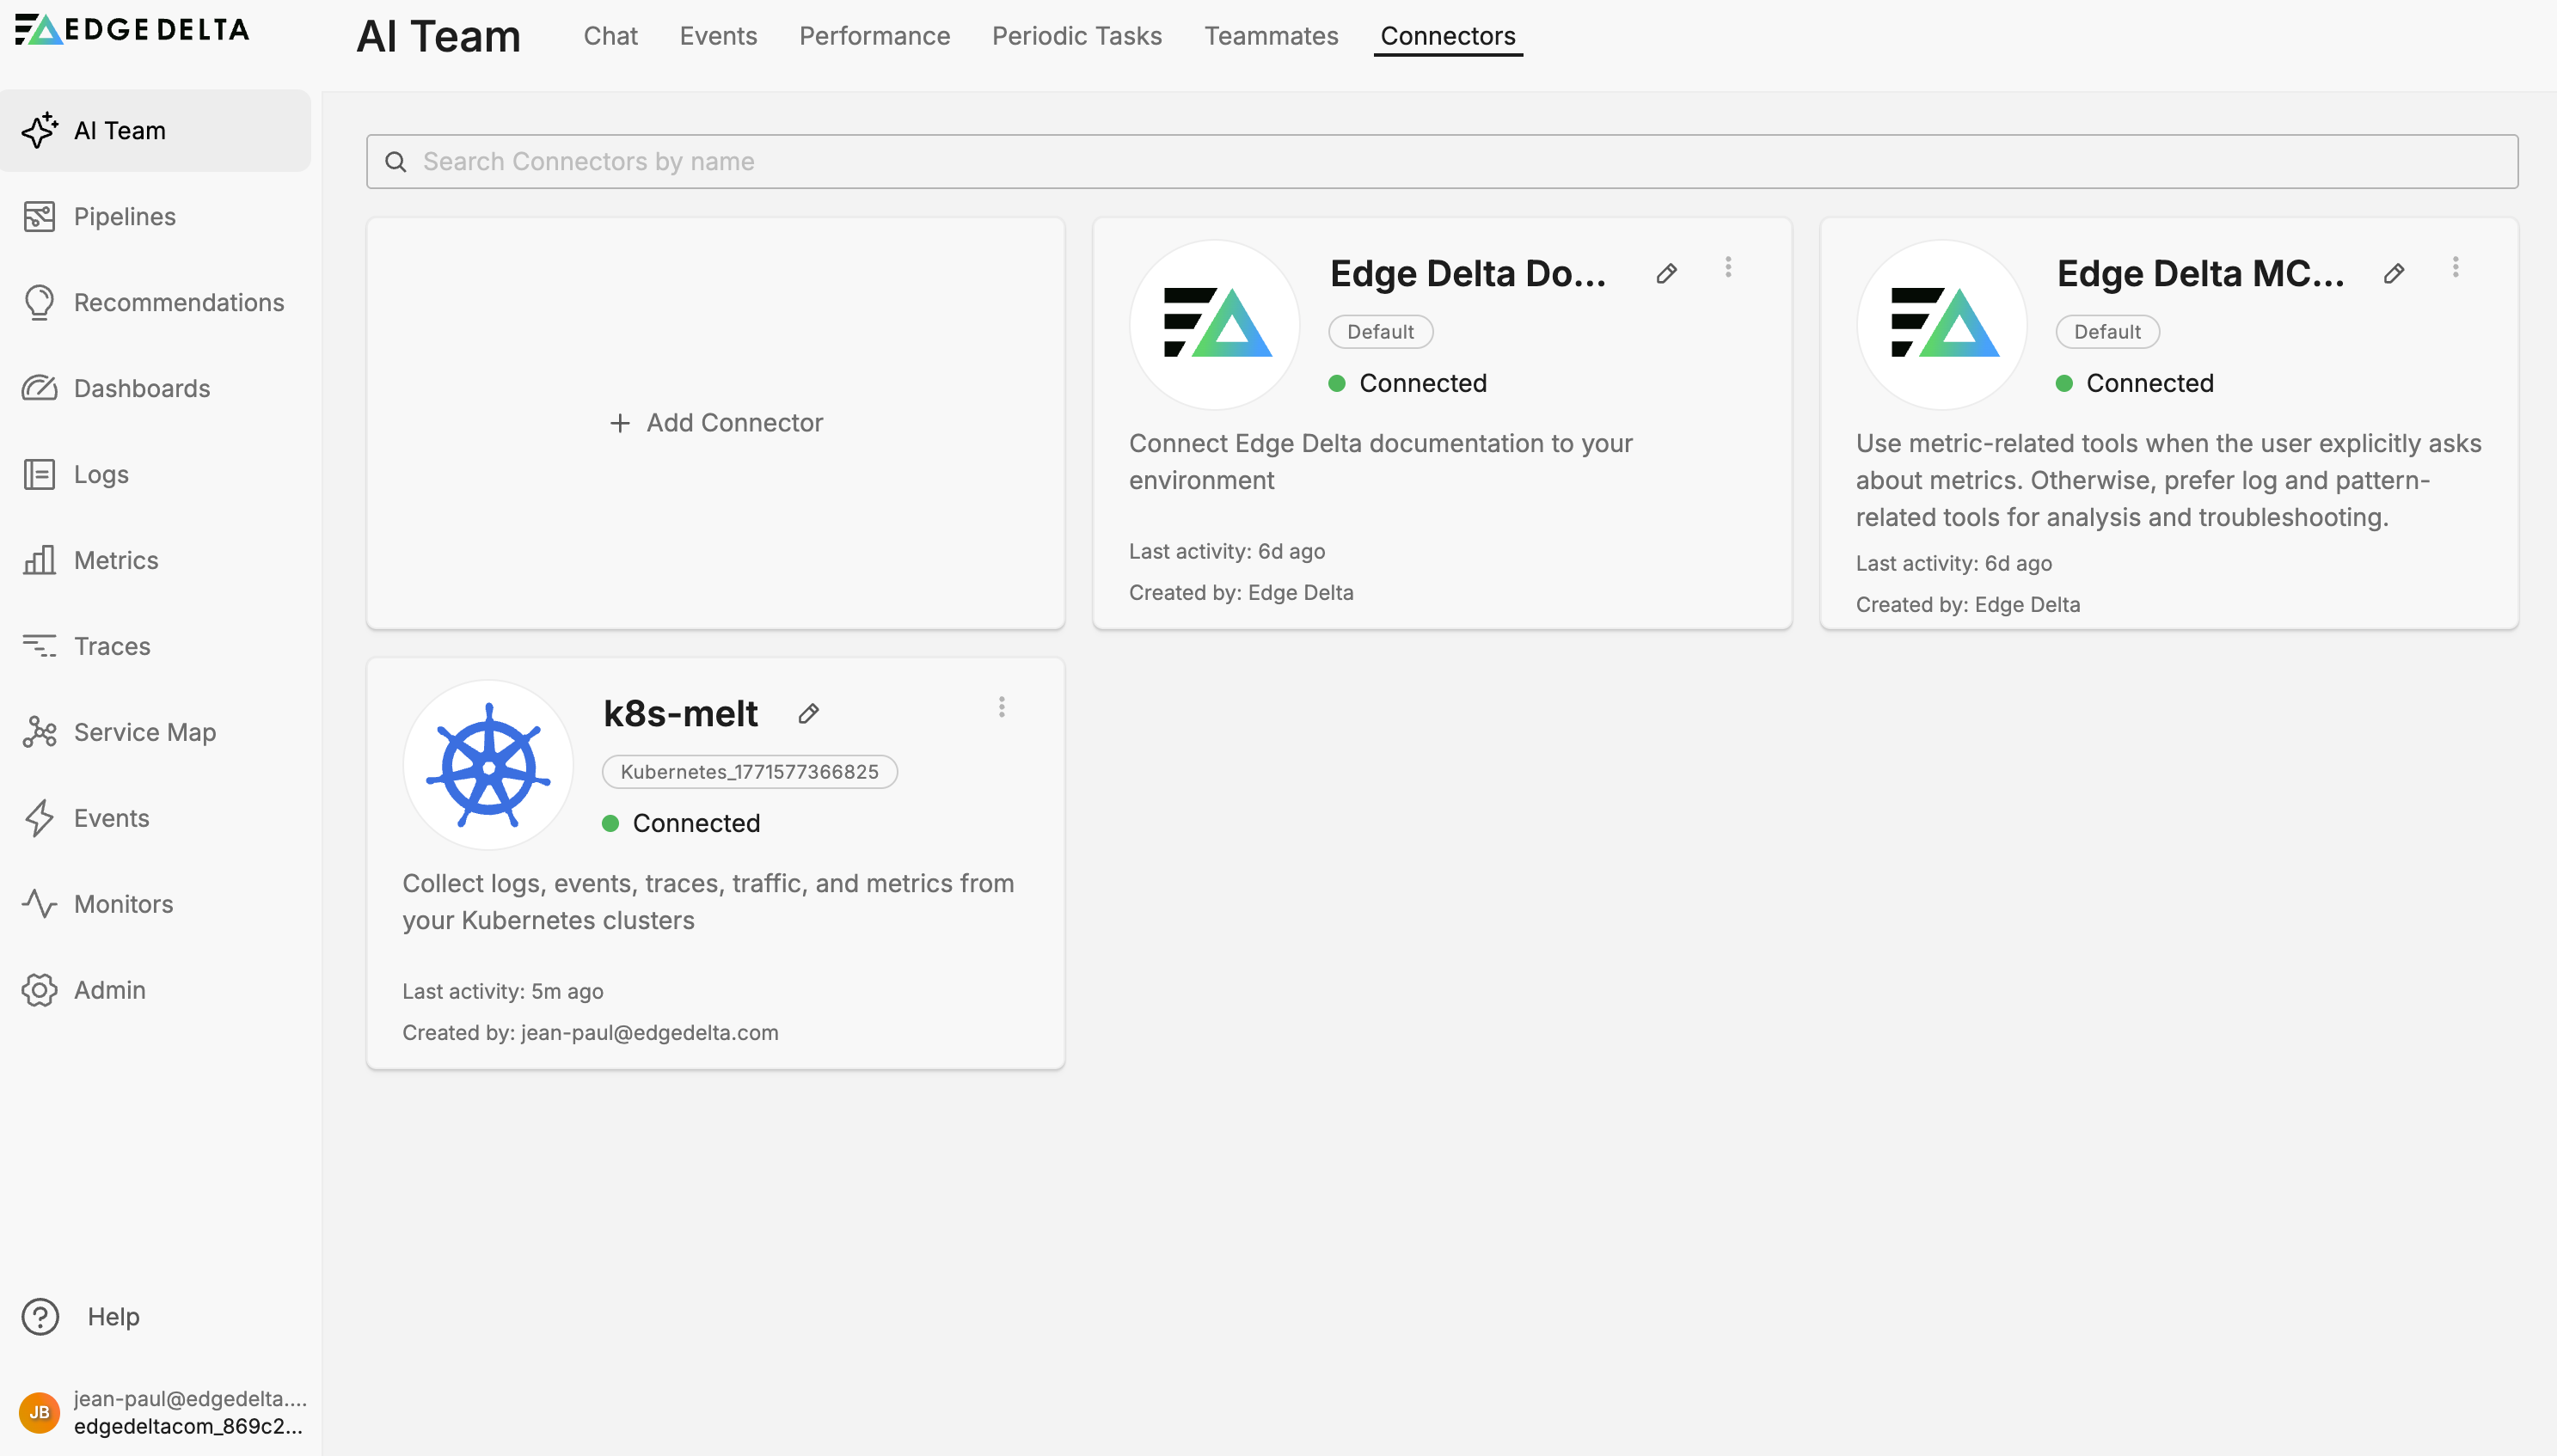
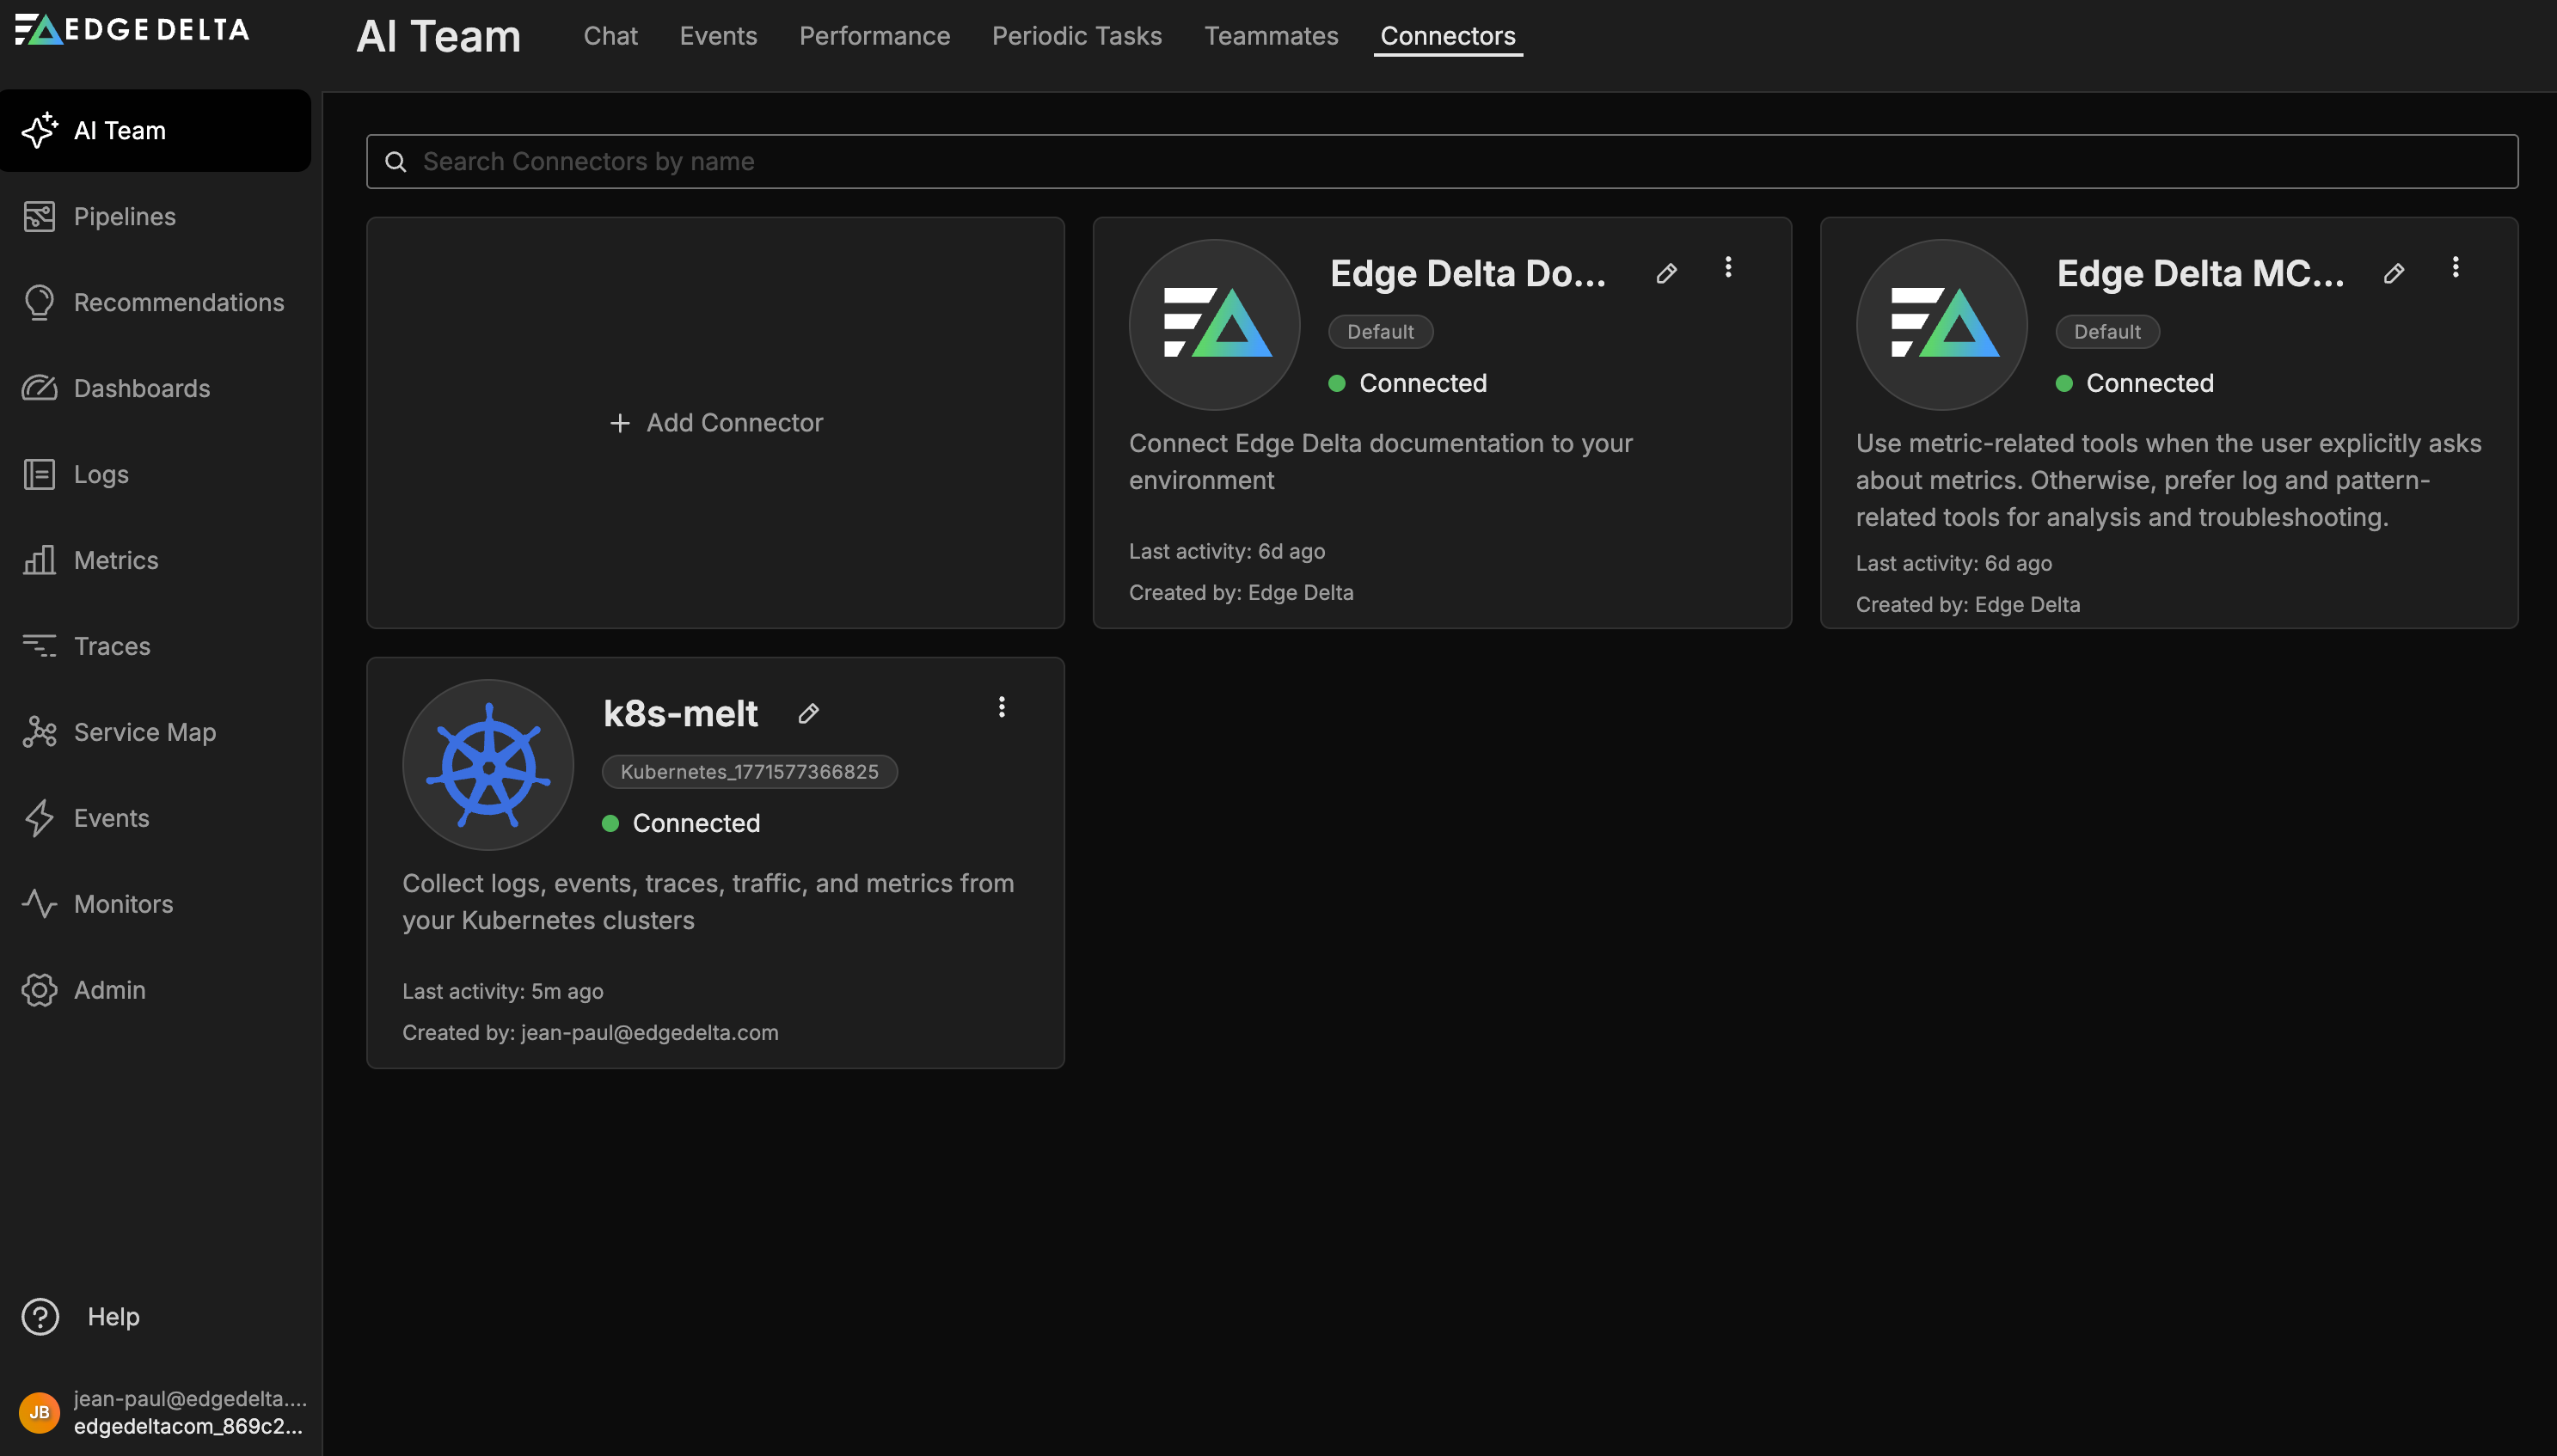
Click Go to Connectors. Your new Kubernetes connector appears alongside two default connectors that every account includes: the Edge Delta MCP Connector (lets teammates query your telemetry data) and the Edge Delta Documentation Connector (lets teammates reference Edge Delta docs during investigations).
For detailed configuration options, see Kubernetes Connector.
Non-Kubernetes alternatives
If you do not run Kubernetes, connect the telemetry source that matches your environment. Common options include File for local log files, OTLP for OpenTelemetry data, HTTP Pull for REST APIs, and Docker Logs for containerized workloads. See Connectors Overview for the full list.
The key principle: AI teammates need data flowing into Edge Delta before they can analyze anything.
Step 2: Review out-of-the-box monitors
Once telemetry is flowing, Edge Delta automatically provisions two default monitors for every new organization. These monitors detect issues and route alerts to AI teammates or your preferred notification channels without additional configuration.
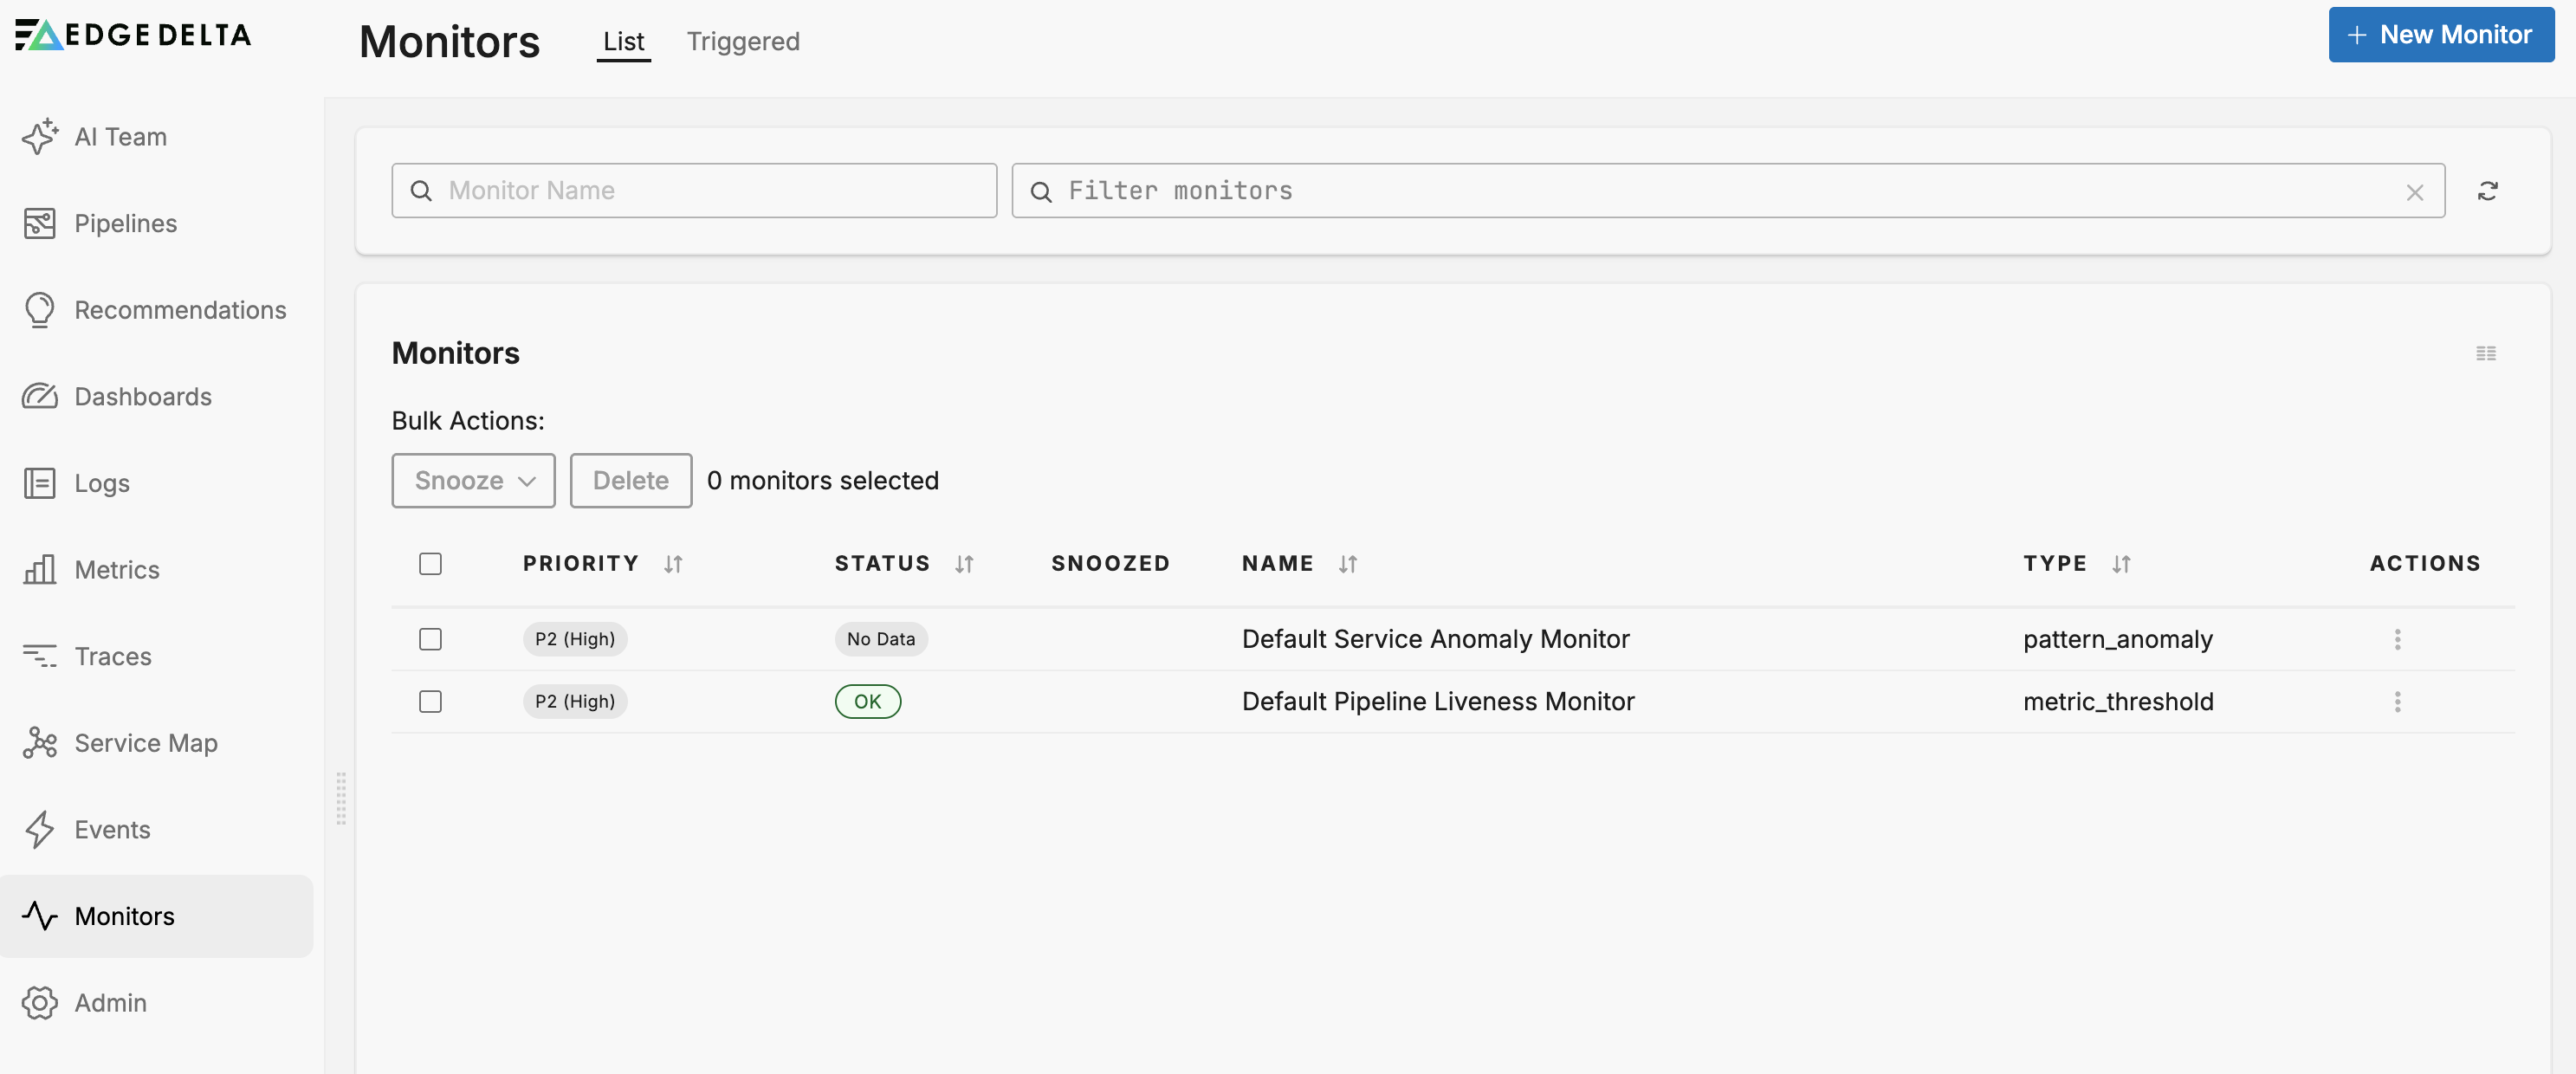
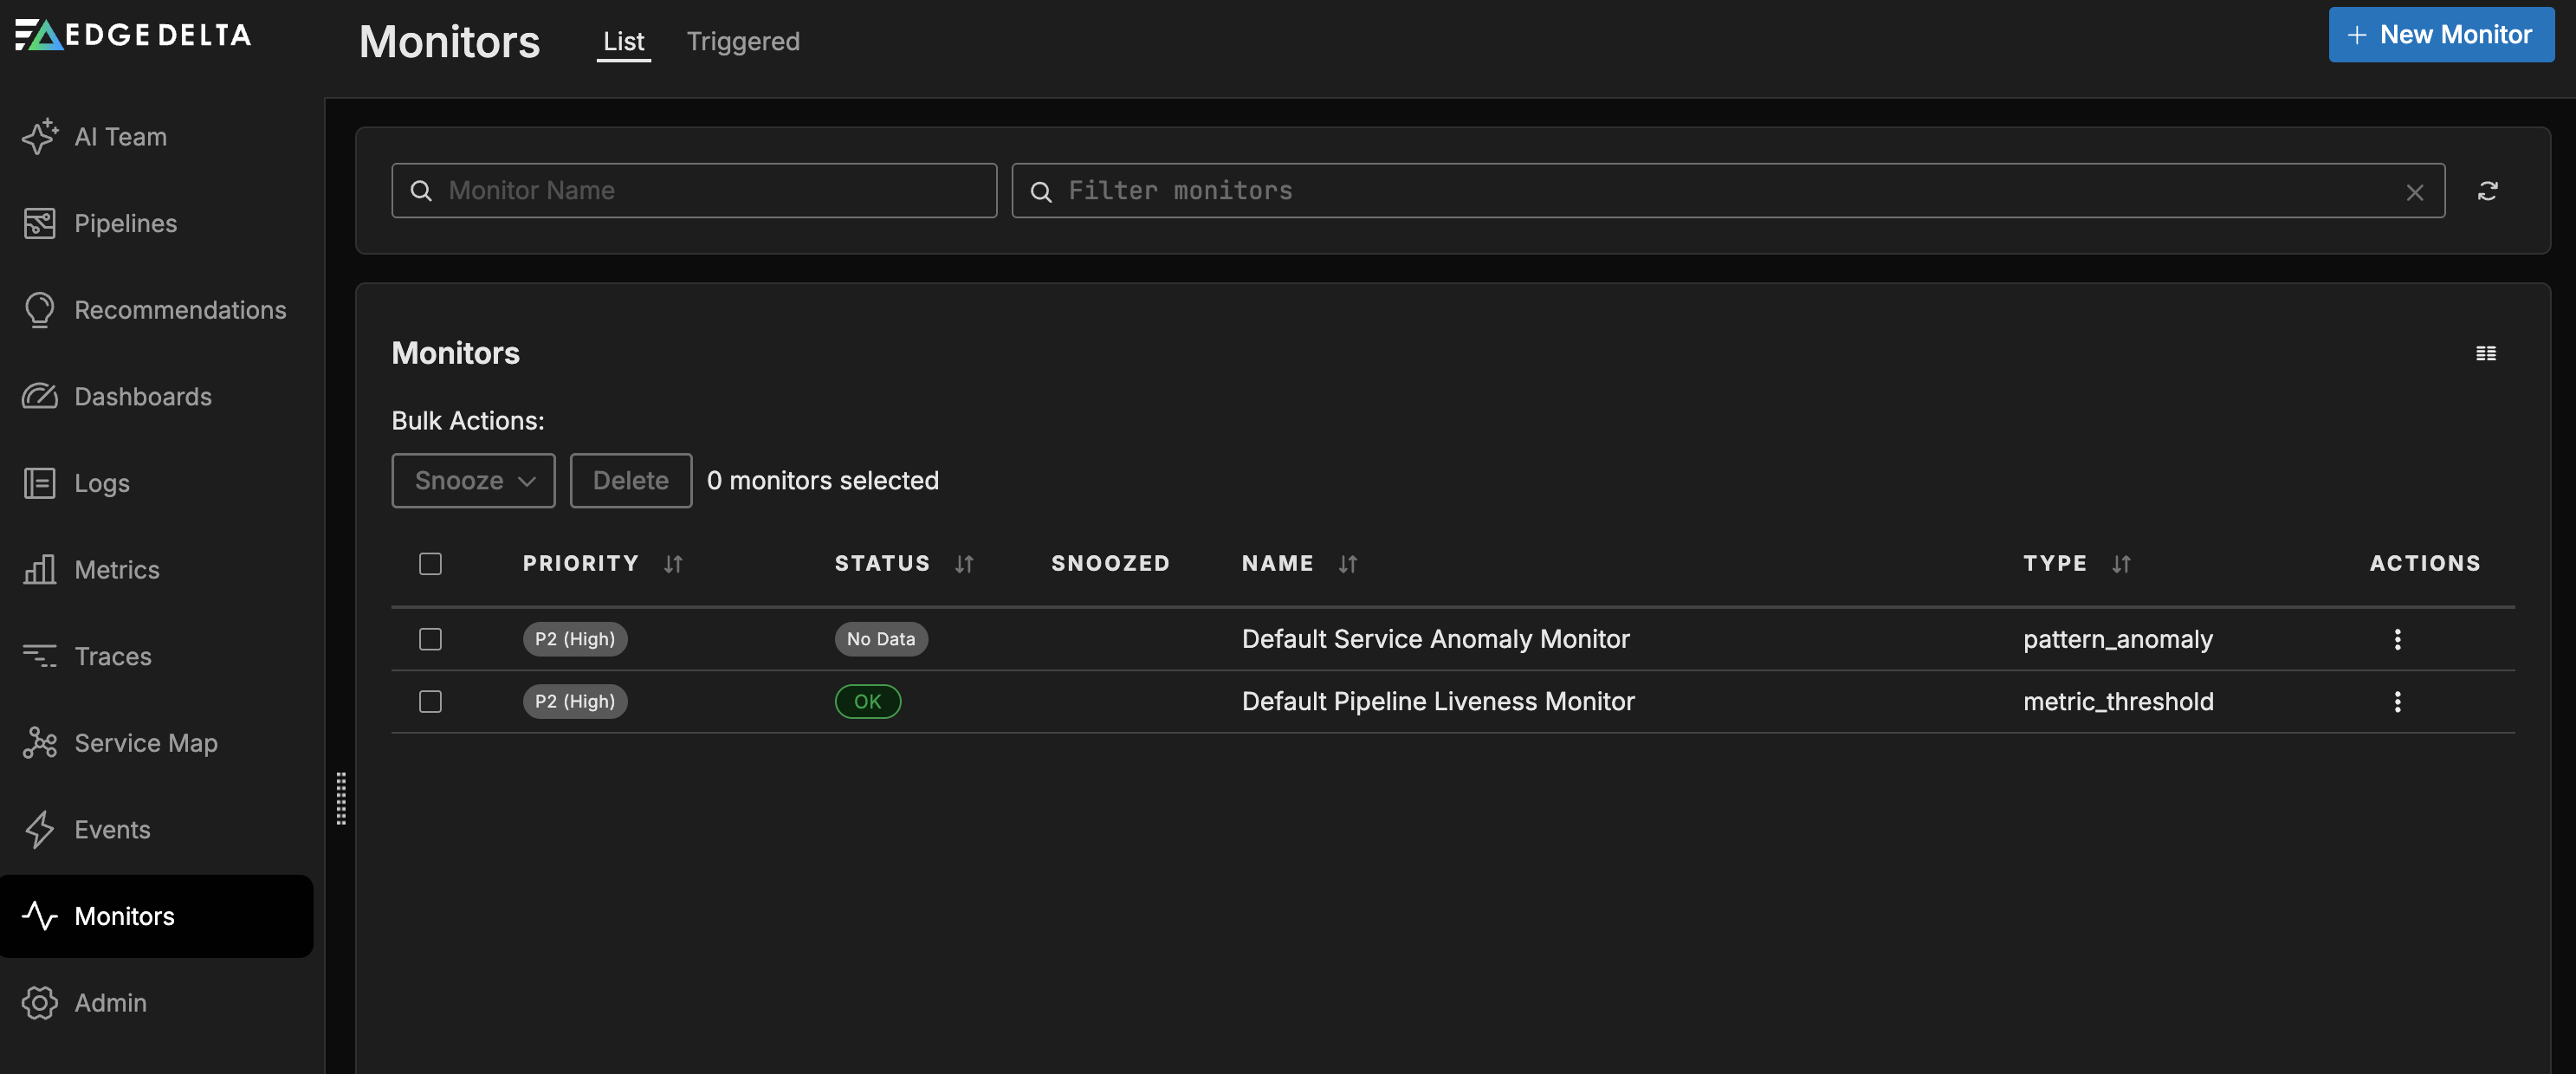
| Monitor | Type | What it detects |
|---|---|---|
| Default Service Anomaly Monitor | Pattern Anomaly | Anomalous log pattern spikes grouped by service, using a baseline comparison |
| Default Pipeline Liveness Monitor | Metric Threshold | Pipeline agents that stop reporting heartbeat metrics |
You can view these monitors on the Monitors > List tab.
To customize thresholds, sensitivity, or notification destinations, click the Actions kebab menu for the monitor and select Edit. See Monitors for details.
The Default Service Anomaly Monitor uses a 15-minute spike window with a warning threshold of 5 and an alert threshold of 10. When the alert fires, it automatically notifies the @ai-channel-alerts channel, prompting AI teammates to assess severity, identify which specialists should investigate, and determine whether the issue requires immediate attention.
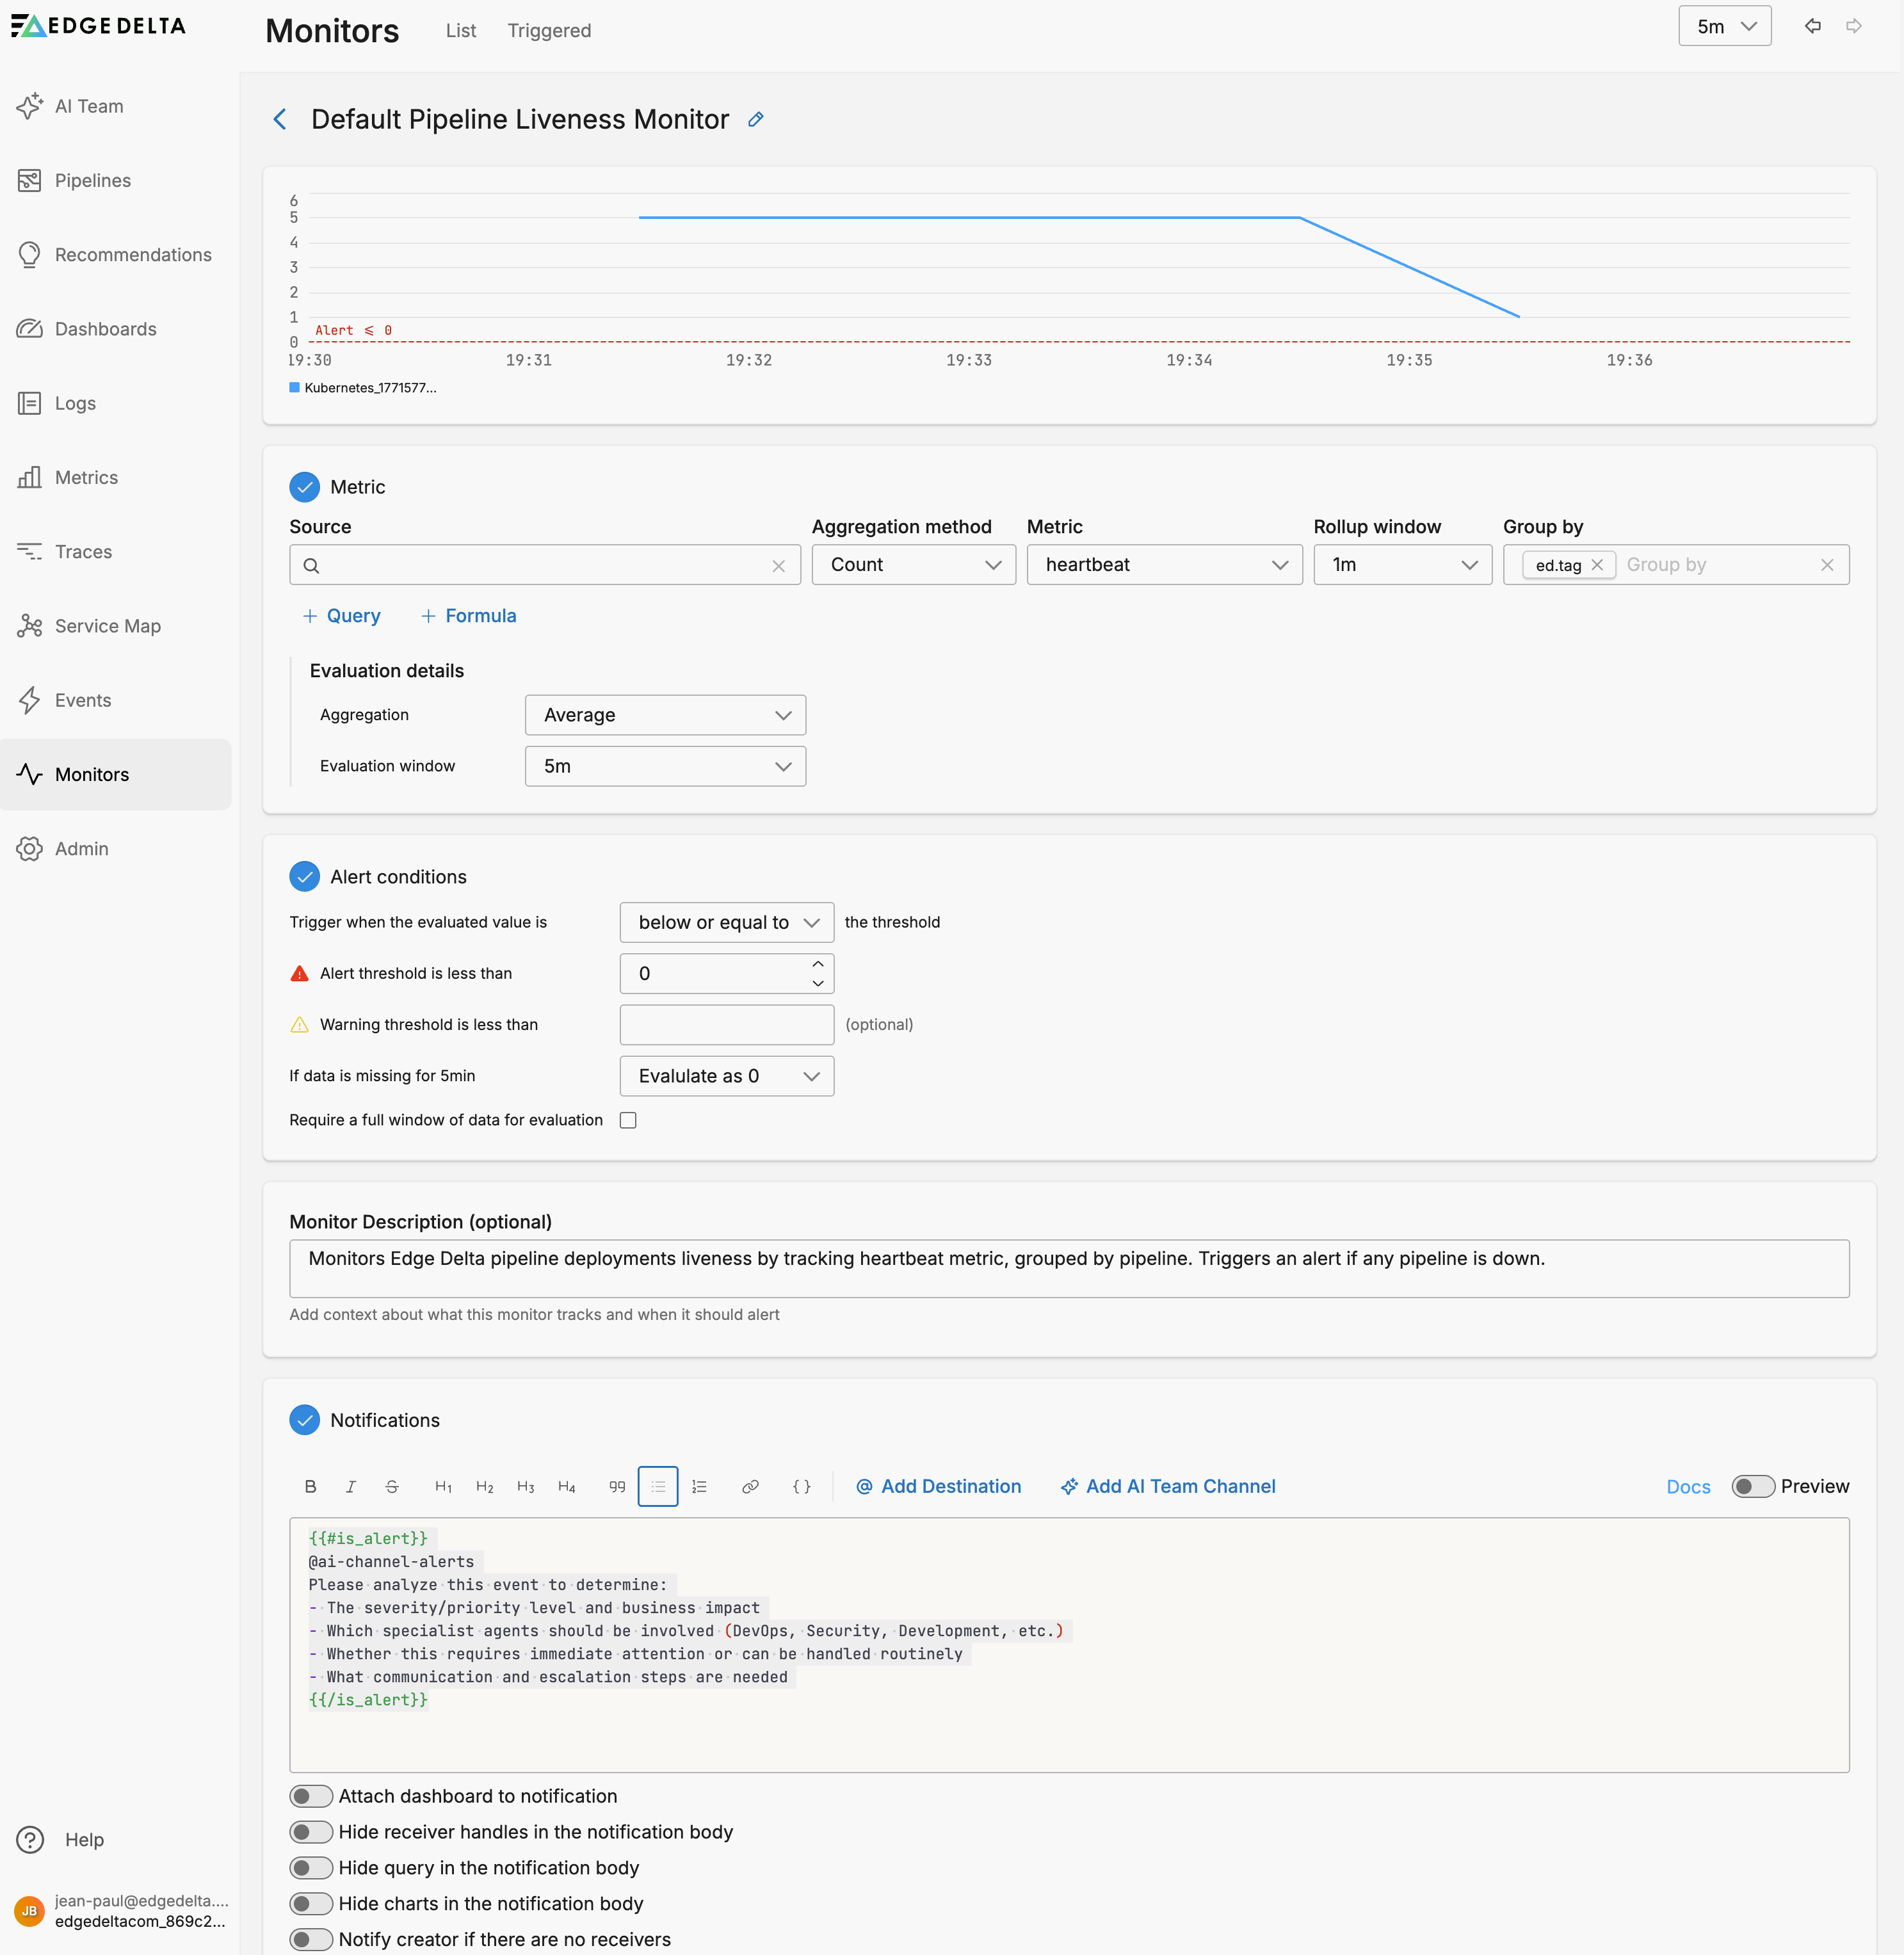
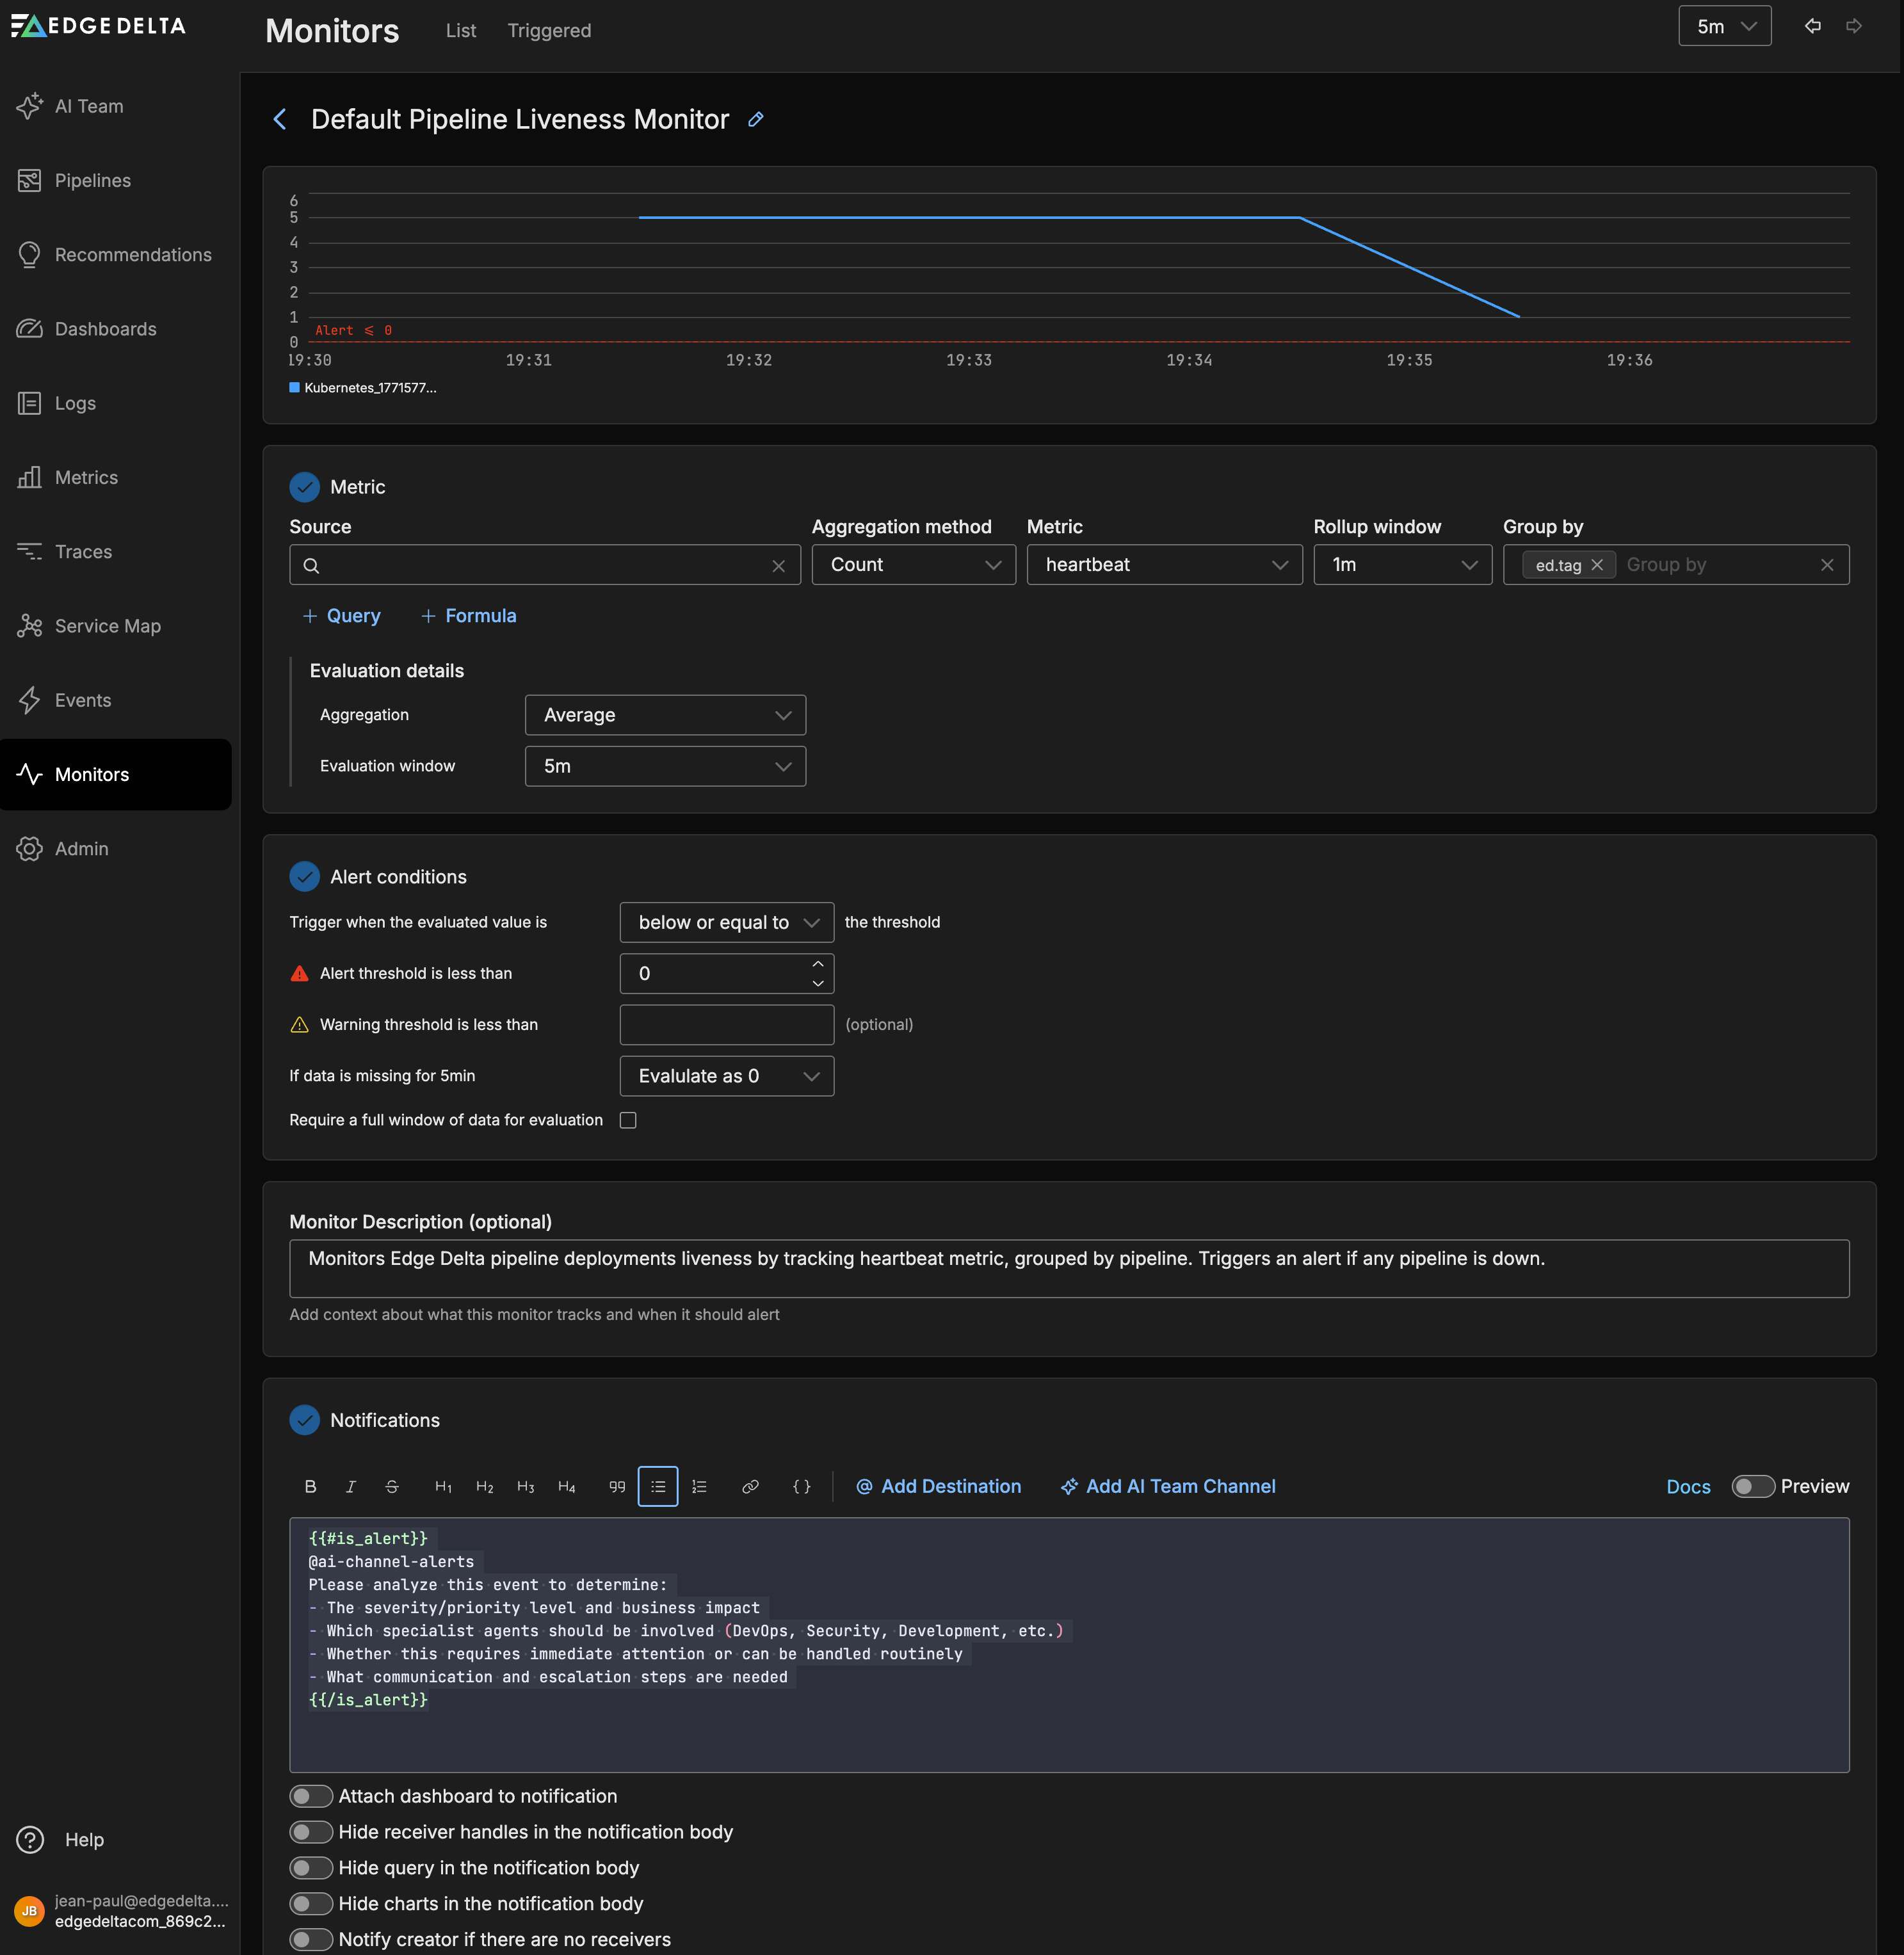
The Default Pipeline Liveness Monitor evaluates agent heartbeat metrics over a 5-minute window and alerts when the value drops below 0. If data is missing for 5 minutes, the monitor evaluates the value as 0, which triggers the alert. This means the monitor fires when a pipeline stops reporting entirely, indicating a potential deployment failure or connectivity issue. Like the Service Anomaly Monitor, it notifies @ai-channel-alerts so AI teammates can assess the impact and recommend next steps.
Both monitors route alerts to the AI Team alerts channel by default, so AI teammates begin investigating automatically without any additional configuration.
Beyond these defaults, you can create monitors of seven types: Metric Threshold, Metric Change, Log Threshold, Pattern Anomaly, Composite, Synthetic, and Event.
Route monitors to AI Team
Beyond the default monitors, you can configure any monitor to send notifications directly to AI Team channels. When a monitor fires an alert to an AI Team channel, teammates assigned to that channel begin autonomous investigation.
To connect a monitor to AI Team:
- Create or edit a monitor in Monitors > Manage
- In the Notifications section, type
@to open the autocomplete menu - Select an AI Team channel from the list (channels appear with the prefix
ai-channel-) - Use conditional formatting to control when AI Team receives the notification
The following example routes alert-level notifications to an AI Team channel:
{{#is_alert}}
  **Alert**: {{monitor.name}} triggered
  - Value: {{value}}
  - Threshold: {{alert_threshold}}

  @ai-channel-security-issues
{{/is_alert}}
When the monitor enters the alert state, the security-issues channel receives the notification and assigned teammates begin correlating logs, checking for similar patterns, and assembling an investigation summary.
For detailed configuration options and more examples, see Monitor Notifications.
Step 3: Connect PagerDuty
If your team uses PagerDuty for incident management, connecting it enables AI teammates to receive real-time incident notifications and respond autonomously. There are two parts to set up.
Add the PagerDuty connector
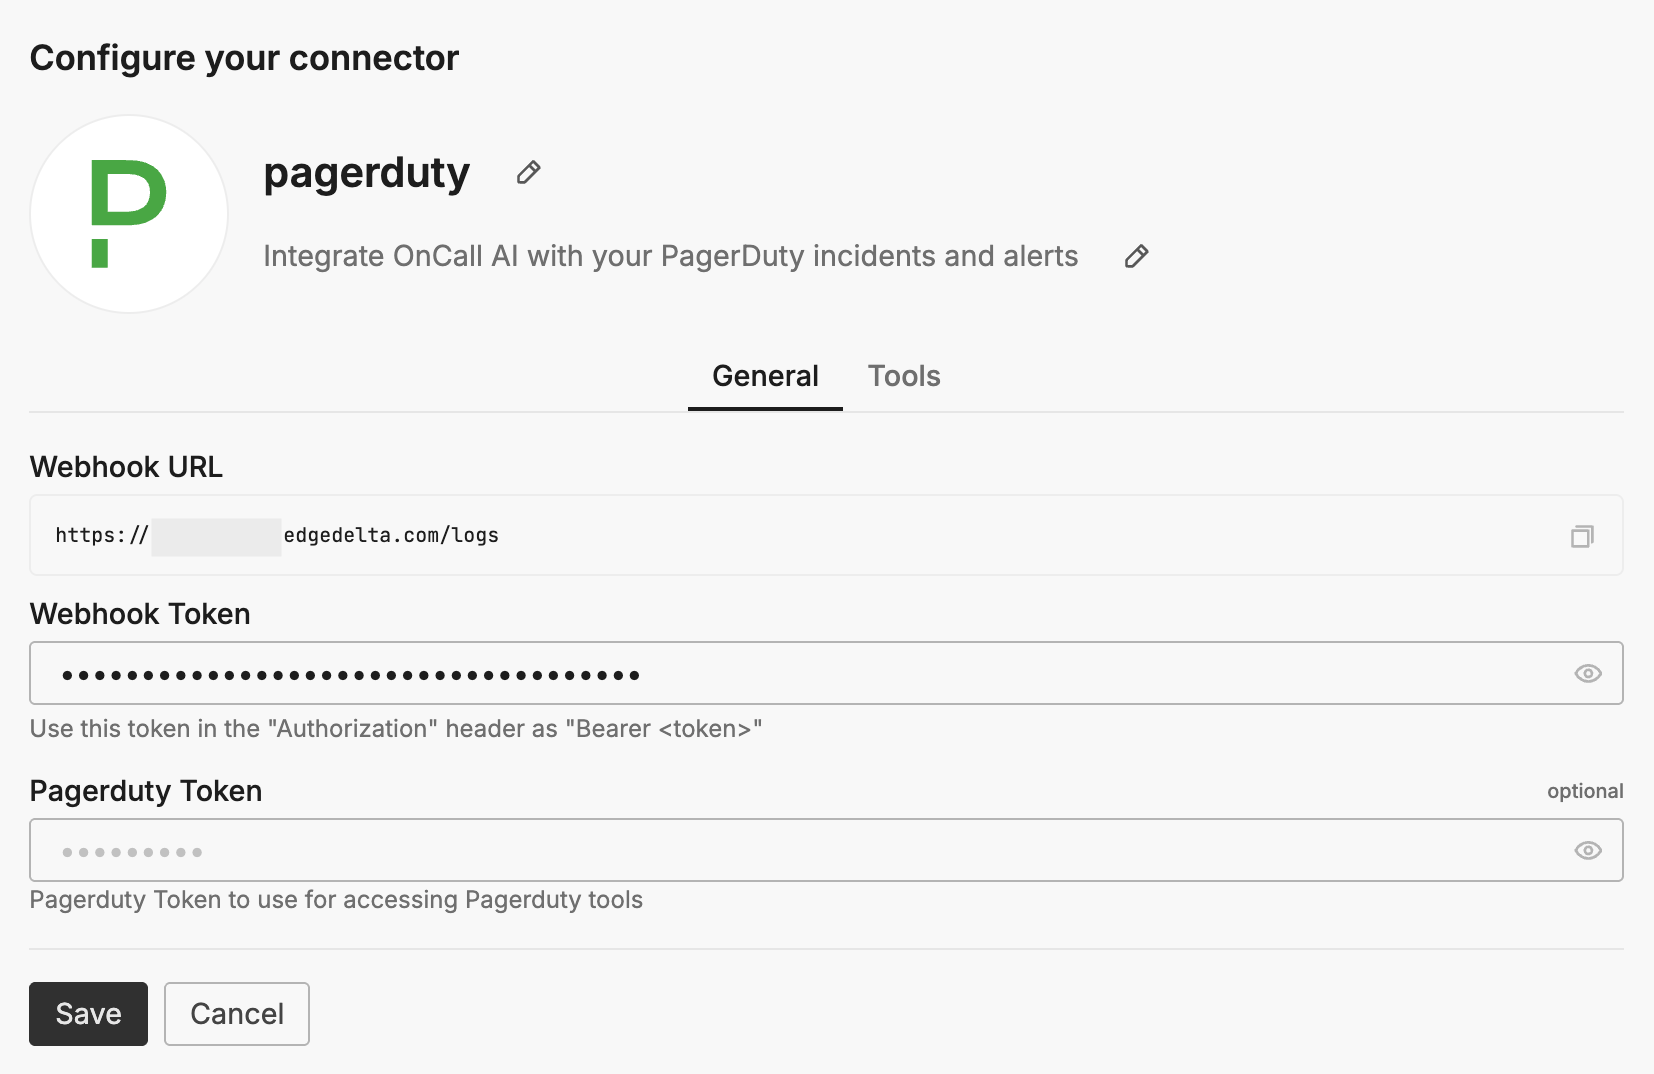
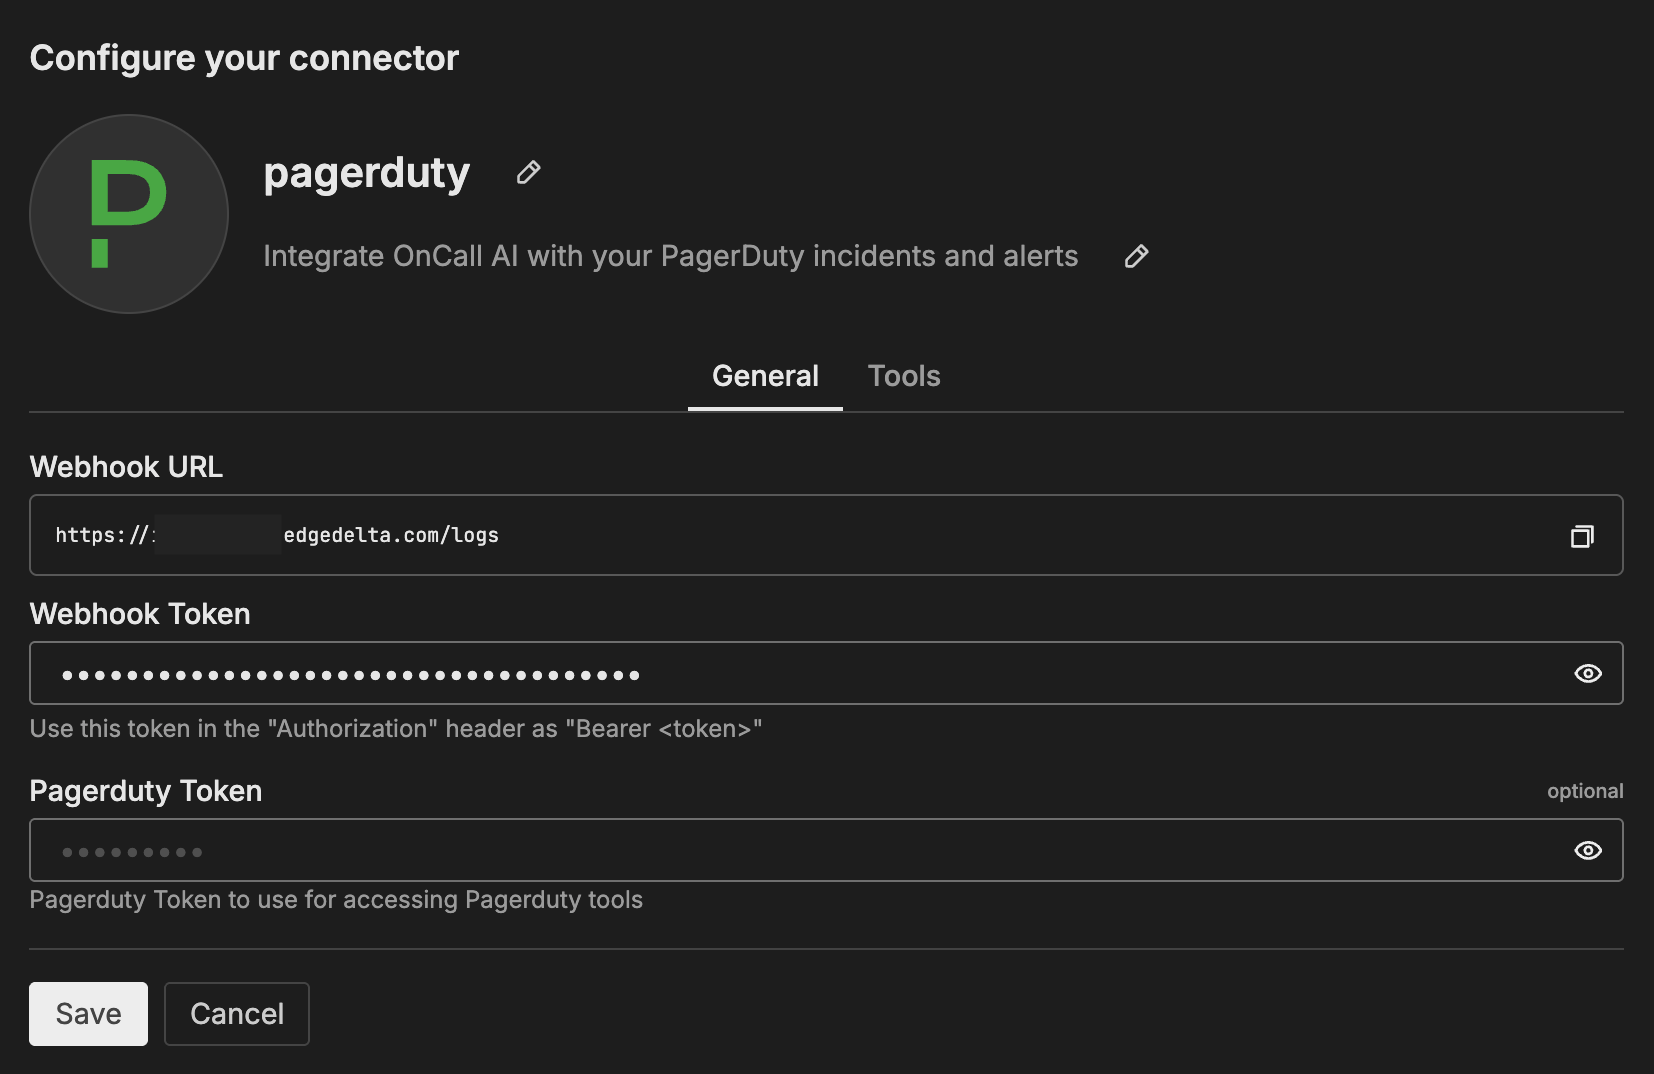
- Navigate to AI Team > Connectors > PagerDuty
- Complete OAuth authorization (recommended) or configure an API token
- Copy the Webhook URL and Webhook Token displayed in the connector configuration
- Review the Tools tab to confirm permissions (read-only operations are allowed by default, write operations require your approval)
- Click Save
The PagerDuty connector is automatically assigned to the SRE teammate.
Configure the PagerDuty webhook
The webhook is what closes the loop. PagerDuty fires an alert, and AI teammates receive it and begin triage automatically.
- In PagerDuty, navigate to Integrations > Generic Webhooks (v3)
- Click New Webhook
- Paste the Edge Delta Webhook URL from the connector configuration
- Add a custom header: set Name to
Authorizationand Value toBearer <webhook_token>using the token from Edge Delta - Select the event types to send (incident triggered, acknowledged, resolved, and others as needed)
- Click Add Webhook
For the complete walkthrough with screenshots of the PagerDuty webhook configuration, see PagerDuty Integration Guide.
Without the webhook, teammates can only use PagerDuty tools reactively when you ask. With the webhook, triage starts the moment an alert fires.
What happens when an alert fires
When an incident triggers in PagerDuty (for example, a CPU utilization spike on a production service), PagerDuty sends the alert payload to Edge Delta through the webhook. The event arrives in the alerts channel, where OnCall AI creates an investigation thread and routes it to the SRE teammate. SRE queries Edge Delta telemetry for correlated logs, metrics, and anomalies during the incident window. It checks PagerDuty for on-call information and related incidents. Within minutes, the thread contains a triage summary with symptoms, impact assessment, root cause hypotheses, and proposed next steps. The entire investigation and its findings are visible to your team, and a summary can be posted back to PagerDuty for the audit trail.
Step 4: Connect a Git repository
Connecting a Git repository enables AI teammates to correlate production issues with recent code changes. This is essential for root cause analysis: when the SRE teammate detects an anomaly, it can check what was recently deployed.
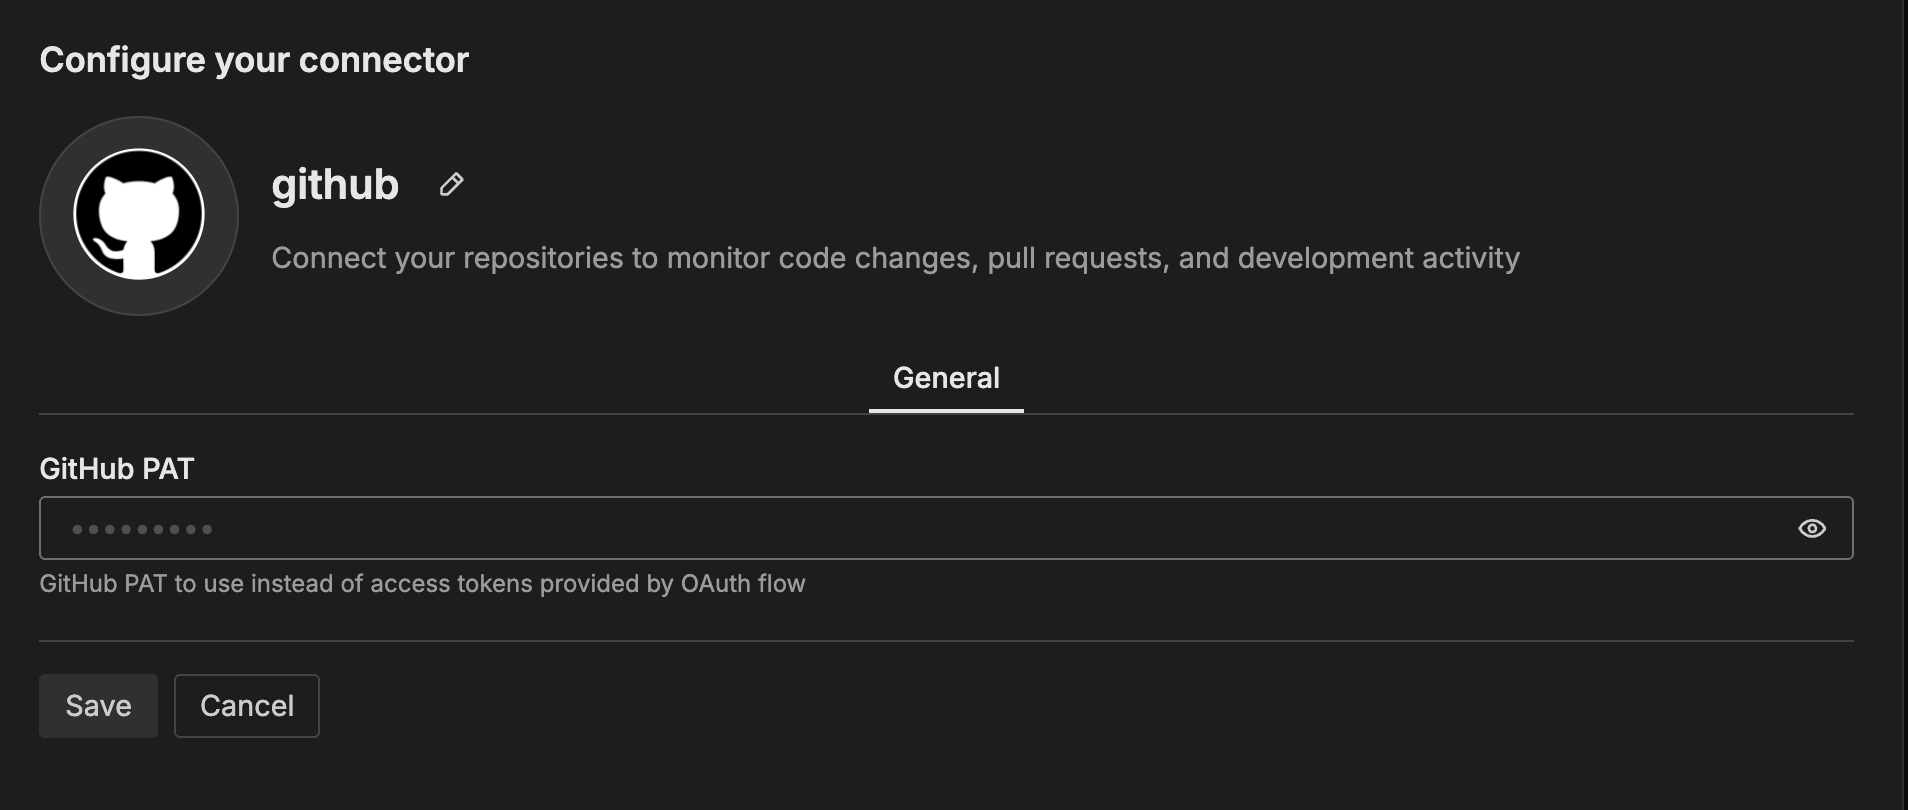
- GitHub: Navigate to Connectors > GitHub and authenticate via OAuth (GitHub App) or Personal Access Token. See GitHub Connector for details.
- GitLab: Navigate to Connectors > GitLab and authenticate via OAuth. See GitLab Connector for details.
Once connected, the Code Analyzer teammate activates fully. It can review pull requests for risks and missing tests, investigate CI/CD failures by correlating build logs with code changes, and identify deployment-correlated regressions during anomaly investigations. The Security Engineer teammate also uses the Git connector to surface Dependabot alerts and code scanning findings.
Step 5: Connect work tracking (recommended)
Connecting Jira or Linear activates the Work Tracker teammate, which synchronizes work items across your development tools and surfaces gaps where tasks are unowned or untracked.
- Jira: Navigate to Connectors > Atlassian and authenticate via OAuth or API token. See Atlassian Connector for details.
- Linear: Navigate to Connectors > Linear and authenticate via OAuth. See Linear Connector for details.
Work Tracker correlates tickets, PRs, alerts, and security findings. It operates read-only by default and proposes ticket creation only with your approval.
Teammate activation summary
Each specialized teammate activates when you connect the relevant data sources. The following table shows which connectors enable each teammate:
| Teammate | Activates with | What it does when active |
|---|---|---|
| OnCall AI | Always active | Orchestrates investigations, routes requests, synthesizes findings |
| SRE | Edge Delta MCP, Elastic, PagerDuty, Kubernetes, AWS, Azure, GCP | Queries logs, metrics, traces; investigates incidents; pages on-call |
| Code Analyzer | GitHub, CircleCI | Reviews PRs, investigates CI/CD failures, correlates code changes |
| Security Engineer | GitHub, AWS, Jira, CrowdStrike FDR | Assesses security posture, validates IAM, reviews access patterns |
| Work Tracker | GitHub, Jira, Linear | Creates tickets, synchronizes issues, retrieves runbooks |
Note: Connectors are automatically assigned to their corresponding specialized teammates when configured. You can modify assignments in the teammate configuration.
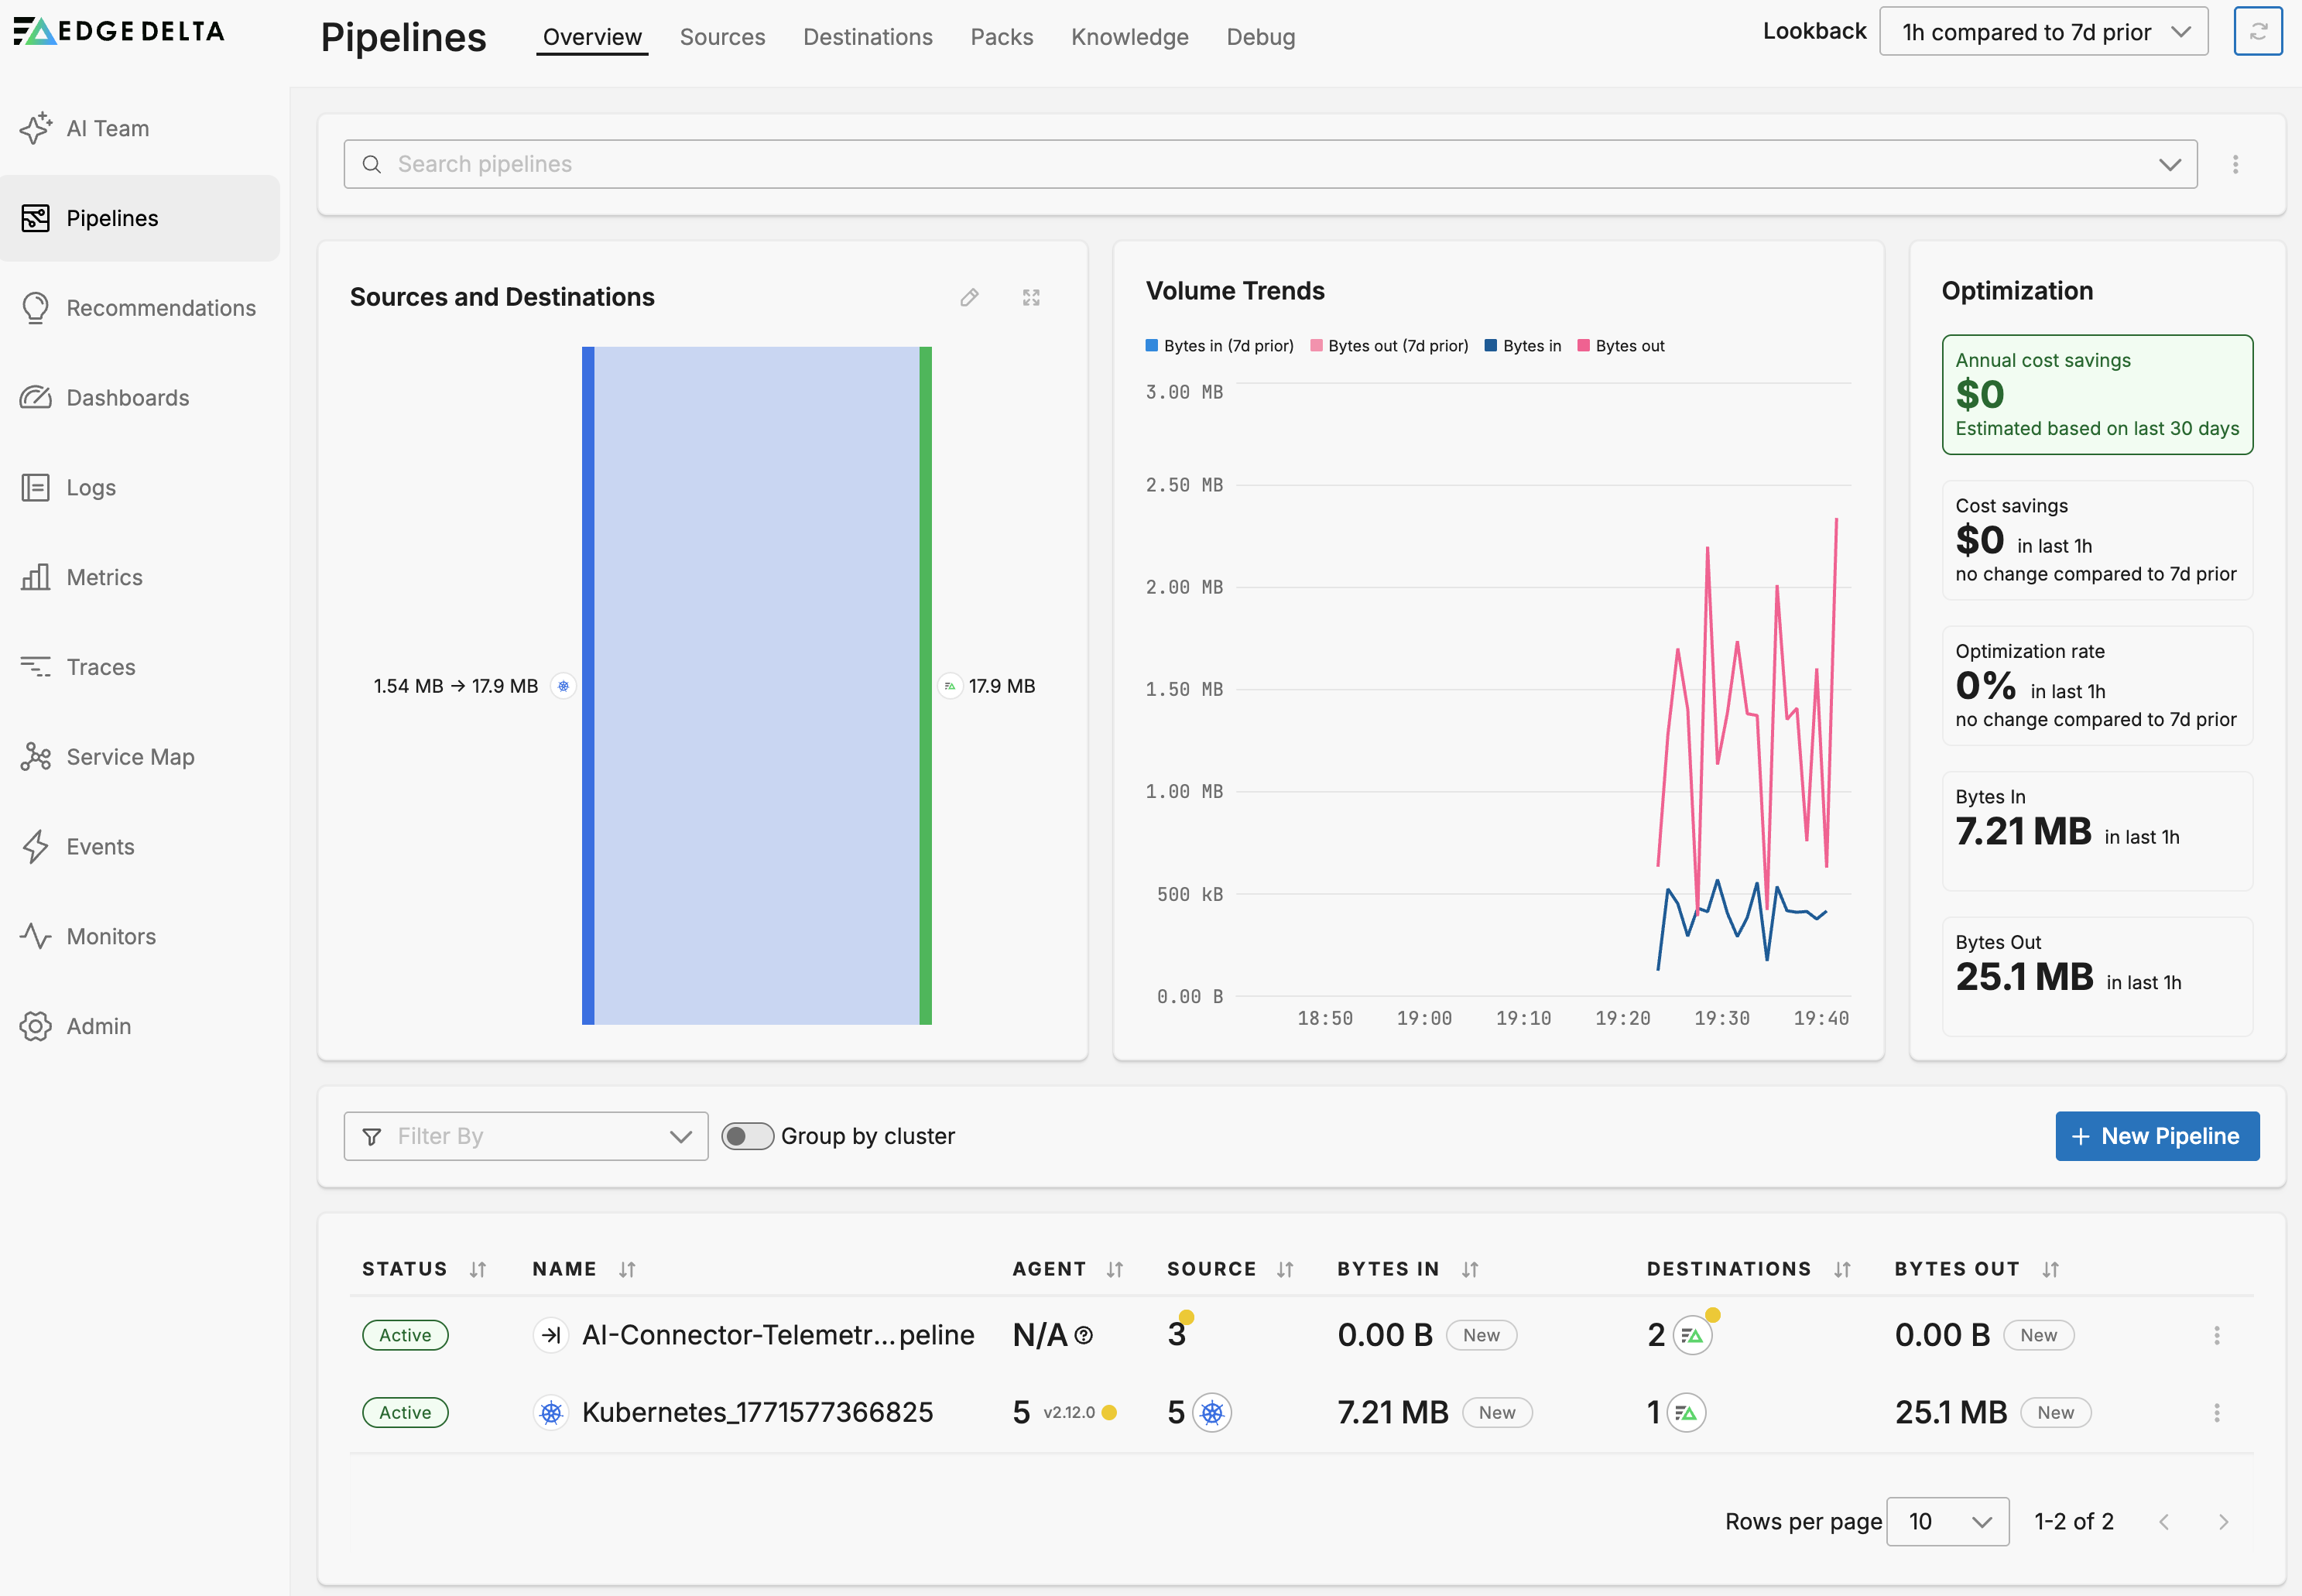
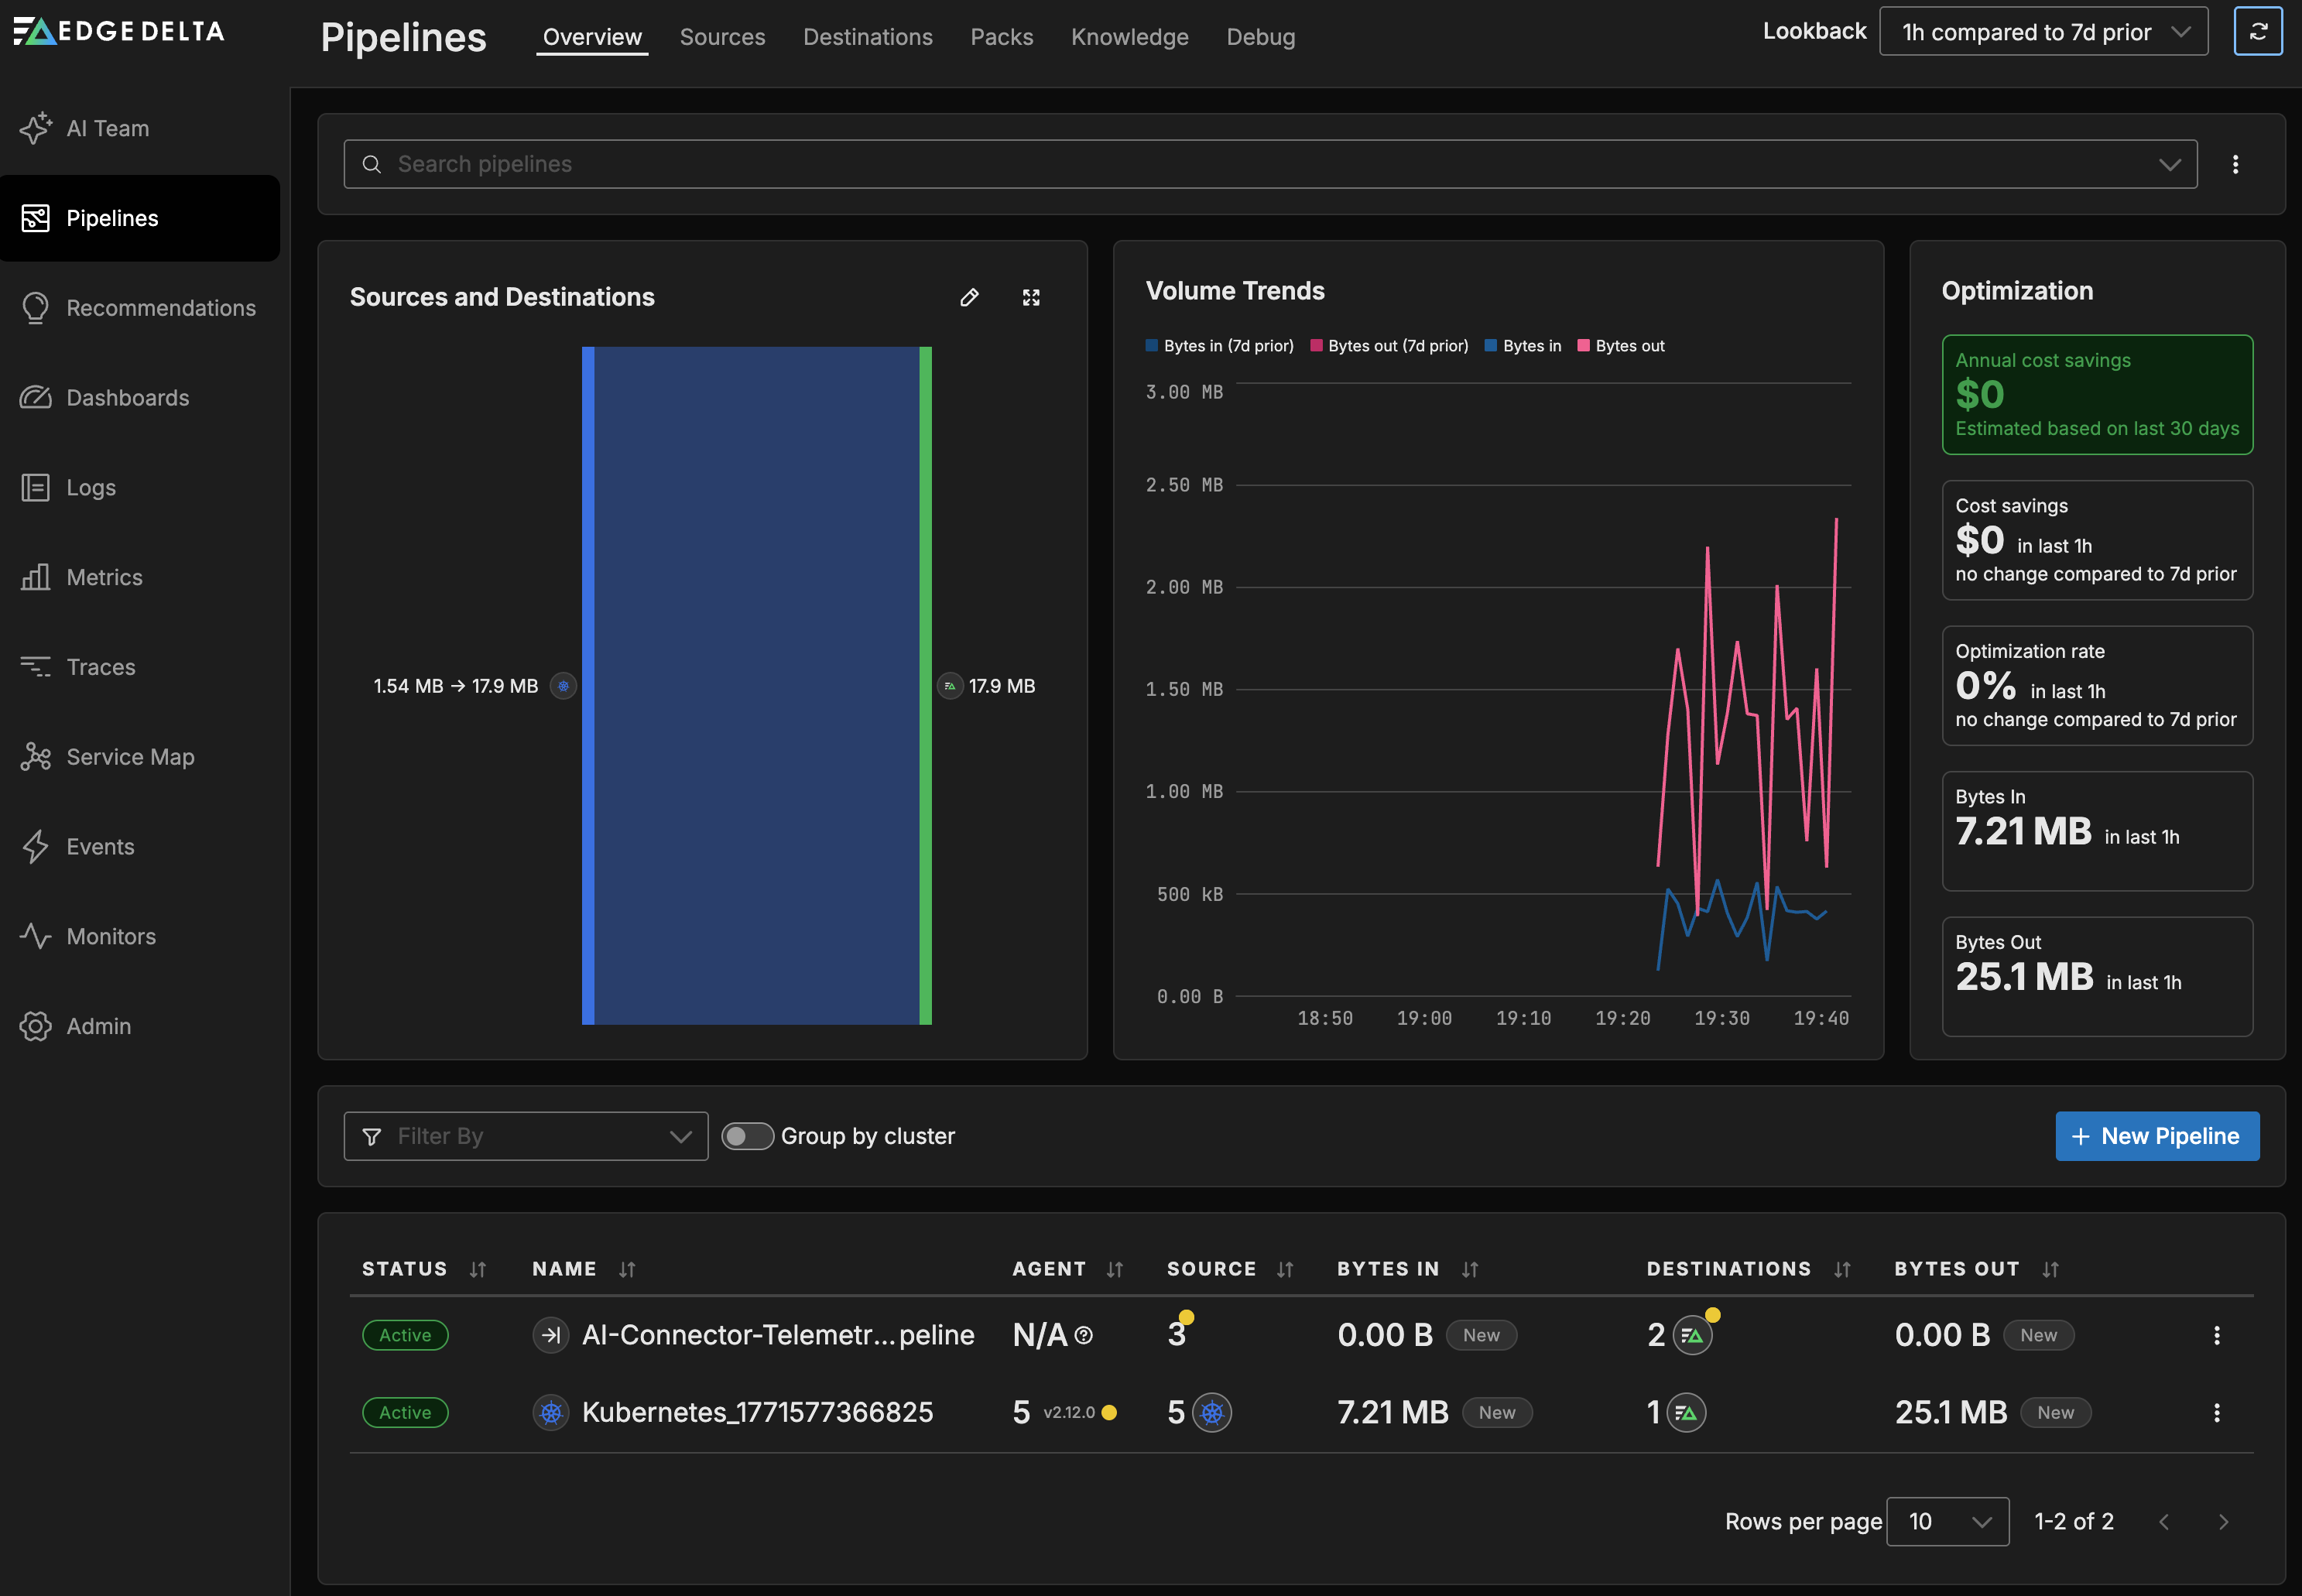
Review your pipelines
After connecting your data sources, Edge Delta has created two pipelines that power the AI Team. You can view them on the Pipelines page.
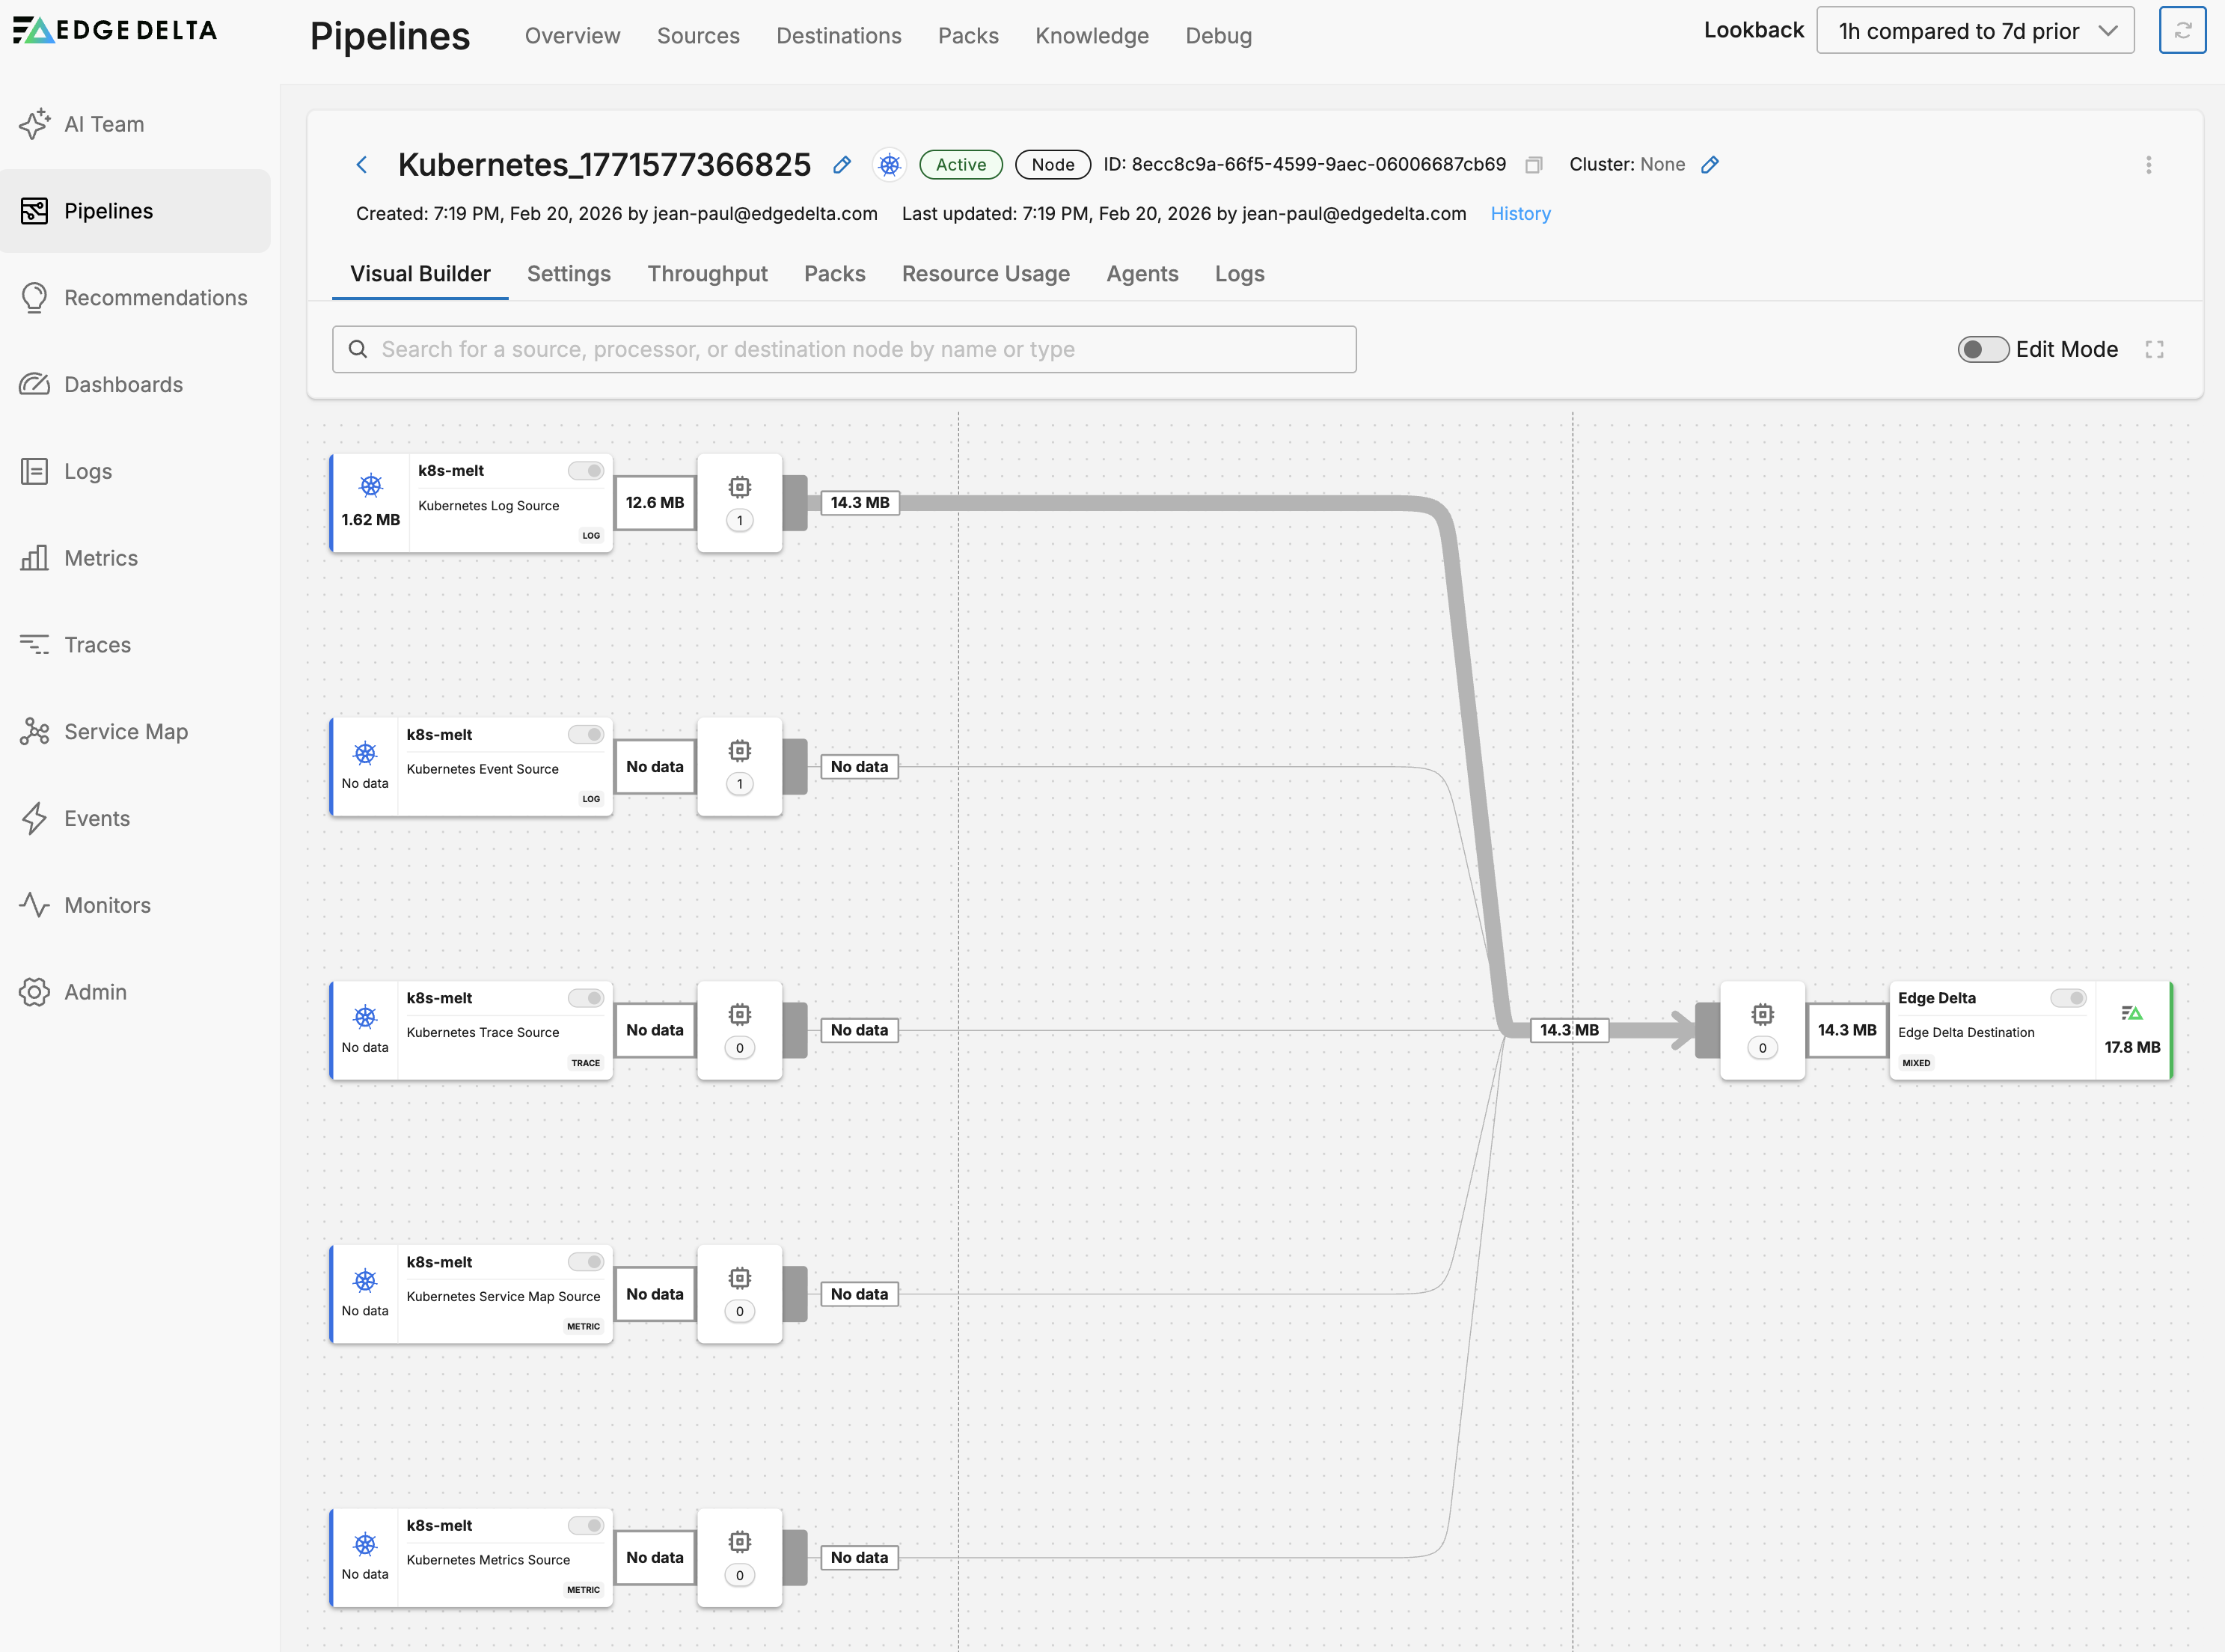
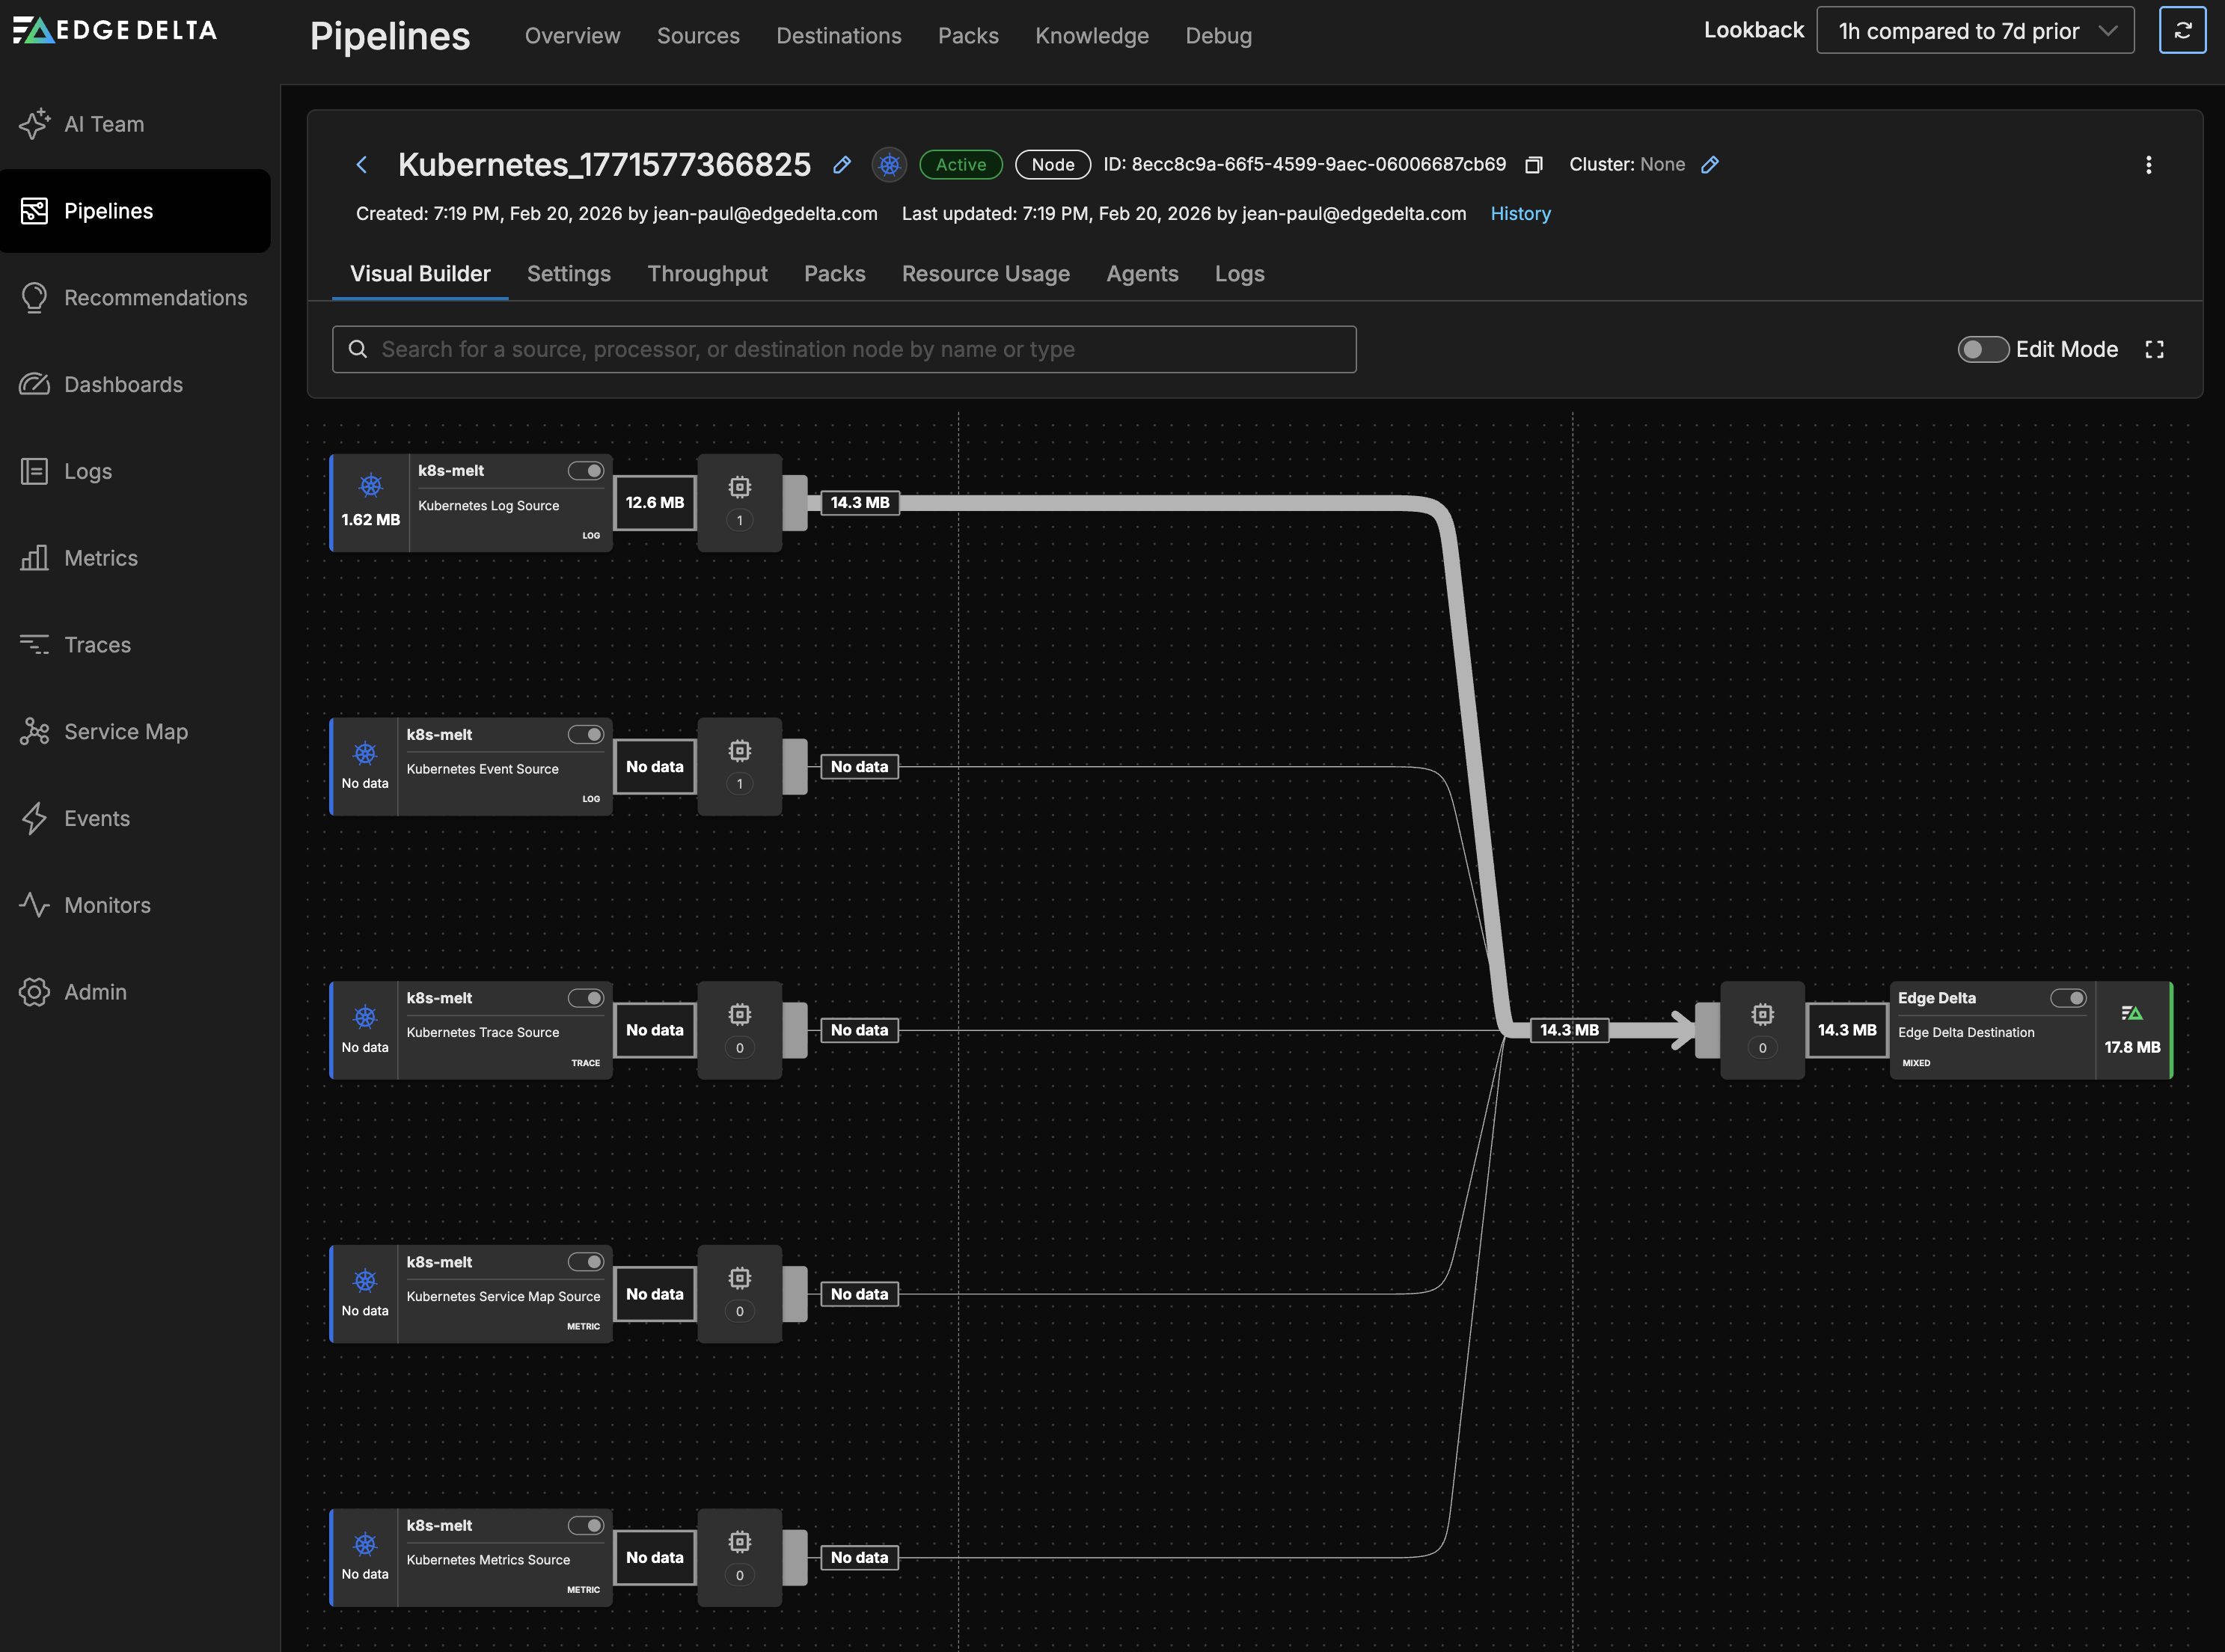
Kubernetes pipeline
The Kubernetes connector created a streaming pipeline that deploys an Edge Delta agent to your cluster. This pipeline collects five signal types through dedicated source nodes:
- Kubernetes input: Container logs from pods across namespaces (excludes Edge Delta’s own pods to avoid feedback loops). Logs pass through a log-to-pattern processor that generates pattern metrics for anomaly detection.
- Kubernetes events input: Pod, Node, Deployment, and Service lifecycle events. These also pass through the log-to-pattern processor.
- Kubernetes traces input: Distributed application traces across pod boundaries.
- Kubernetes traffic input: Network traffic between services, used to build the live service map.
- Kubernetes metrics input: Cluster and workload metrics (CPU, memory, disk I/O), excluding low-level cadvisor, node exporter, and kubelet metrics to reduce noise.
All five sources route through a shared processor sequence to an Edge Delta destination, where the data becomes available for AI teammates to query through the Edge Delta MCP Connector.
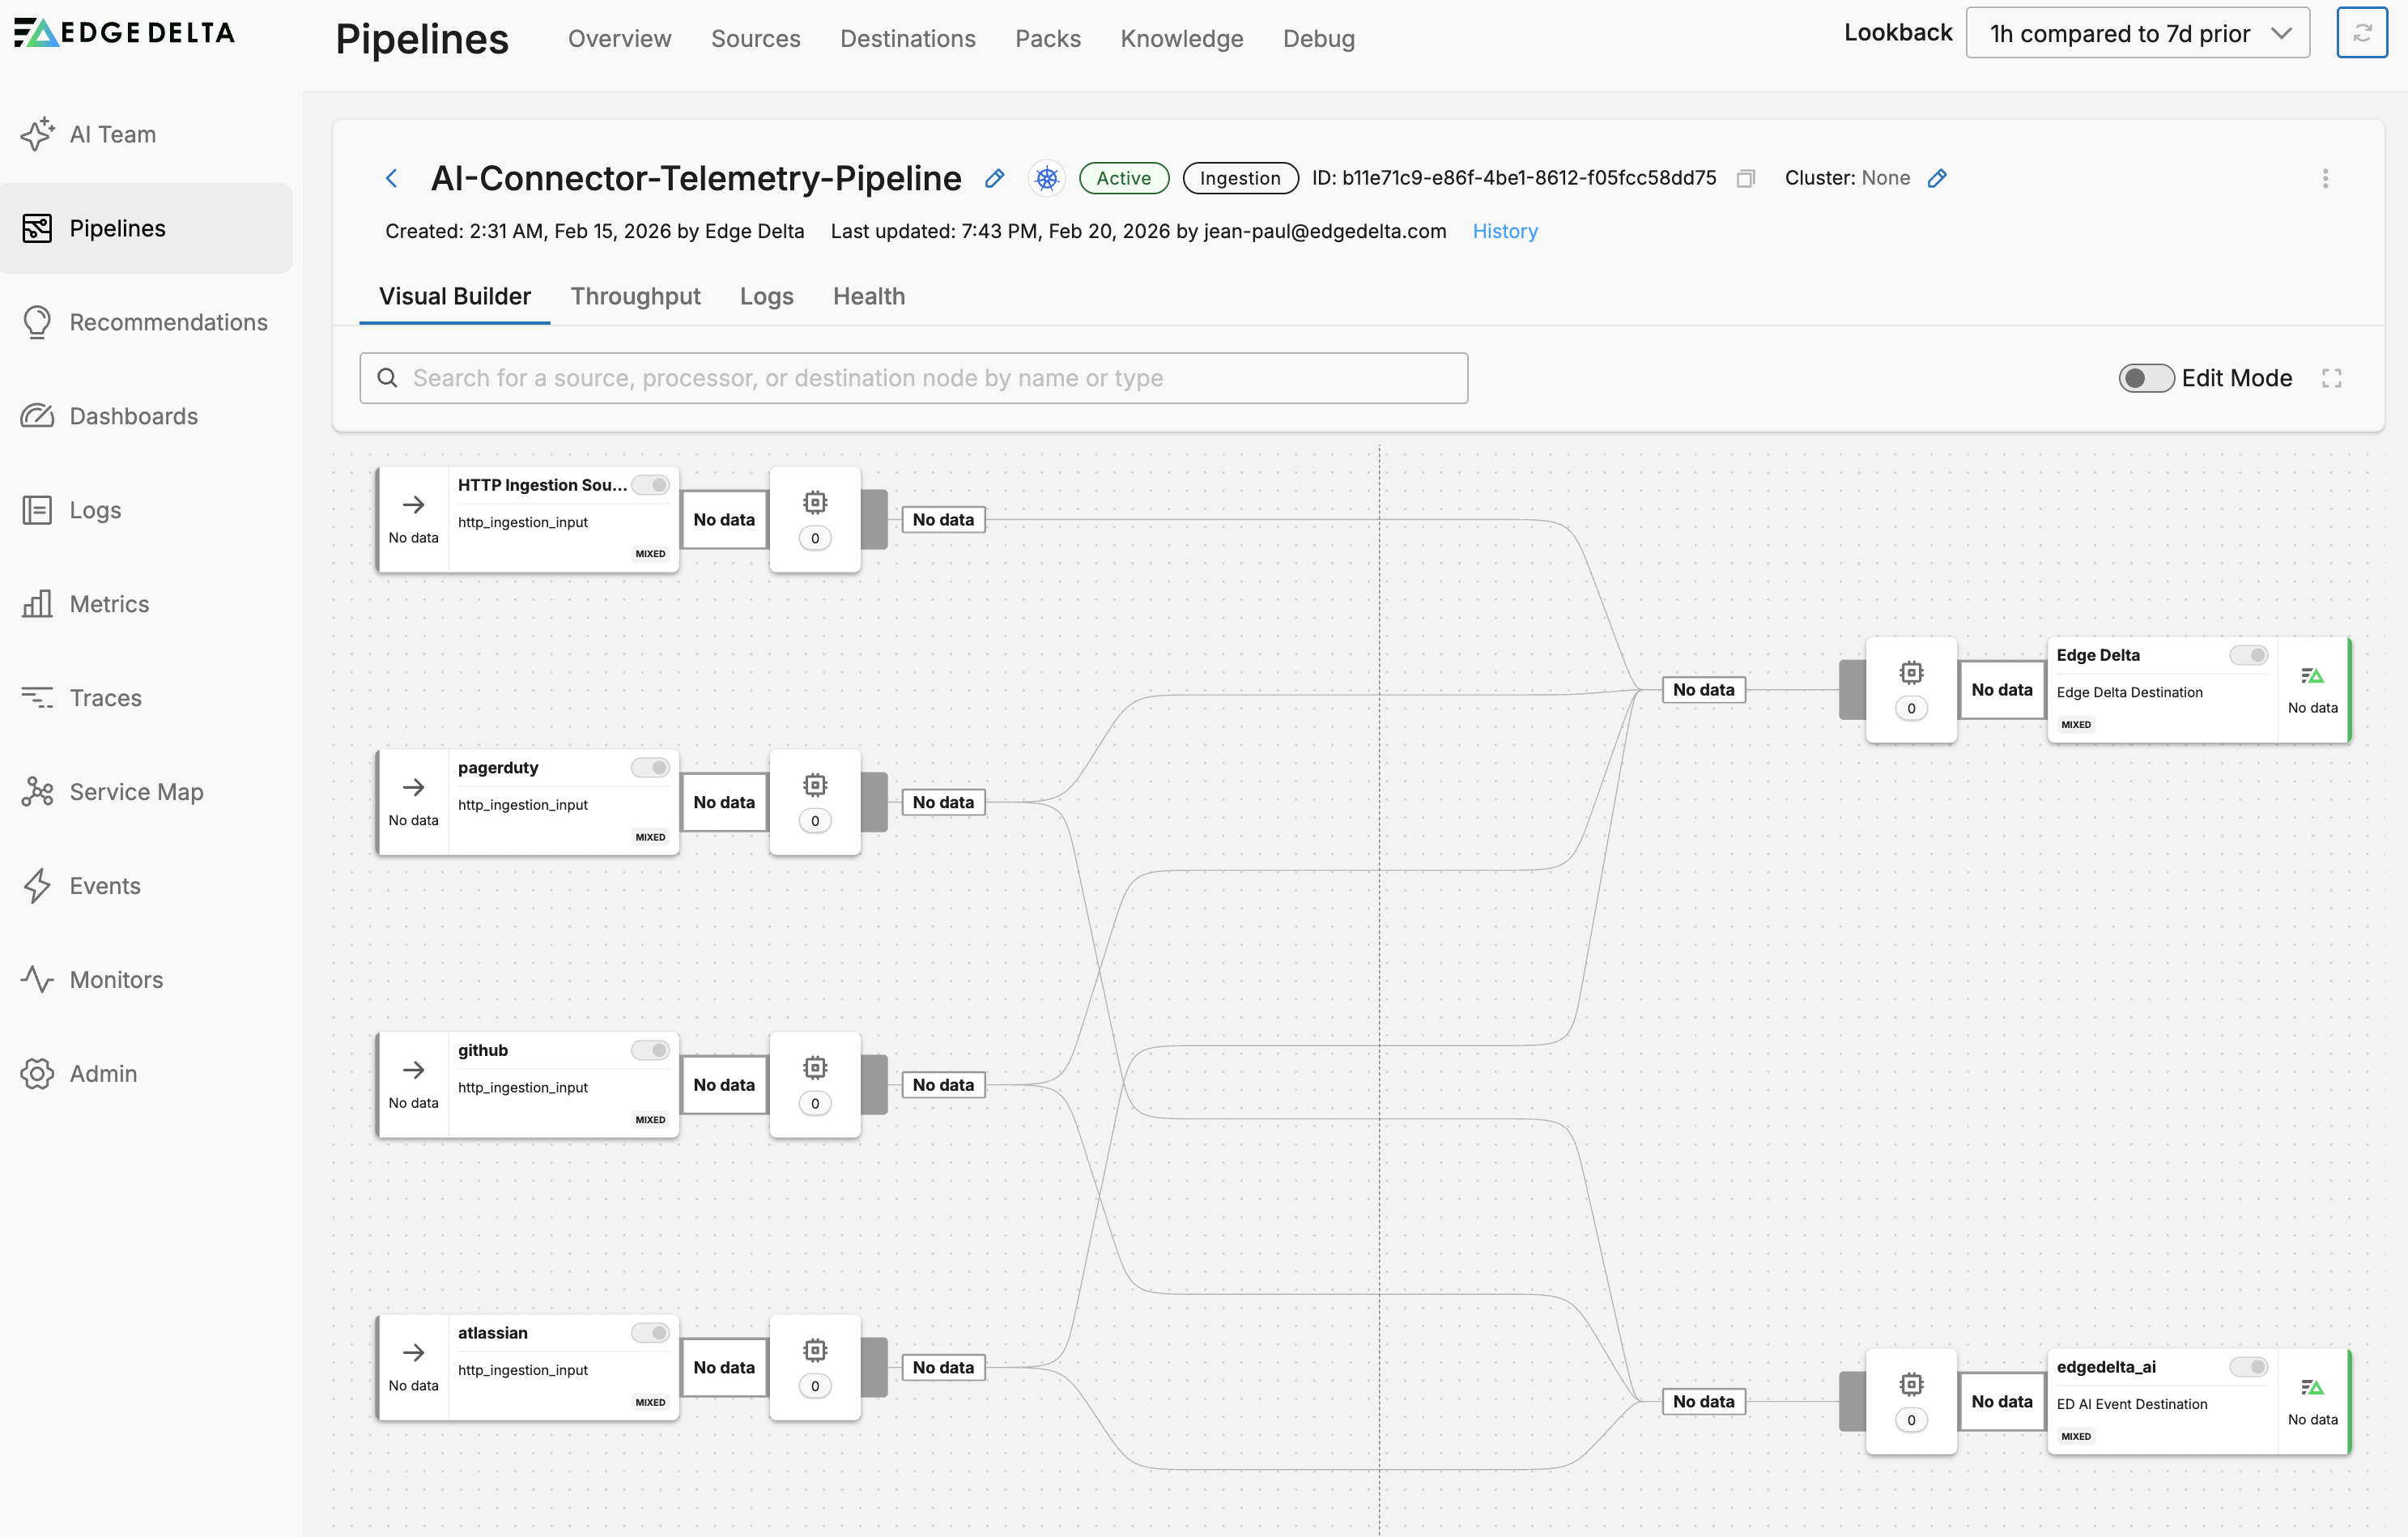
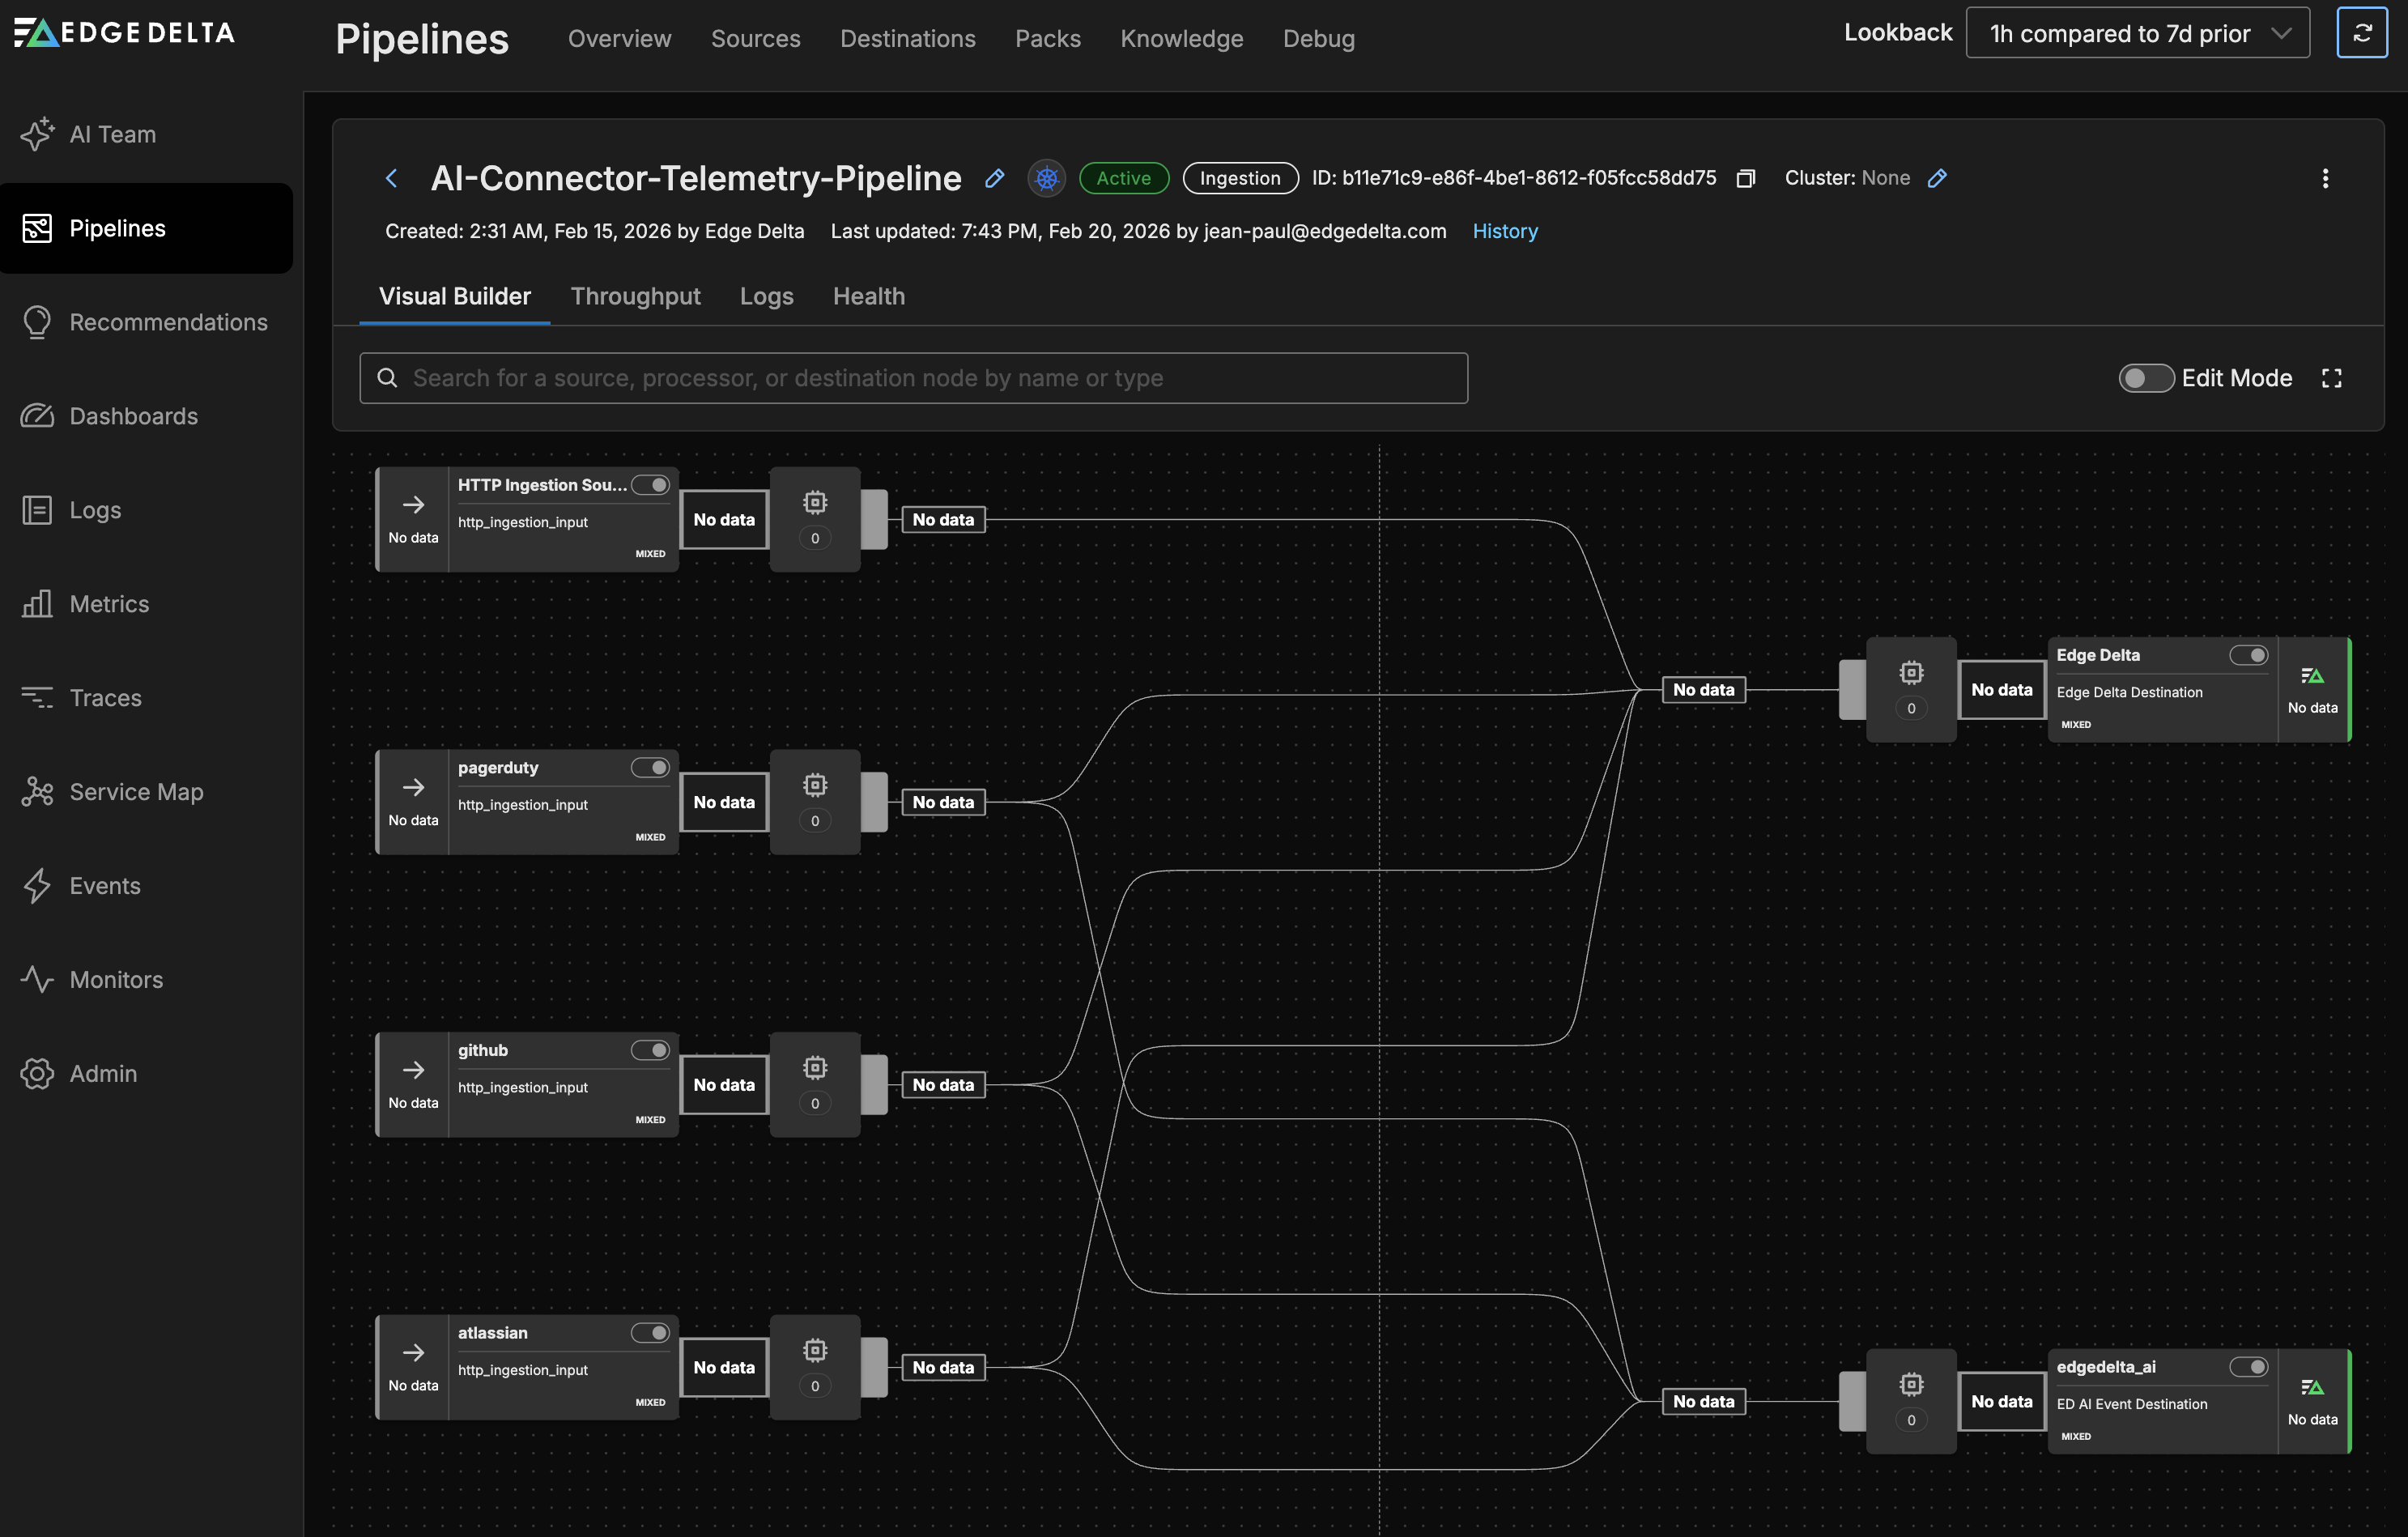
Event connector pipeline
The event connectors (PagerDuty, GitHub, and Atlassian) share a single ingestion pipeline called AI-Connector-Telemetry-Pipeline. Each event connector appears as a separate source node in this pipeline. When you add more event connectors in the future, they are automatically added as new sources to this same pipeline.
Each source routes to two destinations:
- Edge Delta: Stores the event data for search and analysis
- AI teammates: Delivers events directly to OnCall AI, which creates investigation threads and routes to the appropriate specialist
This dual-destination design means event data is both archived for historical queries and immediately actionable by AI teammates.
For more details on how connectors create and use pipelines, see AI Team Overview.
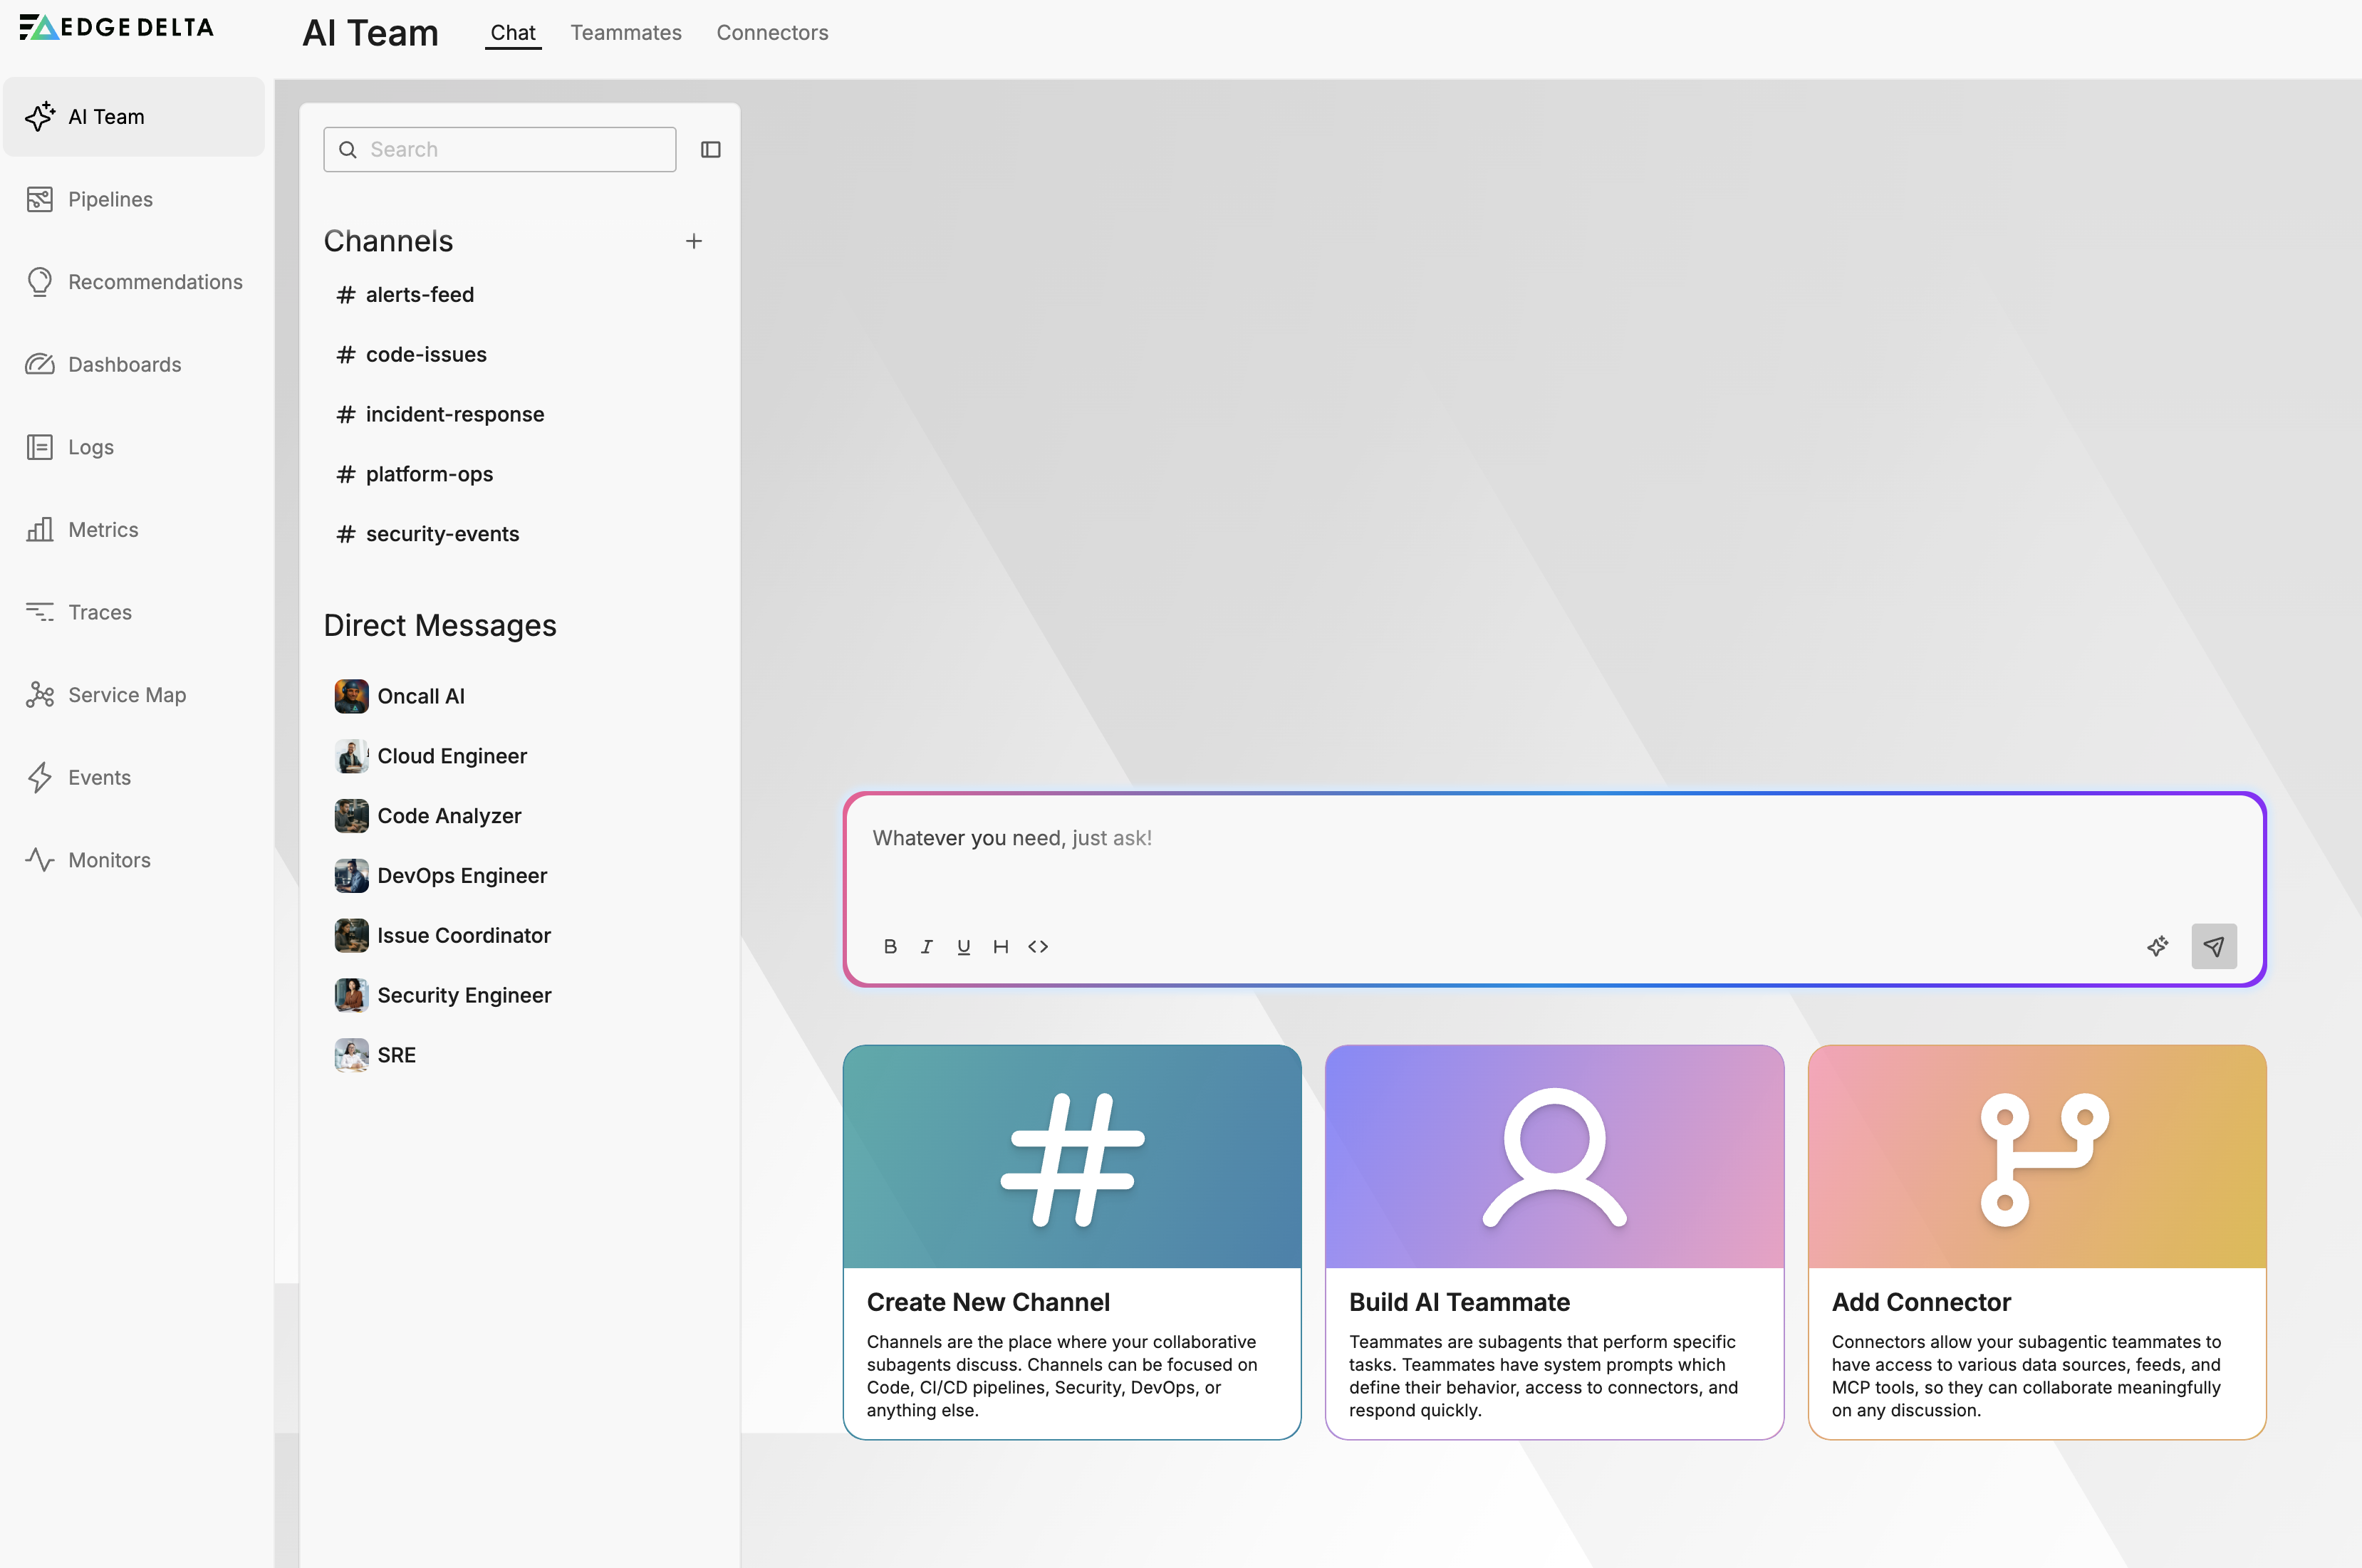
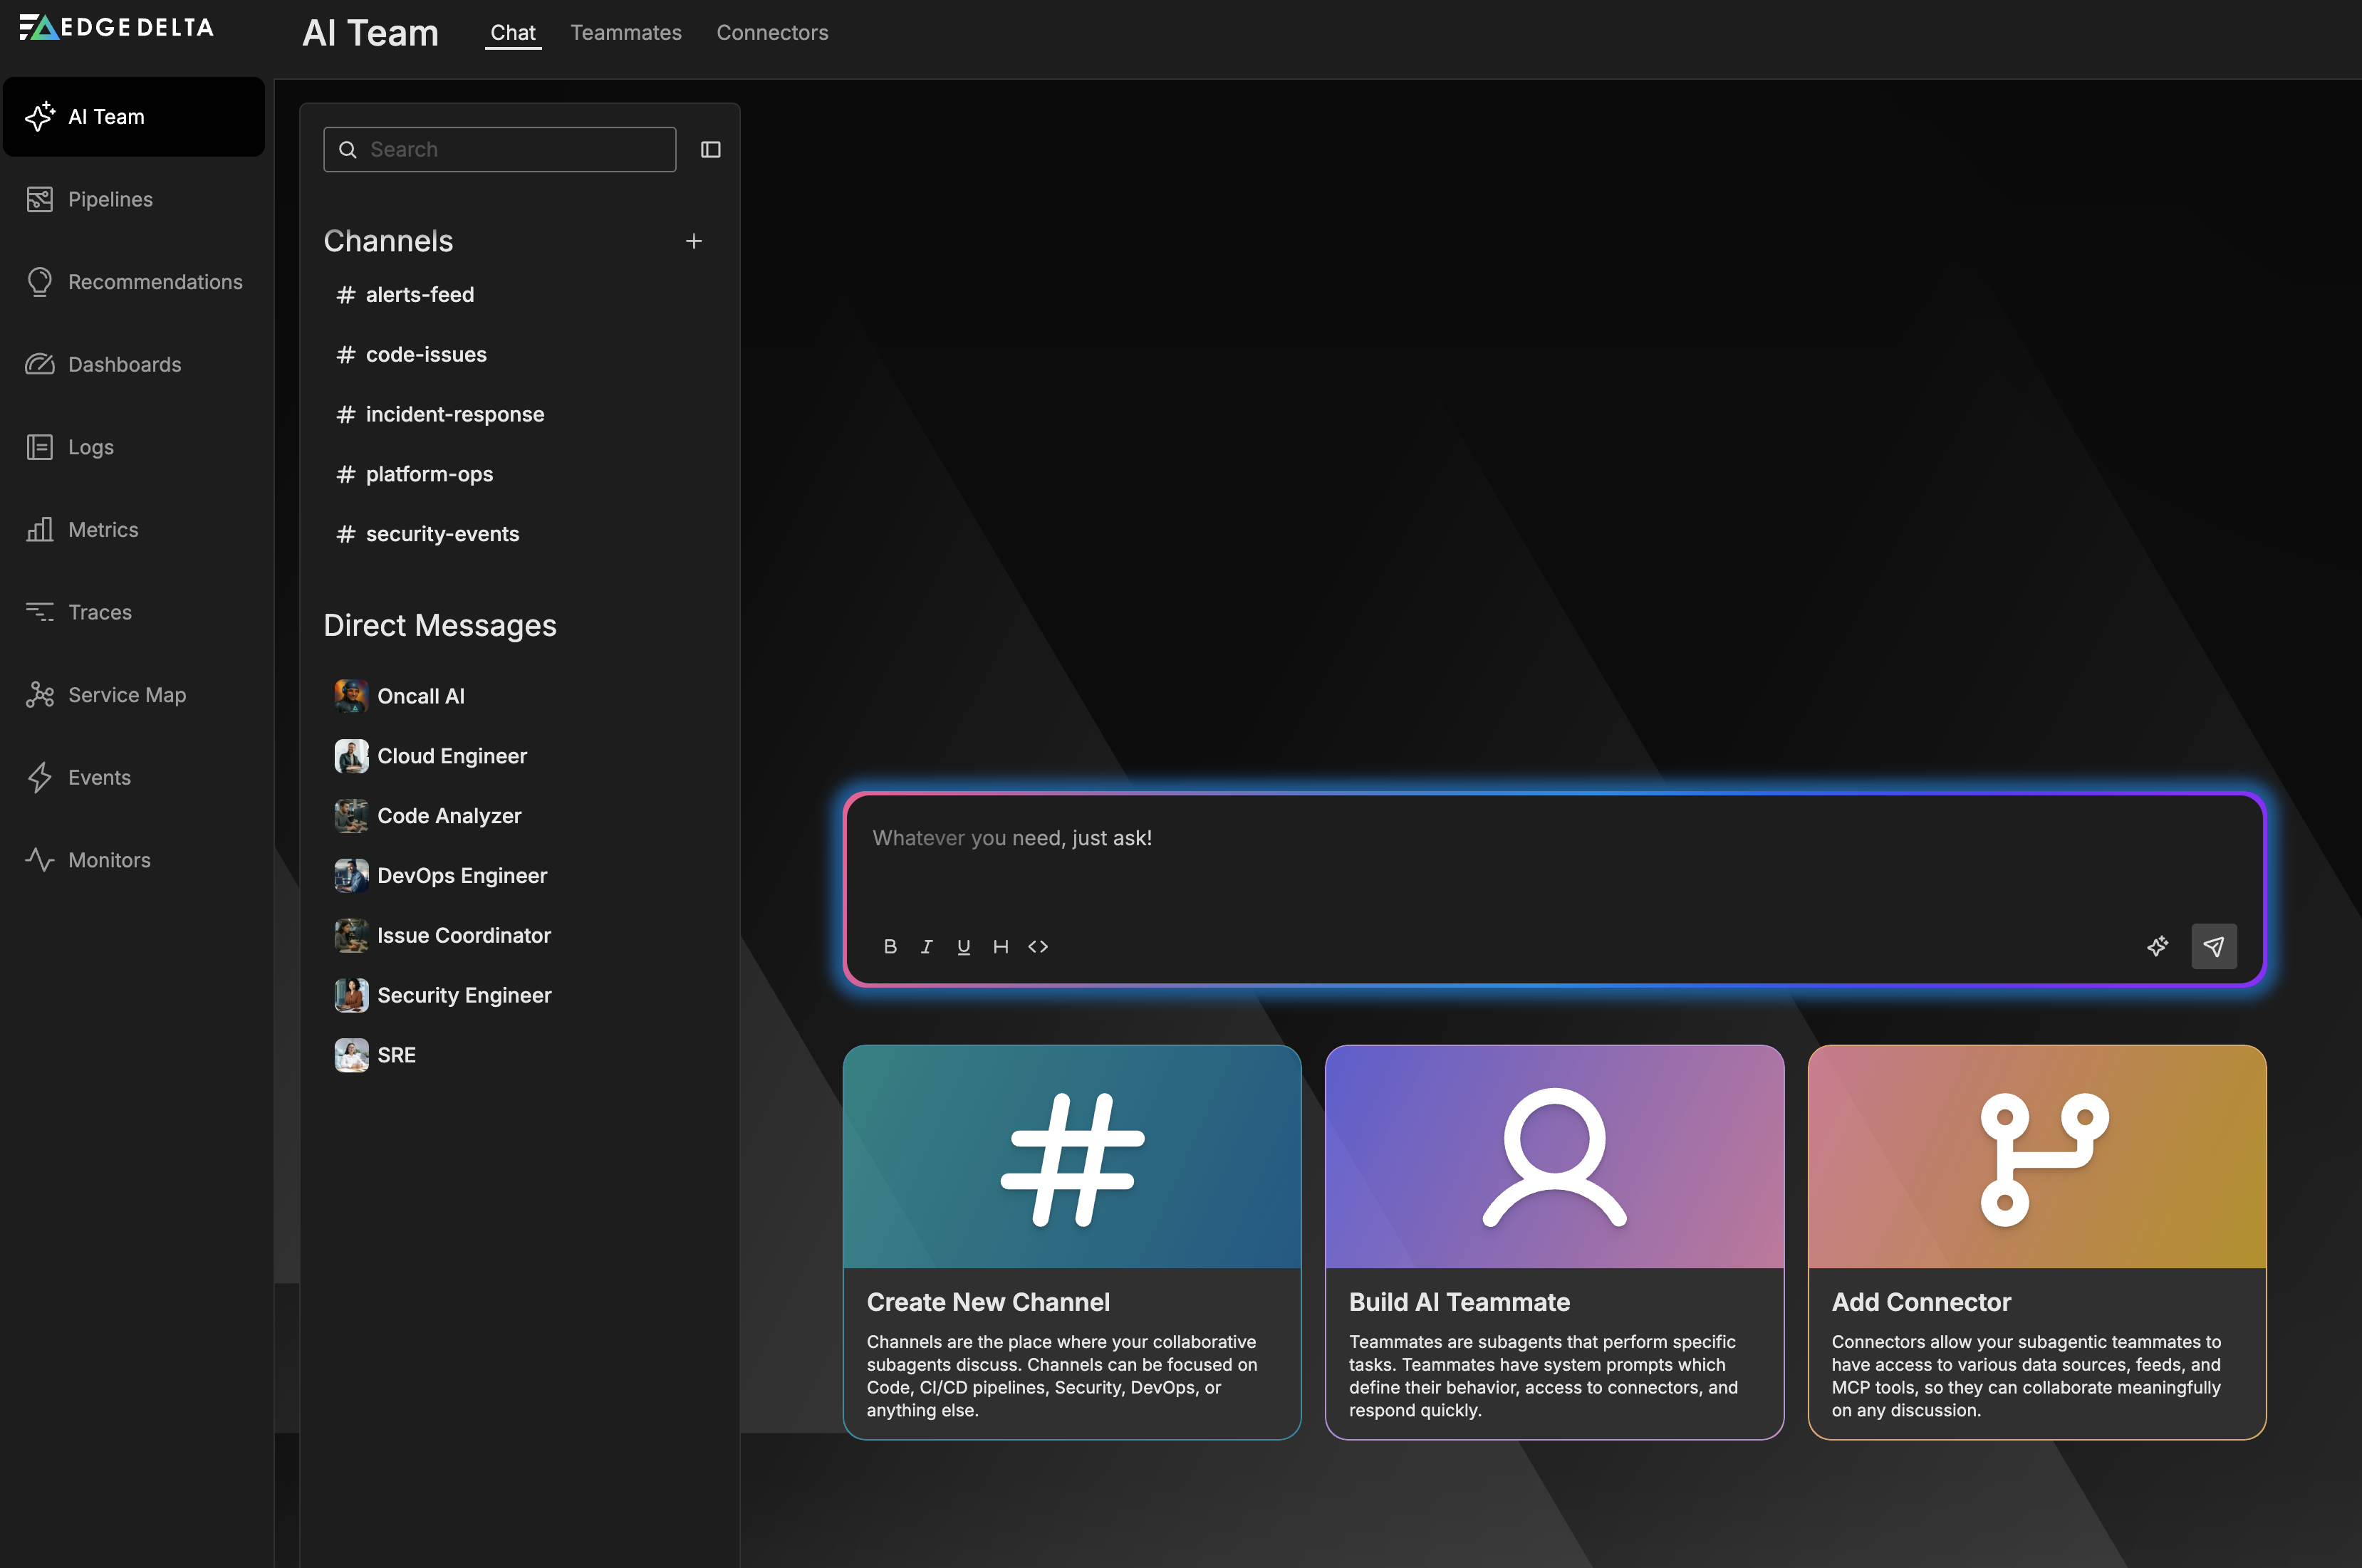
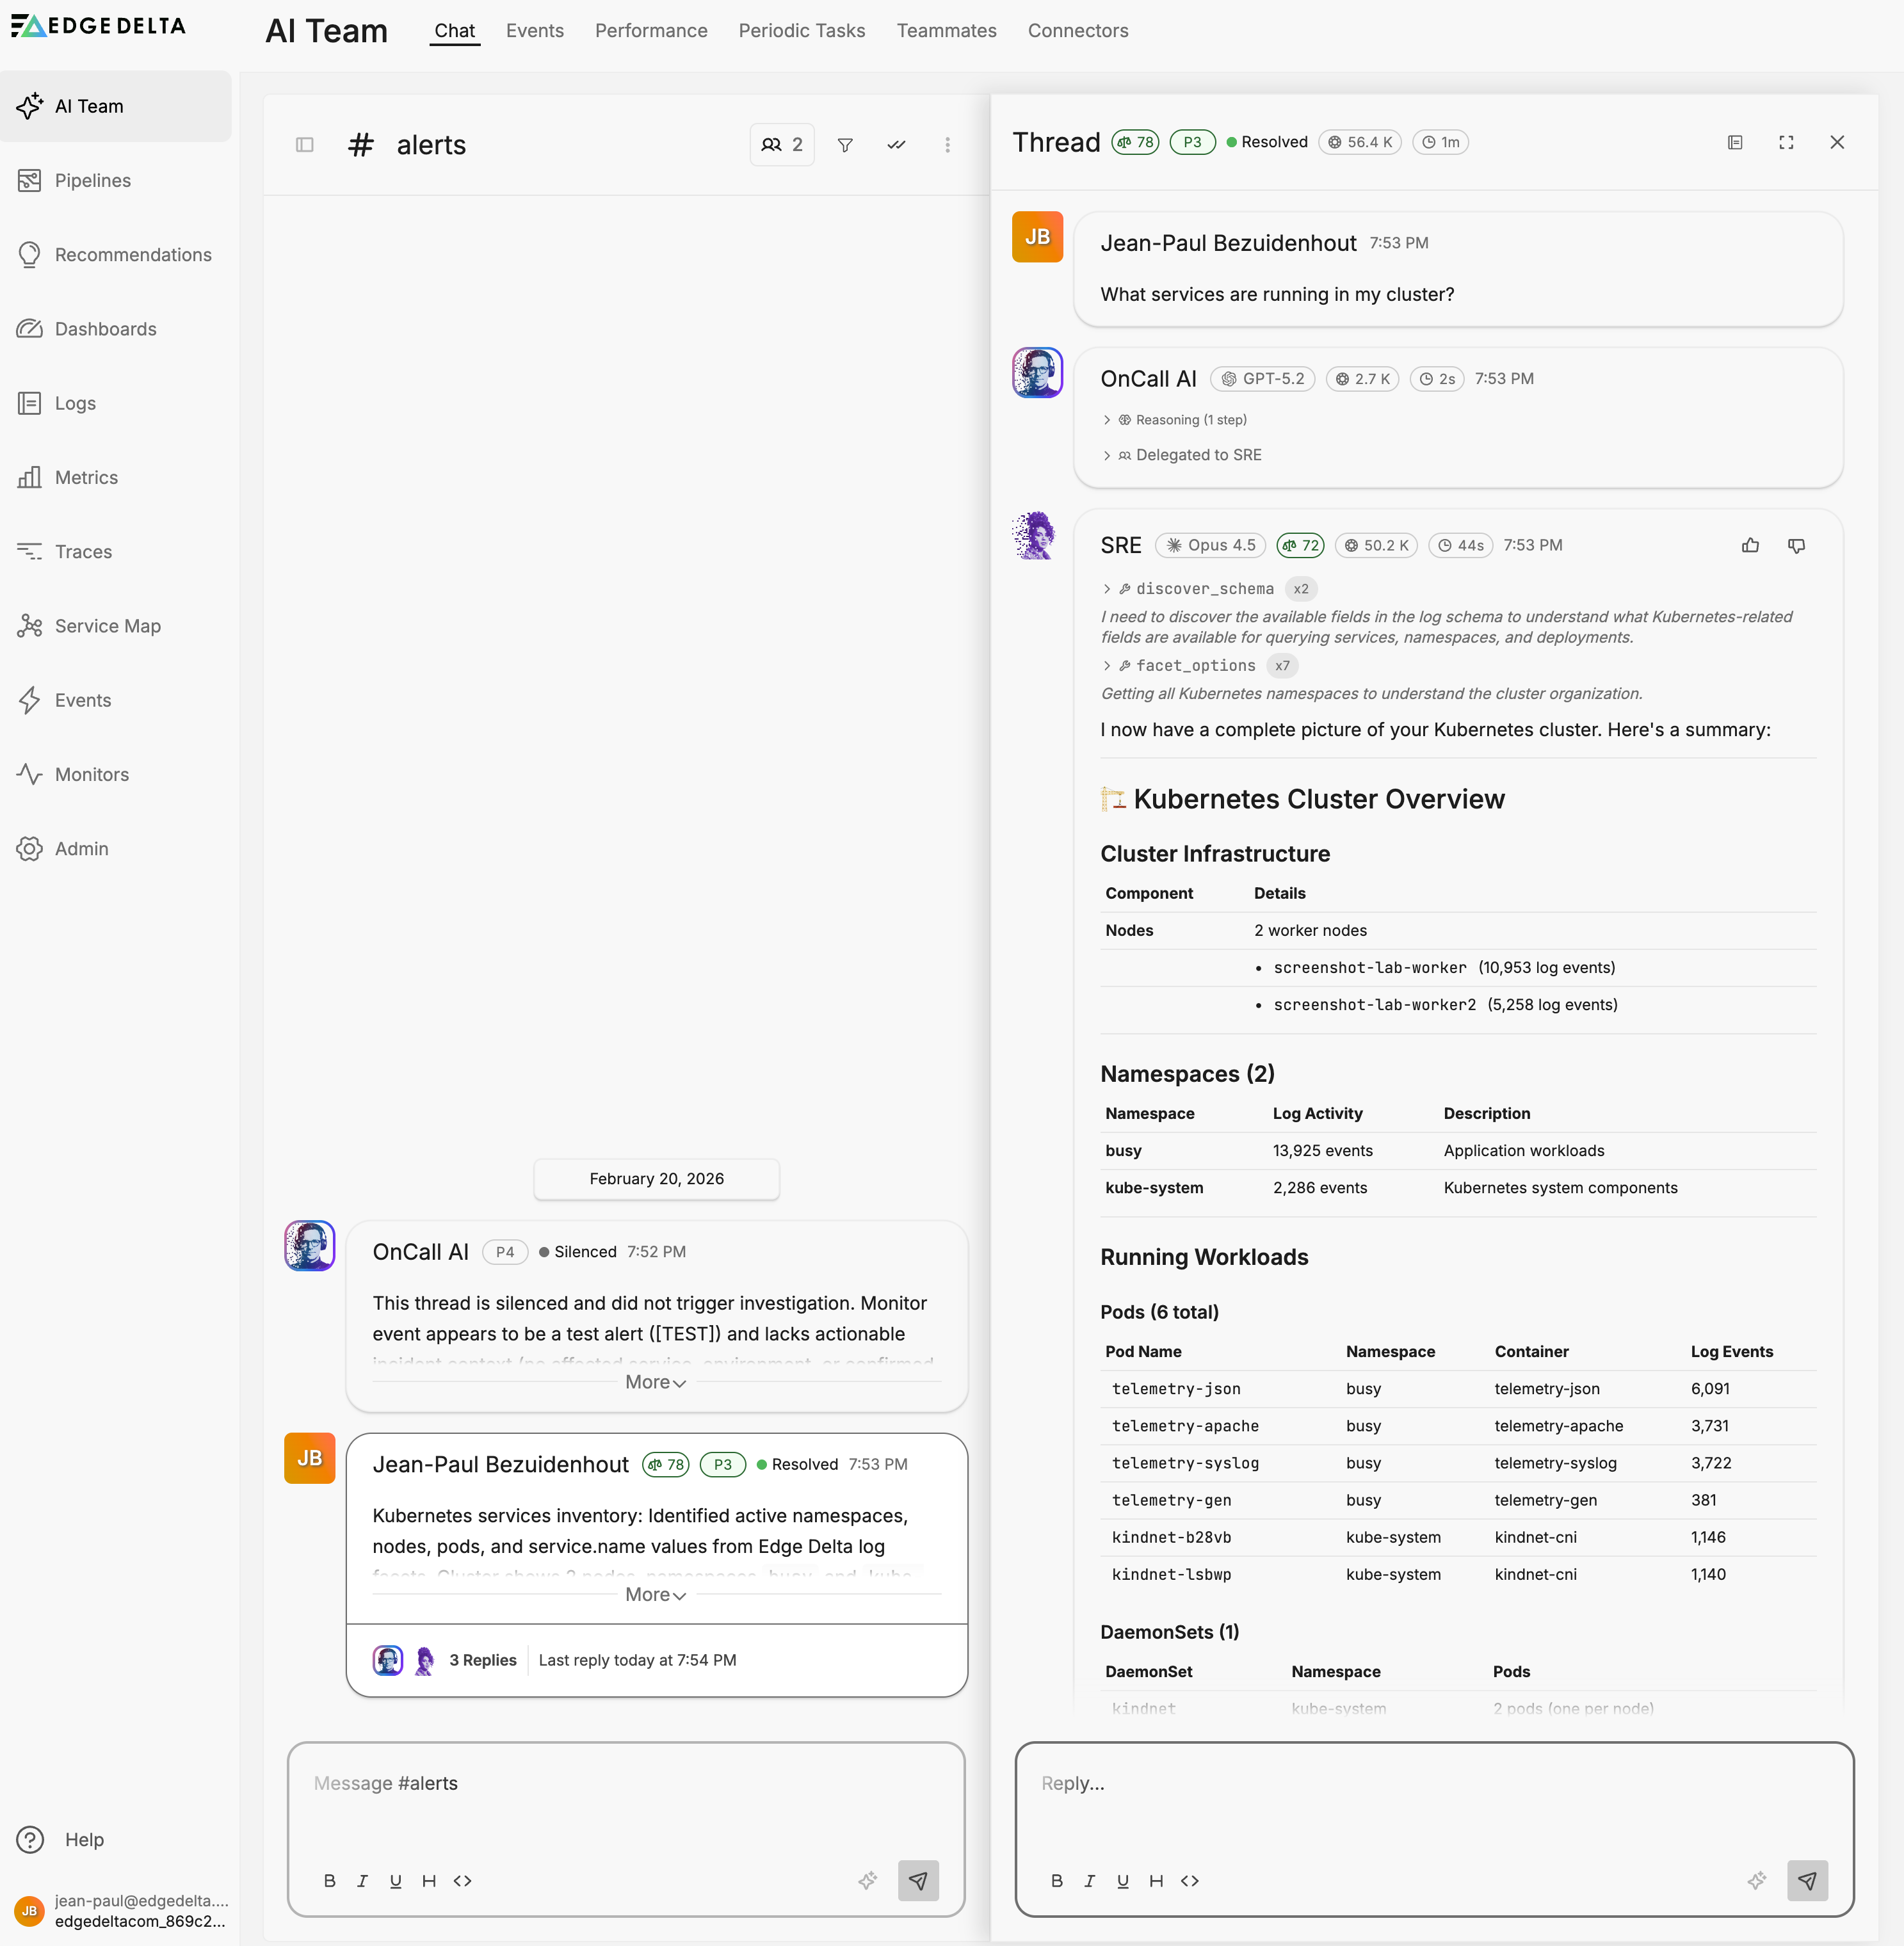
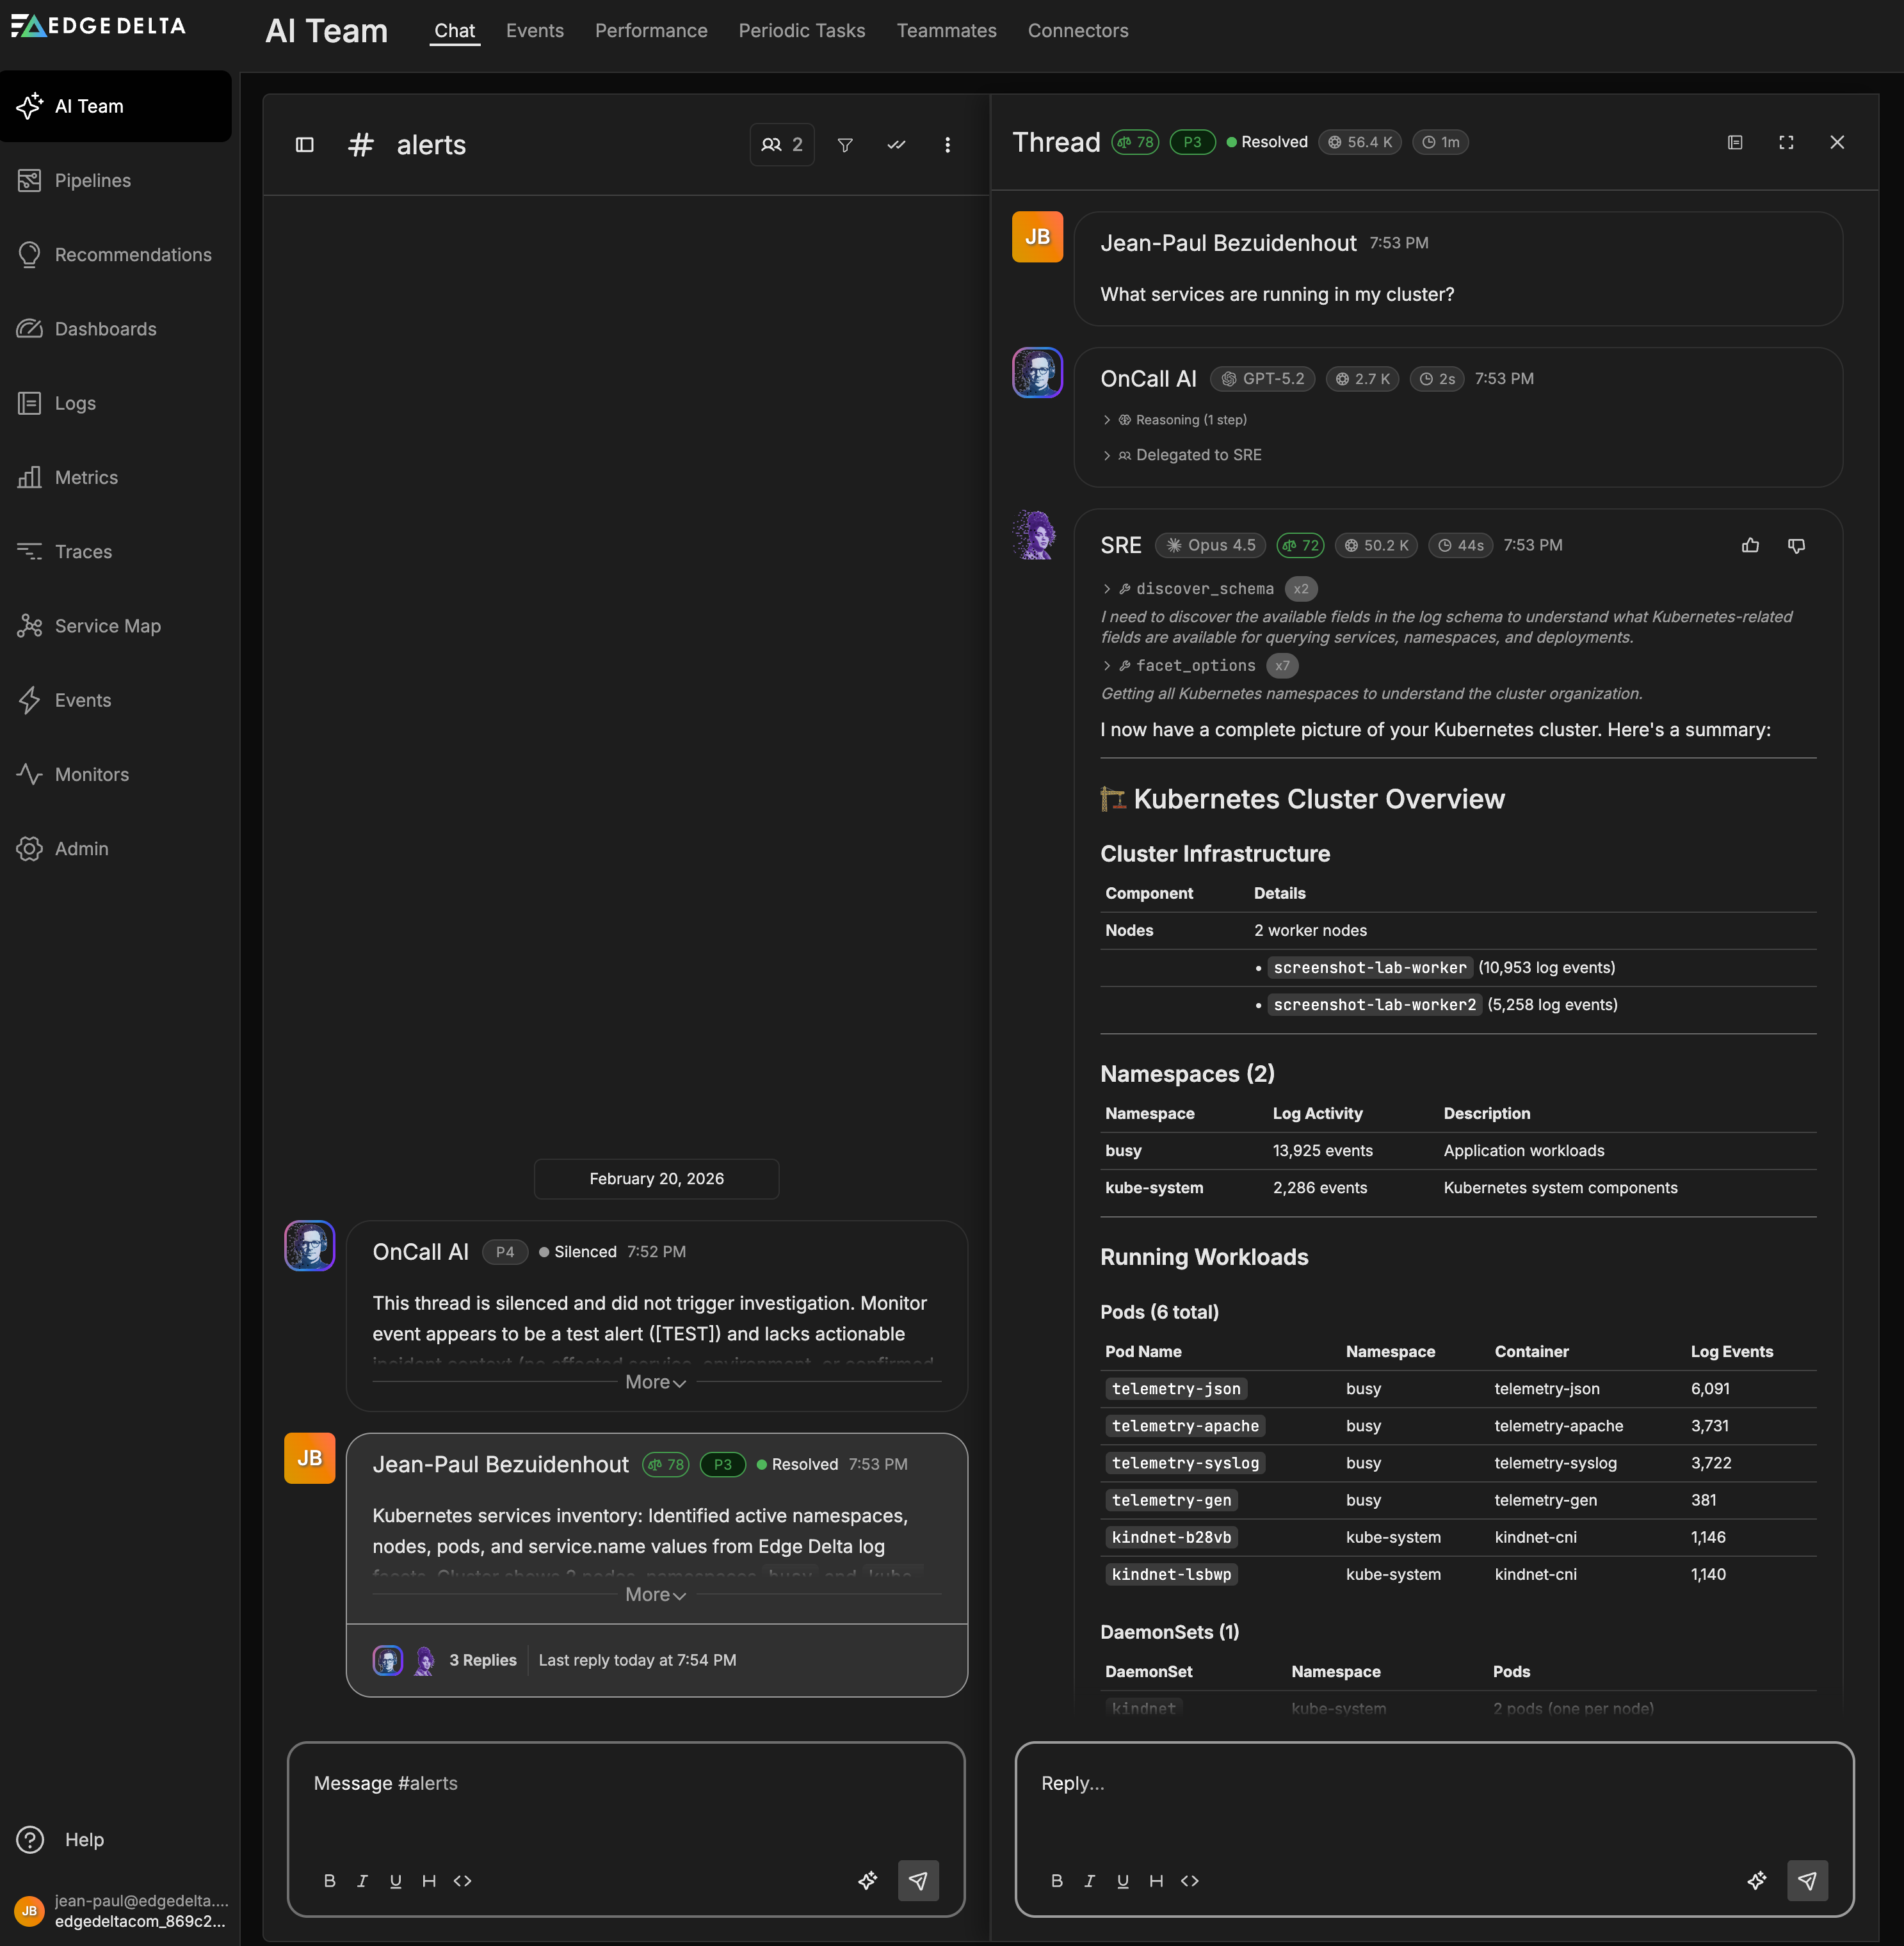
Start your first conversation
With connectors in place, you can begin using AI Team:
- Click on the Chat tab.
- Select a channel (for example alerts or security-issues).
- Type your question in the message box (for example, “Show me recent anomalies in my logs” or “Help me understand my pipeline configuration”).
- Press Enter or click Send.
OnCall AI orchestrates the response by routing your request to the appropriate specialized teammates in the thread.
Teammates also respond to incoming events from connectors. For example, when a PagerDuty webhook sends an incident notification, AI teammates can investigate and respond in dedicated channels:
Use message enhancement
Message Enhancement uses AI to expand simple queries into more detailed, context-rich prompts. For example, typing "What caused the recent spike in errors?" and clicking the Enhance Message button transforms your query into something like: "Analyze recent error patterns in my telemetry data, identify the root causes of any spikes, correlate with deployment events or infrastructure changes, and provide actionable recommendations to prevent future occurrences." You can review and edit the enhanced version before sending. Enhanced messages typically result in more accurate, comprehensive responses from AI Team members.
Create custom teammates and channels
Beyond the out-of-the-box teammates and channels, you can create custom teammates and channels for your specific workflows.
- Create a custom teammate with specialized roles and connector assignments
- Create and manage channels for team-specific collaboration spaces
To create a custom channel:
- In the Chat tab, locate the Channels section
- Click the + (plus) icon next to “Channels”
- Fill in the channel details:
- Name: Descriptive name (for example, “database-ops”, “cost-optimization”)
- Description: Brief description of the channel’s purpose
- Select Teammates: Choose which teammates should participate
- Click Create
Next steps
- Explore specialized teammates to understand each teammate’s domain expertise
- View AI Team use cases for complete end-to-end investigation scenarios
- Build automated workflows to create deterministic multi-step processes
- Configure additional connectors to expand teammate capabilities
- Review default workflows provisioned for your organization
- Monitor AI Team performance to track and optimize teammate effectiveness
- Review security best practices for production deployments
Viewing events
The Events tab provides visibility into all activity that triggers AI teammate responses, whether from users, monitors, scheduled tasks, or event connectors.
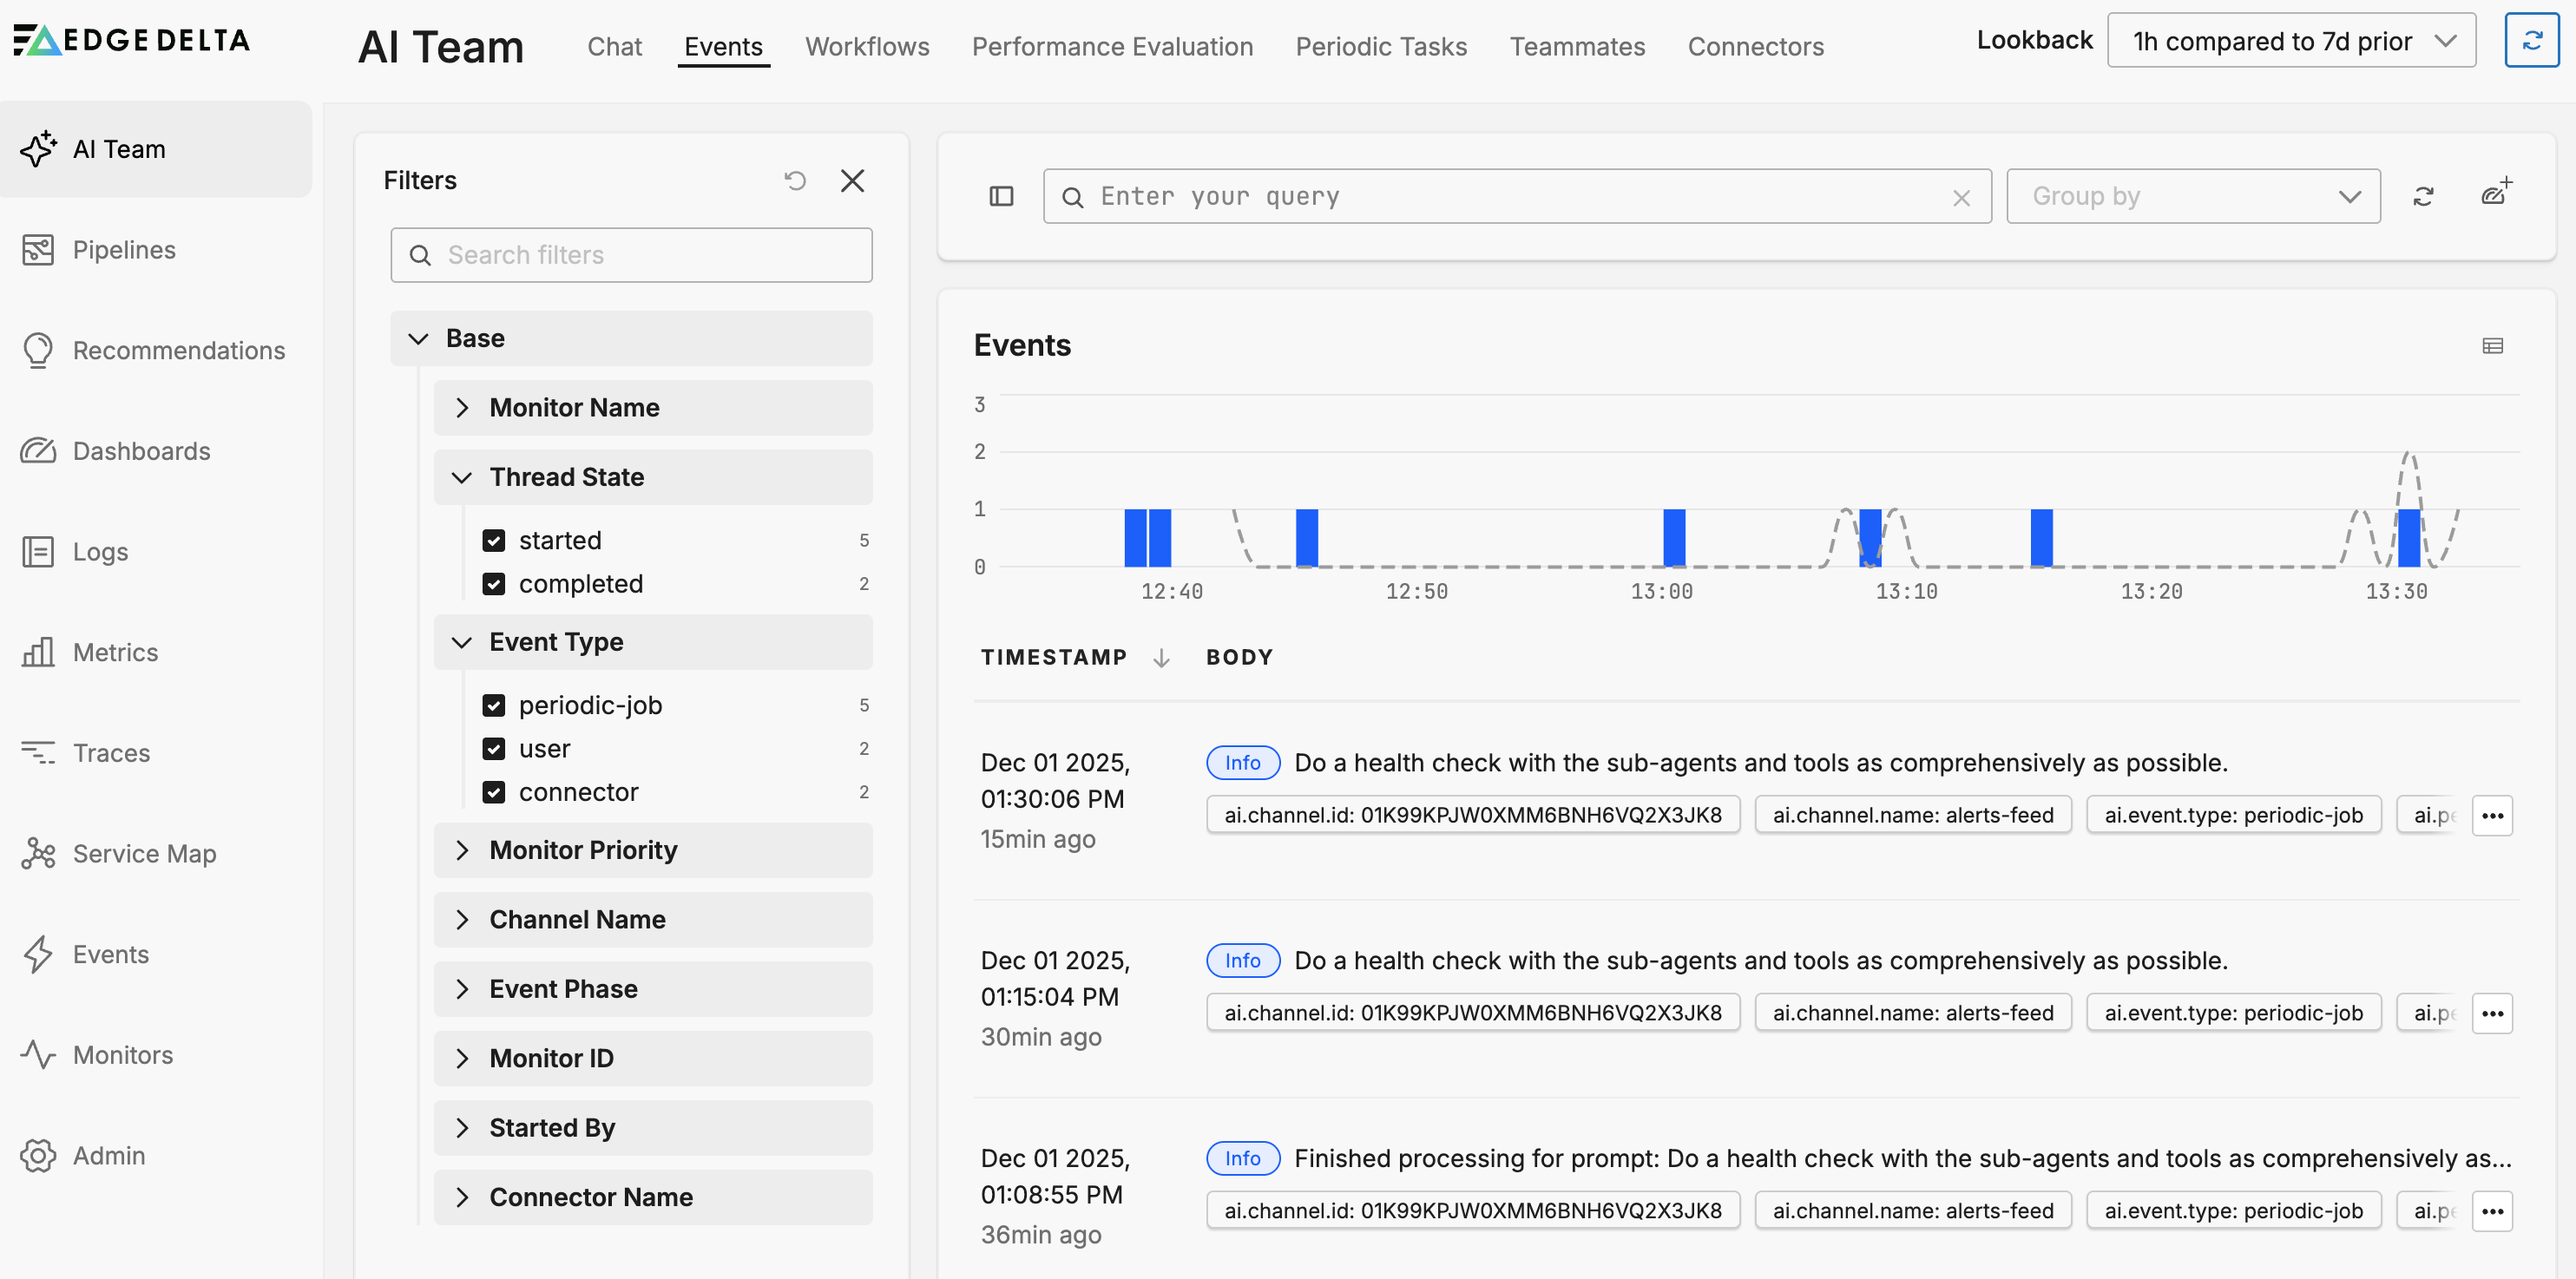
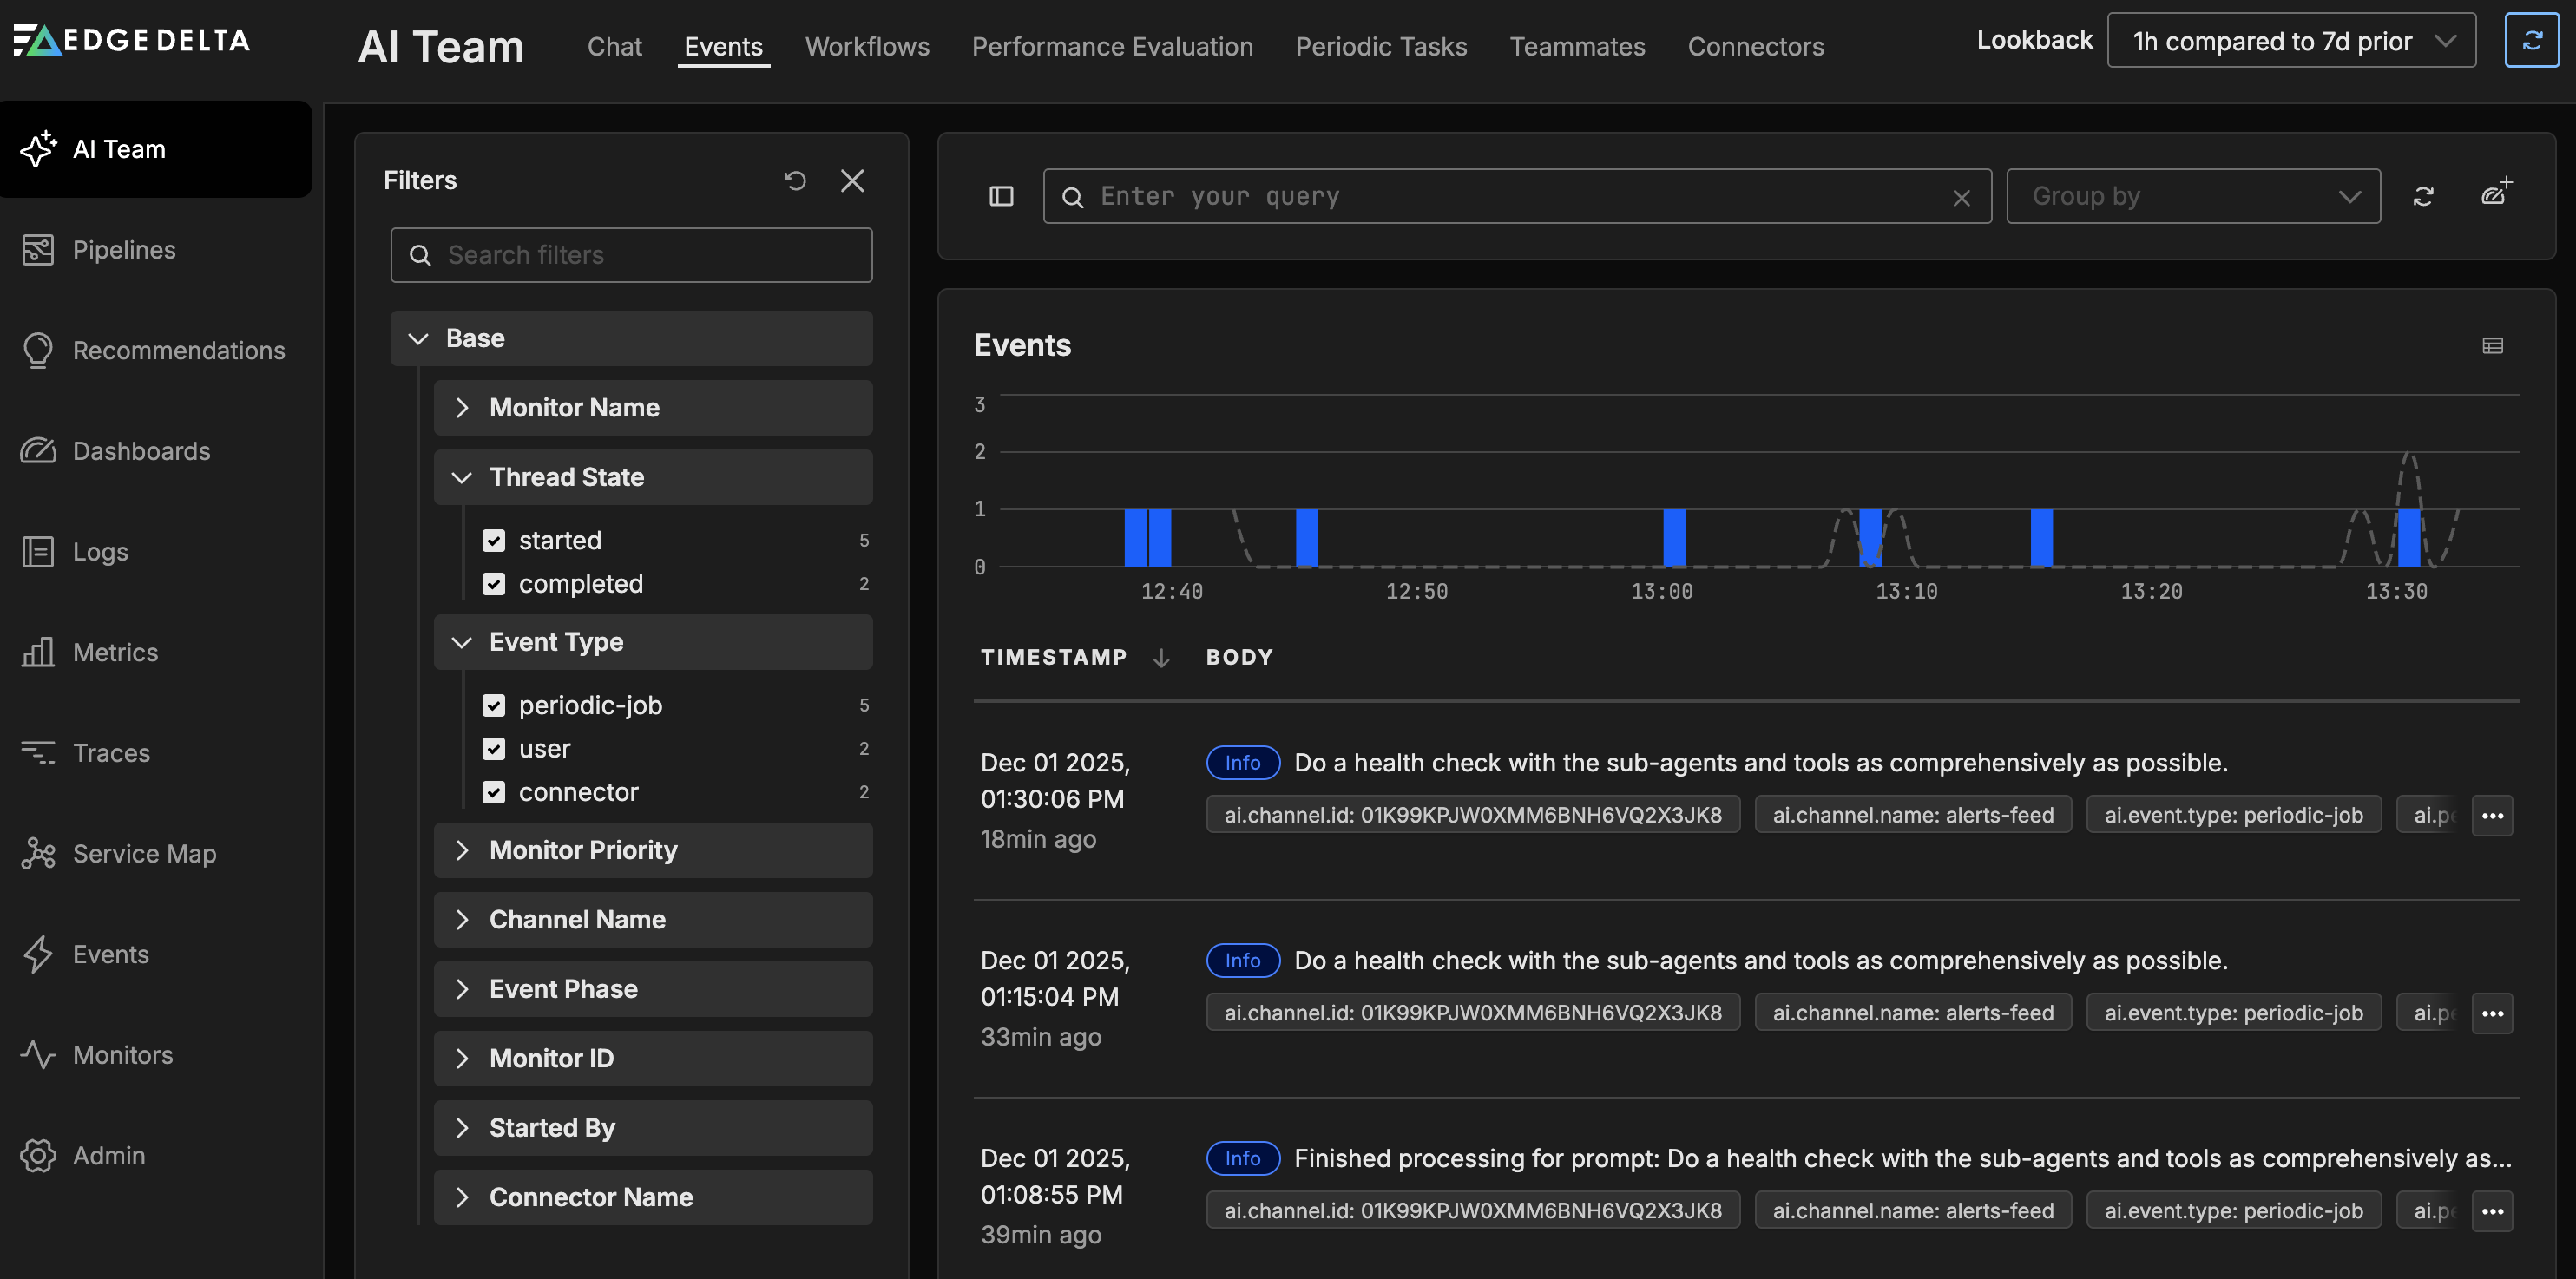
Use events to:
- Filter by monitor, channel, connector, or event type
- Track thread lifecycle and activity patterns
- Validate that monitors and connectors are delivering events correctly
- Investigate incident timelines
Learn more about AI Team events
Building workflows
Workflows let you automate multi-step processes using a drag-and-drop editor. Instead of relying on chat-based orchestration, workflows provide deterministic automation paths that execute based on triggers like monitor alerts, connector events, or scheduled runs. Every organization includes default workflows that cover common patterns like pipeline liveness alerts, synthetic monitor failures, and daily health summaries.
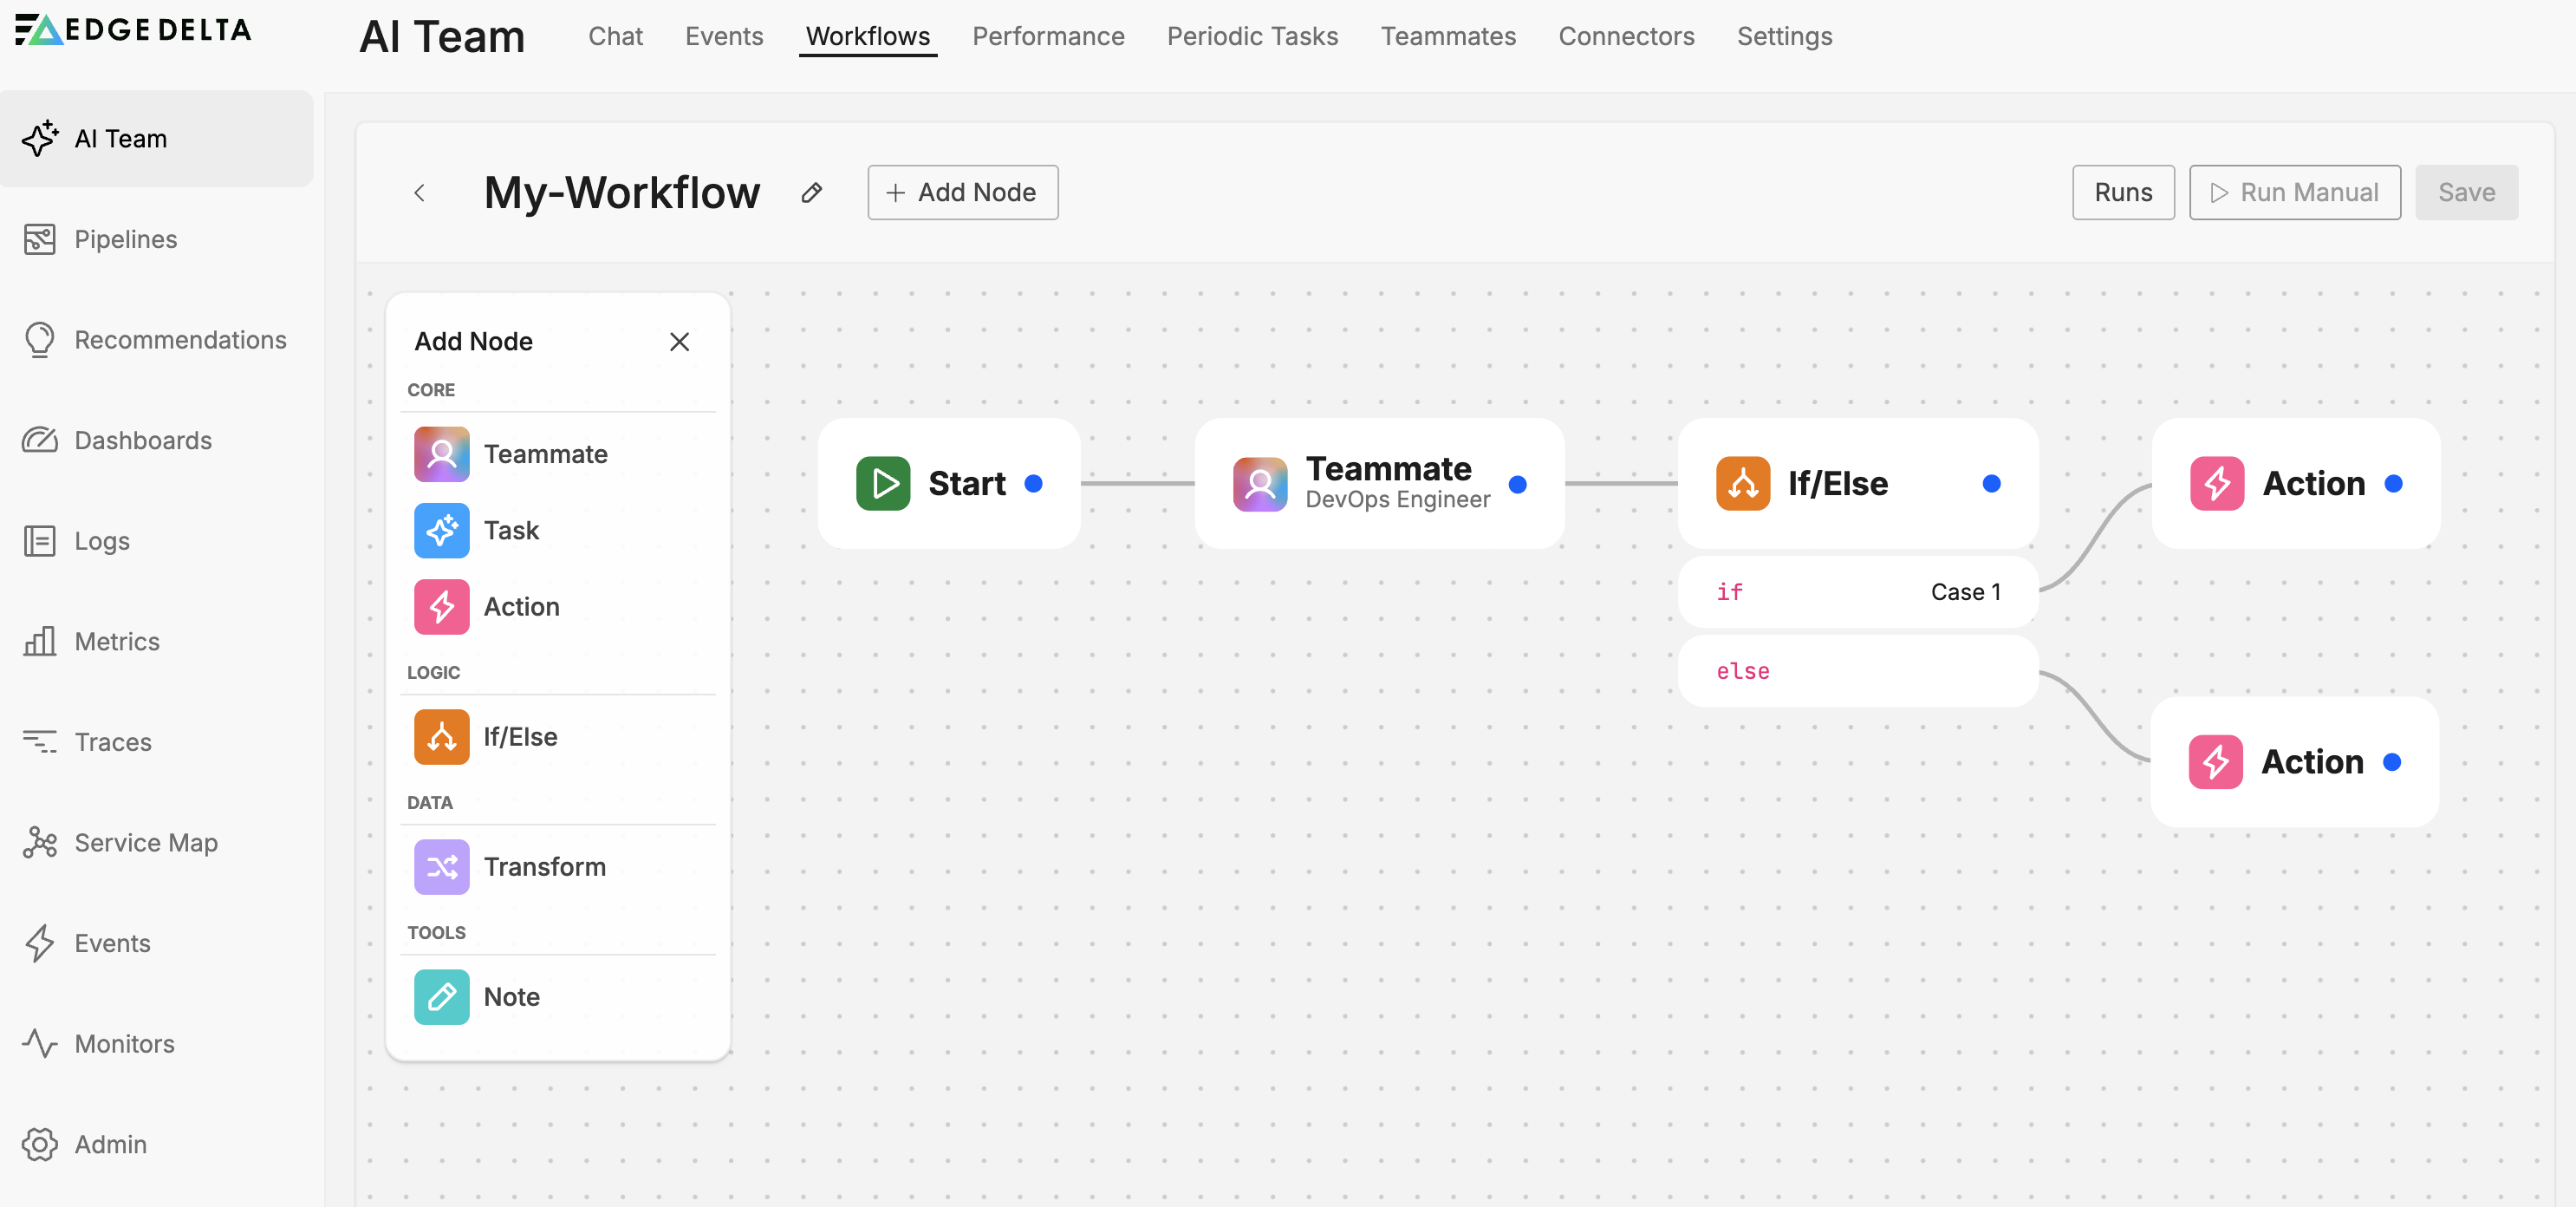
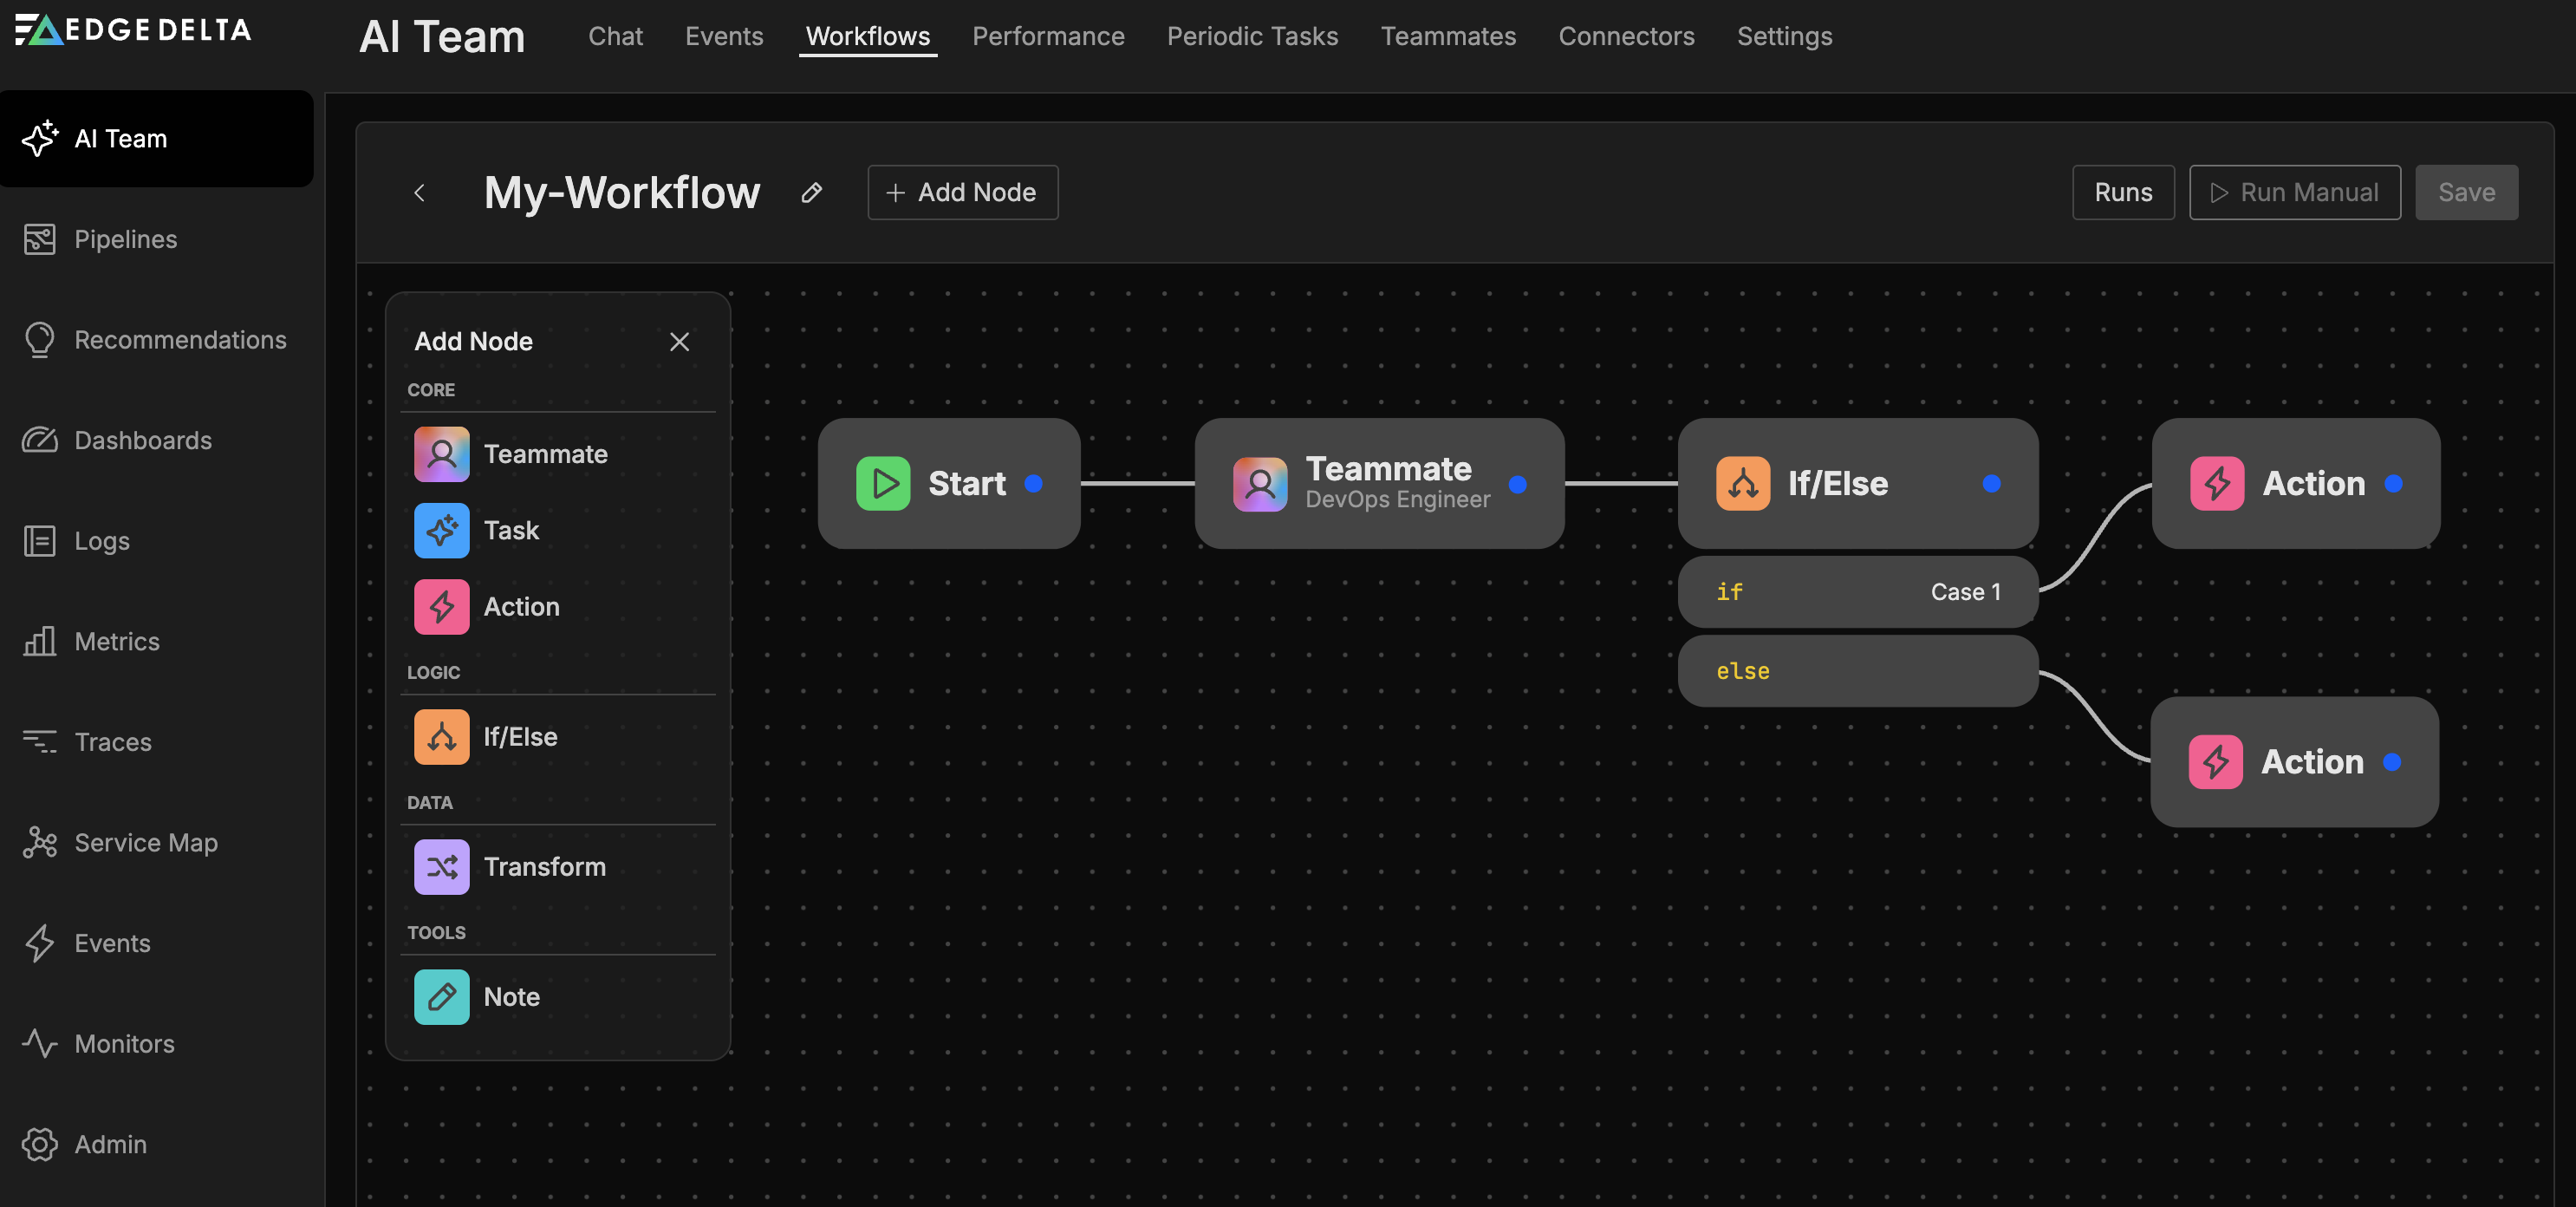
To create a workflow:
- Click the Workflows tab
- Click New Workflow
- Configure the Start node to define your trigger (monitors, connectors, or periodic schedule)
- Add nodes from the palette: Teammate, Task, If/Else, Transform, Action, or Note
- Connect nodes by dragging between their ports
- Save and enable the workflow
Workflows can operate with or without AI teammates, letting you build purely deterministic automations or blend AI reasoning with structured processes.
Monitoring performance
The Performance tab tracks how your AI teammates operate over time, including response times, user ratings, token usage, and interaction counts.
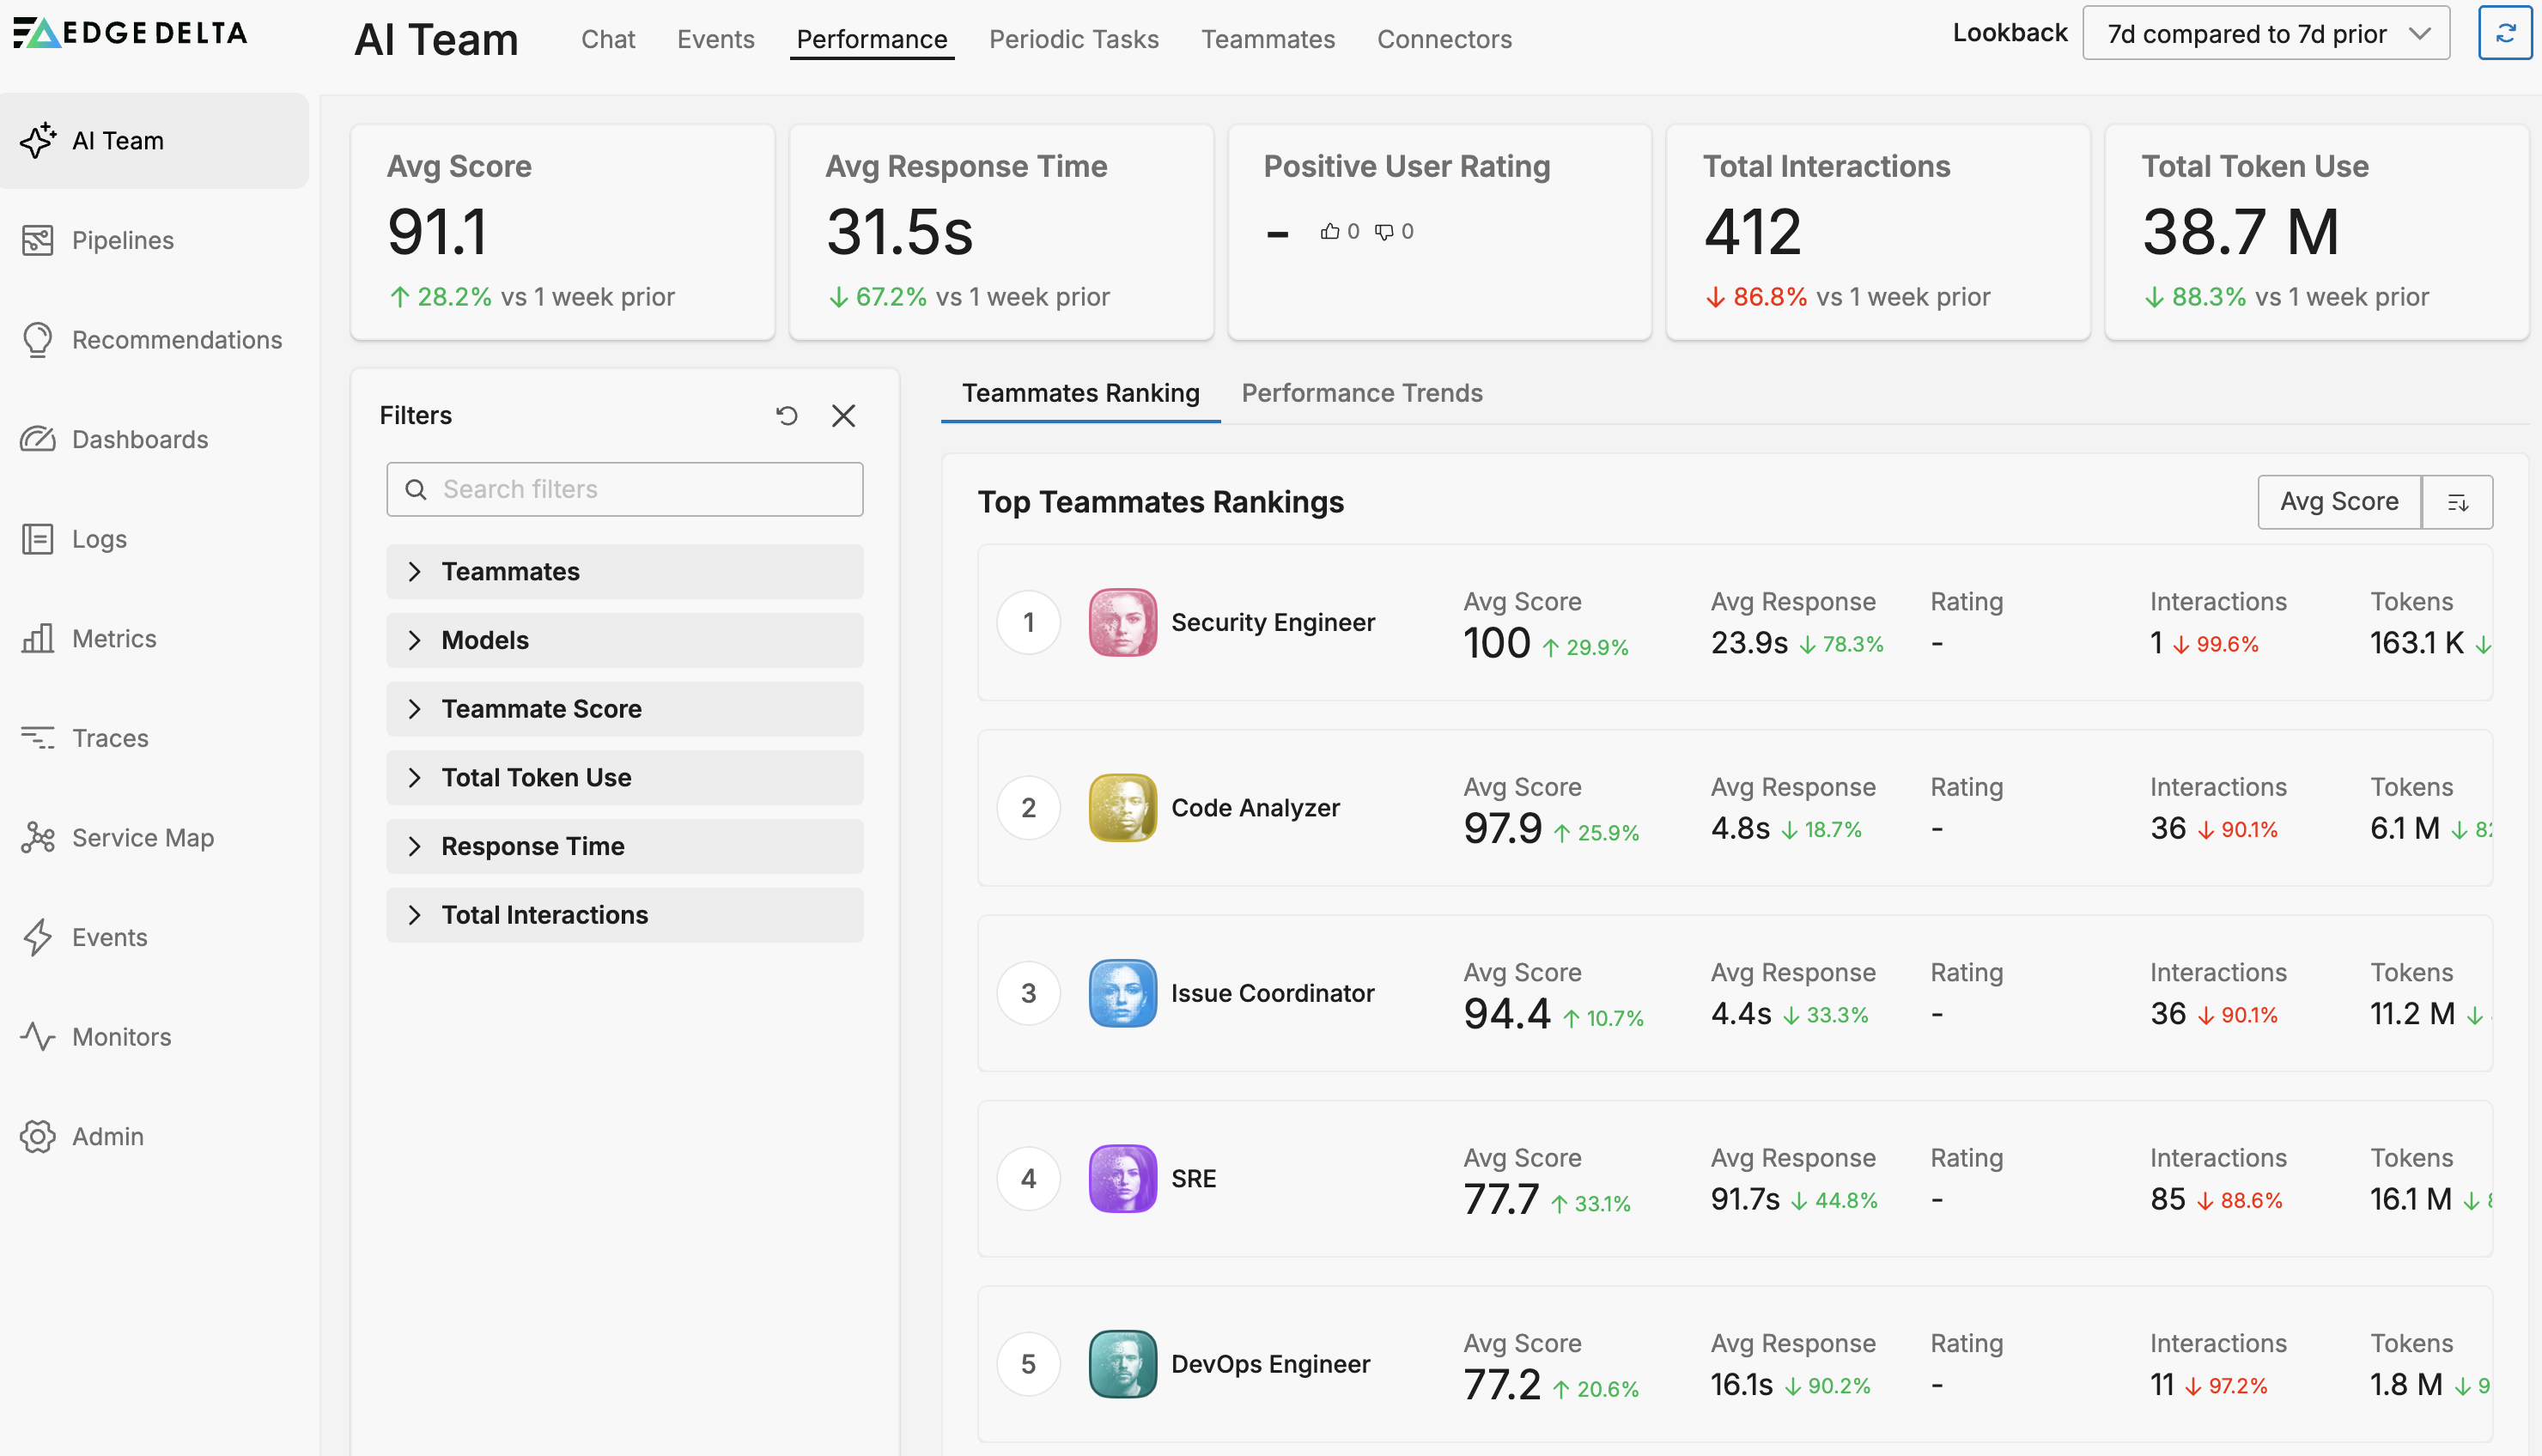
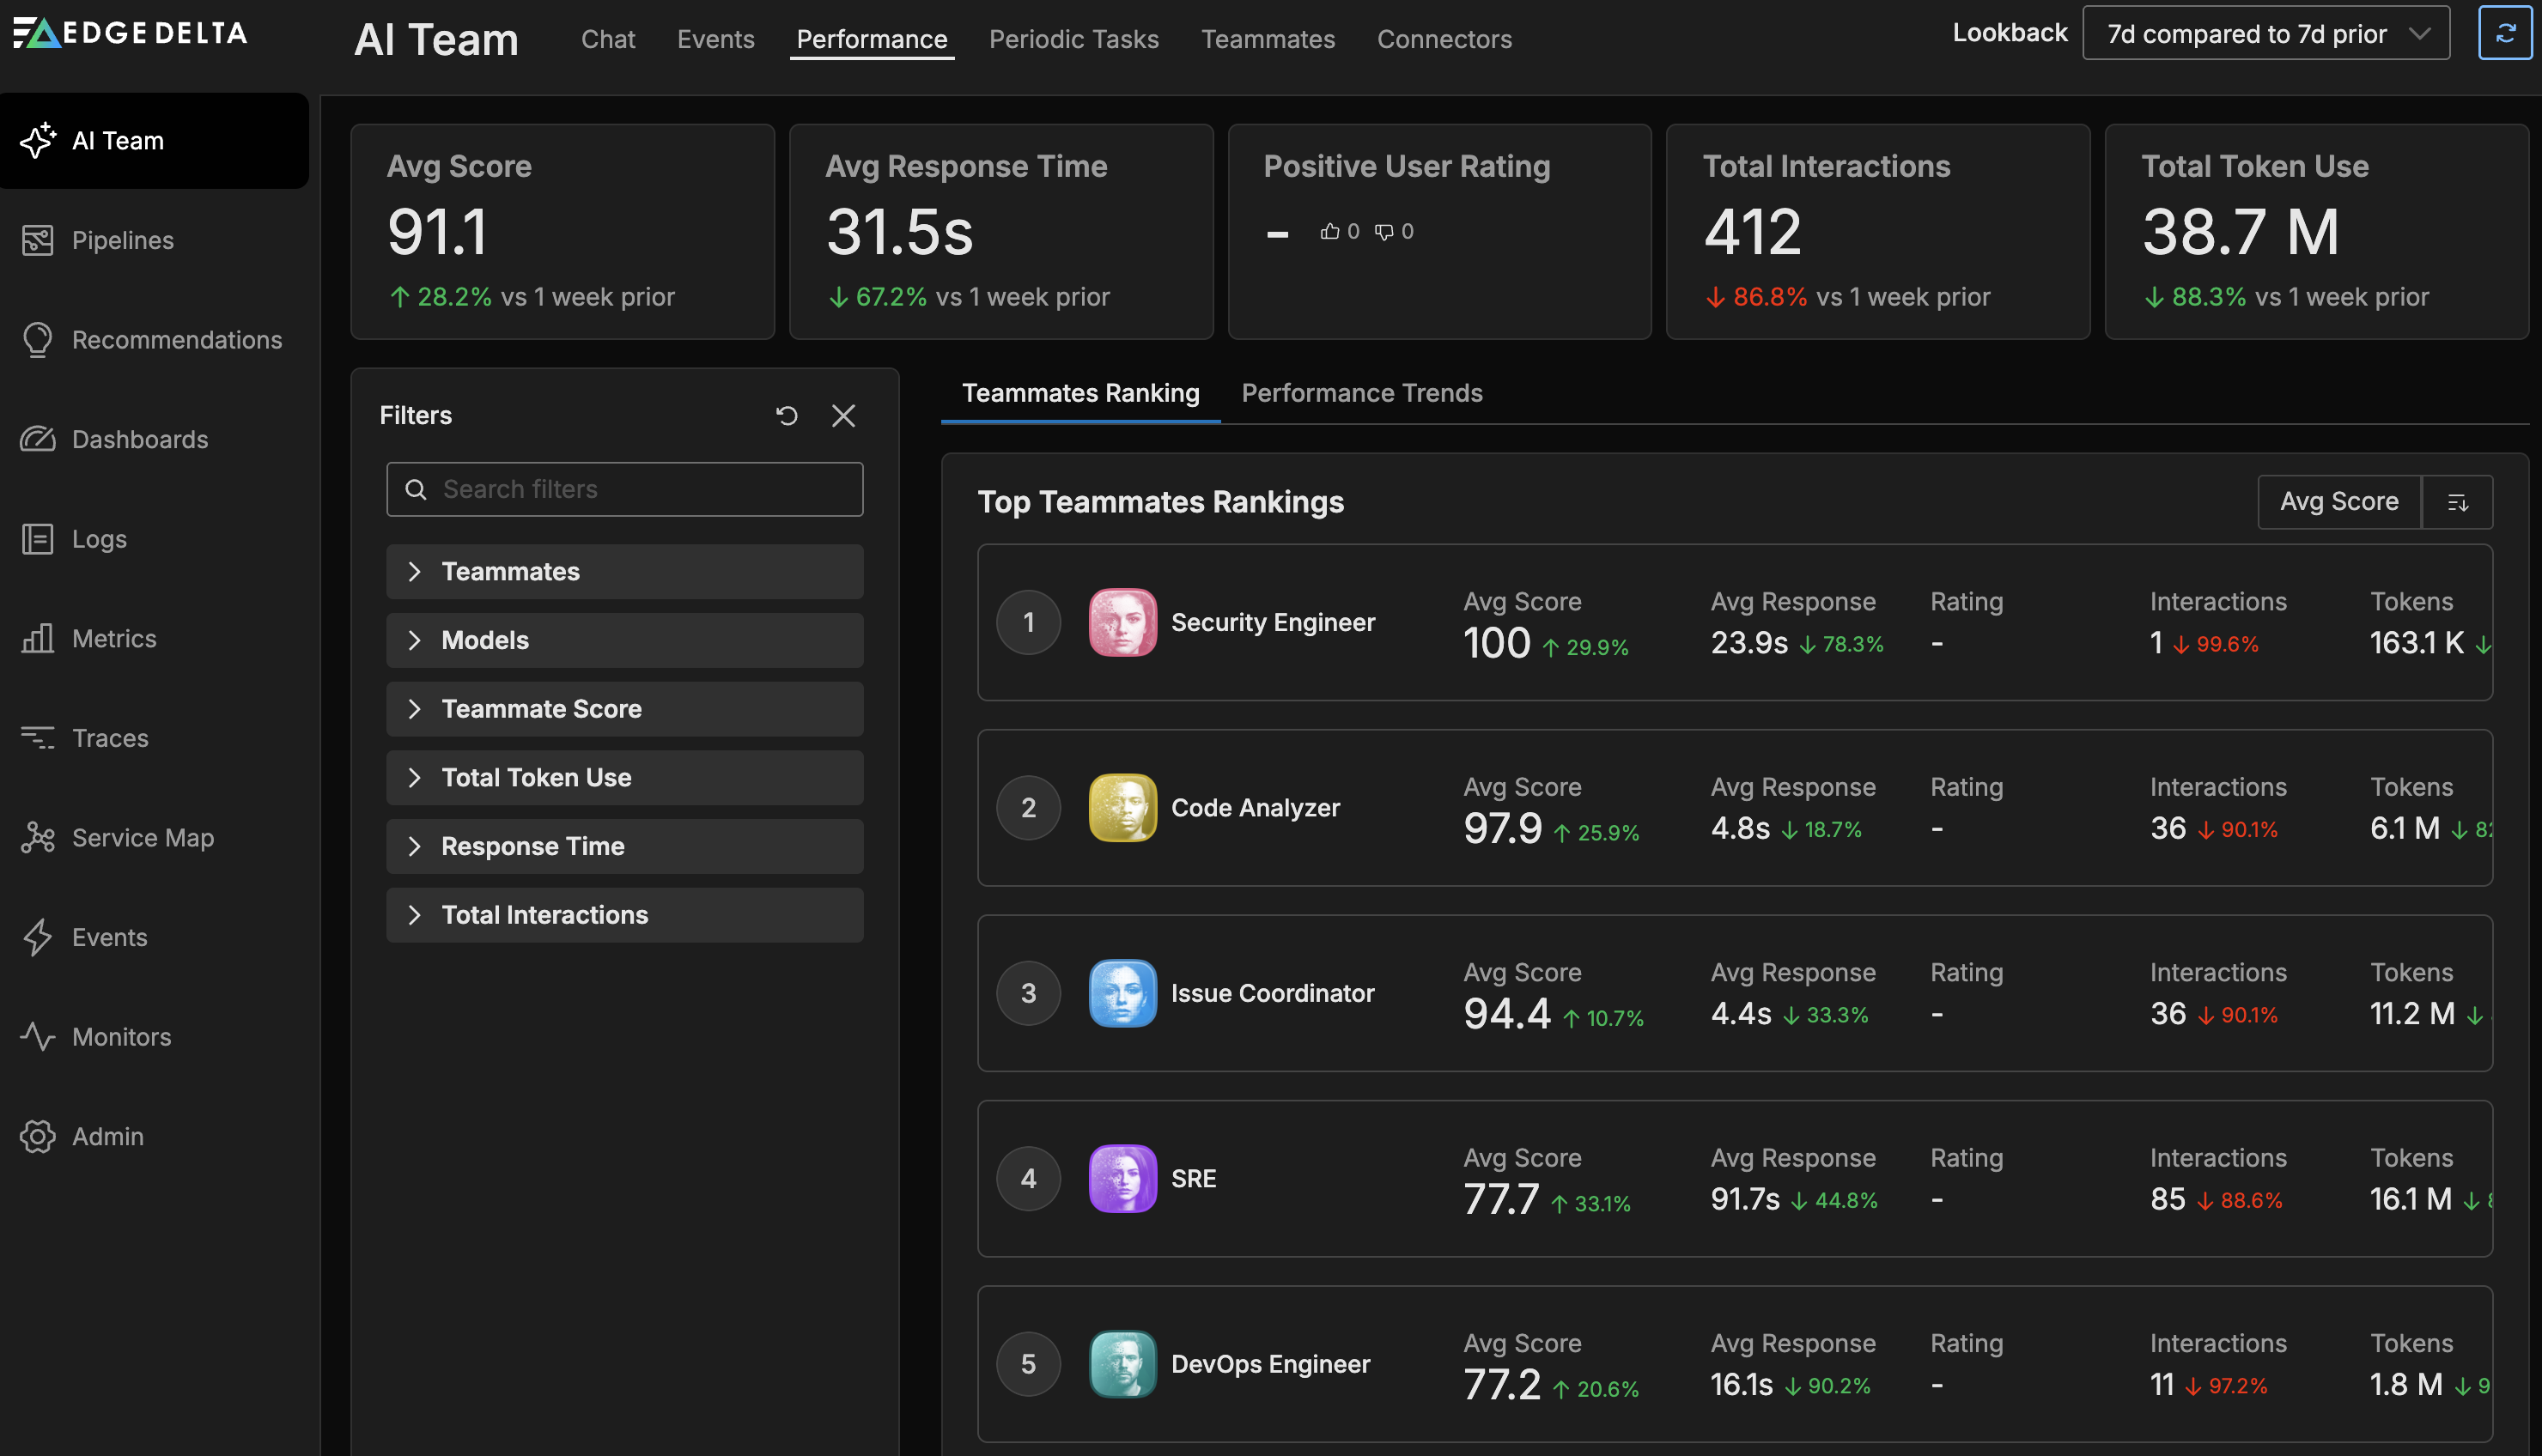
Use performance data to:
- Compare teammates side by side on key metrics
- Identify high-performing teammates and optimization opportunities
- Track trends over time with performance graphs
- Monitor token consumption across your team
Learn more about AI Team performance
Common questions
Q: Do I need a Telemetry Pipeline to use AI Team?
A: Event connectors automatically create and share a single ingestion pipeline called OnCall_AI_Connectors, with each event connector added as a source node. Ingestion pipelines are stateless and require no provisioning. Streaming connectors integrate with your existing pipelines or guide you through creating new ones. While you can use AI Team for general assistance without pipelines, the full analytical power of specialized teammates becomes available once they can access your telemetry data through these pipelines.
Q: What’s the difference between configuring a connector through AI Team vs. creating a pipeline manually? A: AI Team provides a streamlined connector-first workflow that automatically creates an ingestion pipeline for event connectors. Ingestion pipelines are stateless and require no provisioning, making them ideal for event-driven workflows. For streaming connectors, it guides you through adding them to pipelines. This makes AI Team an easier entry point for setting up telemetry pipelines, while still giving you full pipeline control through standard processors and configurations.
Q: Which connectors should I configure first? A: Follow the five steps in this guide. Start with the Kubernetes connector (or your primary telemetry source), then add PagerDuty if you use it for alerting, followed by GitHub or GitLab for code analysis.
Q: Can multiple teammates use the same connector? A: Yes, connectors can be shared across multiple teammates. Configure once, assign to many.
Q: How do I control what data AI teammates can see? A: The pipelines created by AI Team connectors support all standard Edge Delta processors. You can add filters, samplers, masking processors, or any other transformation to control exactly what data reaches the AI teammates. This gives you the same level of control as manually configured pipelines.
Q: What’s the difference between a channel and a direct message? A: Channels are shared spaces where multiple teammates collaborate on a topic and provide organization-wide visibility for all actions. Direct messages let you query individual teammates for read-only insights, analysis, or recommendations. If you need a teammate to make changes to your infrastructure (for example, using MCP to update configurations), you must use a channel to ensure all users in your organization have visibility into those actions.
Q: How do I know which teammate to use? A: Start a thread in any channel. OnCall AI automatically routes your request to the appropriate specialist. As you become familiar with each teammate’s capabilities, you can message them directly in channels or DMs.
Q: Which connectors activate which teammates? A: See the Teammate activation summary above. OnCall AI is always active. Other teammates activate when you connect the relevant data sources.
Troubleshooting
Teammate not responding: Check that connectors required for your question are configured and that you have an active Telemetry Pipeline if querying observability data.
Teammate not appearing in channel: Verify the teammate is assigned to the channel via Channel Settings.
Connector authentication failing: Ensure credentials are current and have necessary permissions. Some connectors require specific scopes or roles.
Pattern Anomaly Monitor shows No Data: The Default Service Anomaly Monitor detects spikes in negative log patterns. If your logs do not contain keywords that match the negative sentiment list in Global Data Settings, no negative patterns are generated and the monitor reports No Data. Verify that your sentiment keywords appear in the log body (not just in attributes) and as standalone whitespace-separated tokens. See Log to Pattern Metric for details on which field is analyzed.
For additional help, visit the Support page or check Troubleshooting.