Grafana Connector
Configure the Grafana connector to enable AI Team members to query dashboards, metrics, and alerts to pull observability context and correlate signals during incident investigations.
7 minute read
Overview
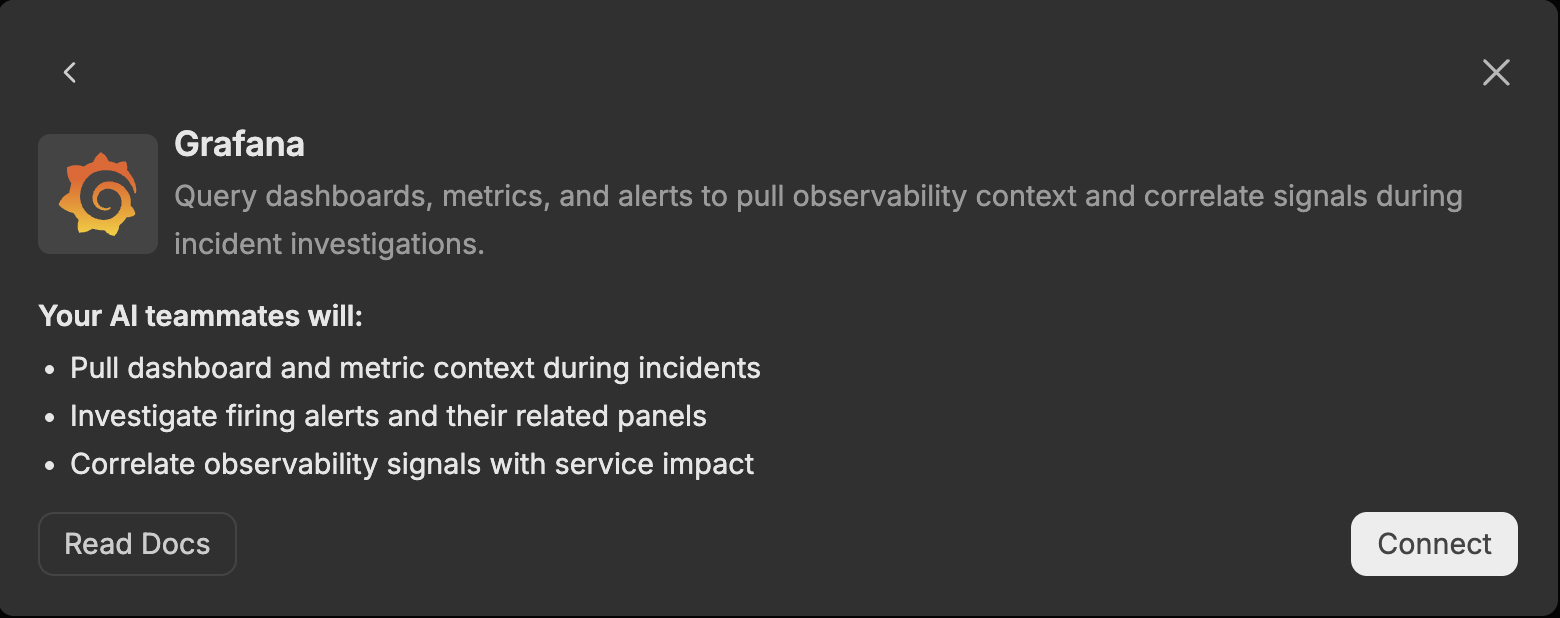
The Grafana connector enables AI Team members to query Grafana dashboards, metrics, and alerts to pull observability context and correlate signals during incident investigations. By connecting Grafana to AI Team, AI teammates can search dashboards, run datasource queries, inspect panels, and investigate firing alerts.
The connector provides access to dashboards, datasources (such as Prometheus, Loki, and CloudWatch), alert rules, incidents, and on-call schedules, making observability data queryable through natural language interactions with AI teammates. This integration helps teams accelerate incident investigation, correlate observability signals with service impact, and understand the context behind firing alerts.
Add the Grafana Connector
To add the Grafana connector, you provide your Grafana server URL and authenticate with either a service account token or a username and password.
Prerequisites
Before configuring the Grafana connector, ensure you have:
- A Grafana instance reachable from Edge Delta. For self-hosted instances, the URL must be publicly accessible and start with a protocol (for example,
http://grafana.example.comorhttps://grafana.mycompany.info). For Grafana Cloud instances, the URL looks likehttps://myinstance.grafana.net. - Credentials for one of the supported authentication methods:
- A Grafana service account token (recommended), or
- A Grafana username and password
- Network connectivity from Edge Delta to the Grafana API
Configuration Steps
- Navigate to AI Team > Connectors in the Edge Delta application
- Find the Grafana connector
- Click the Connect button
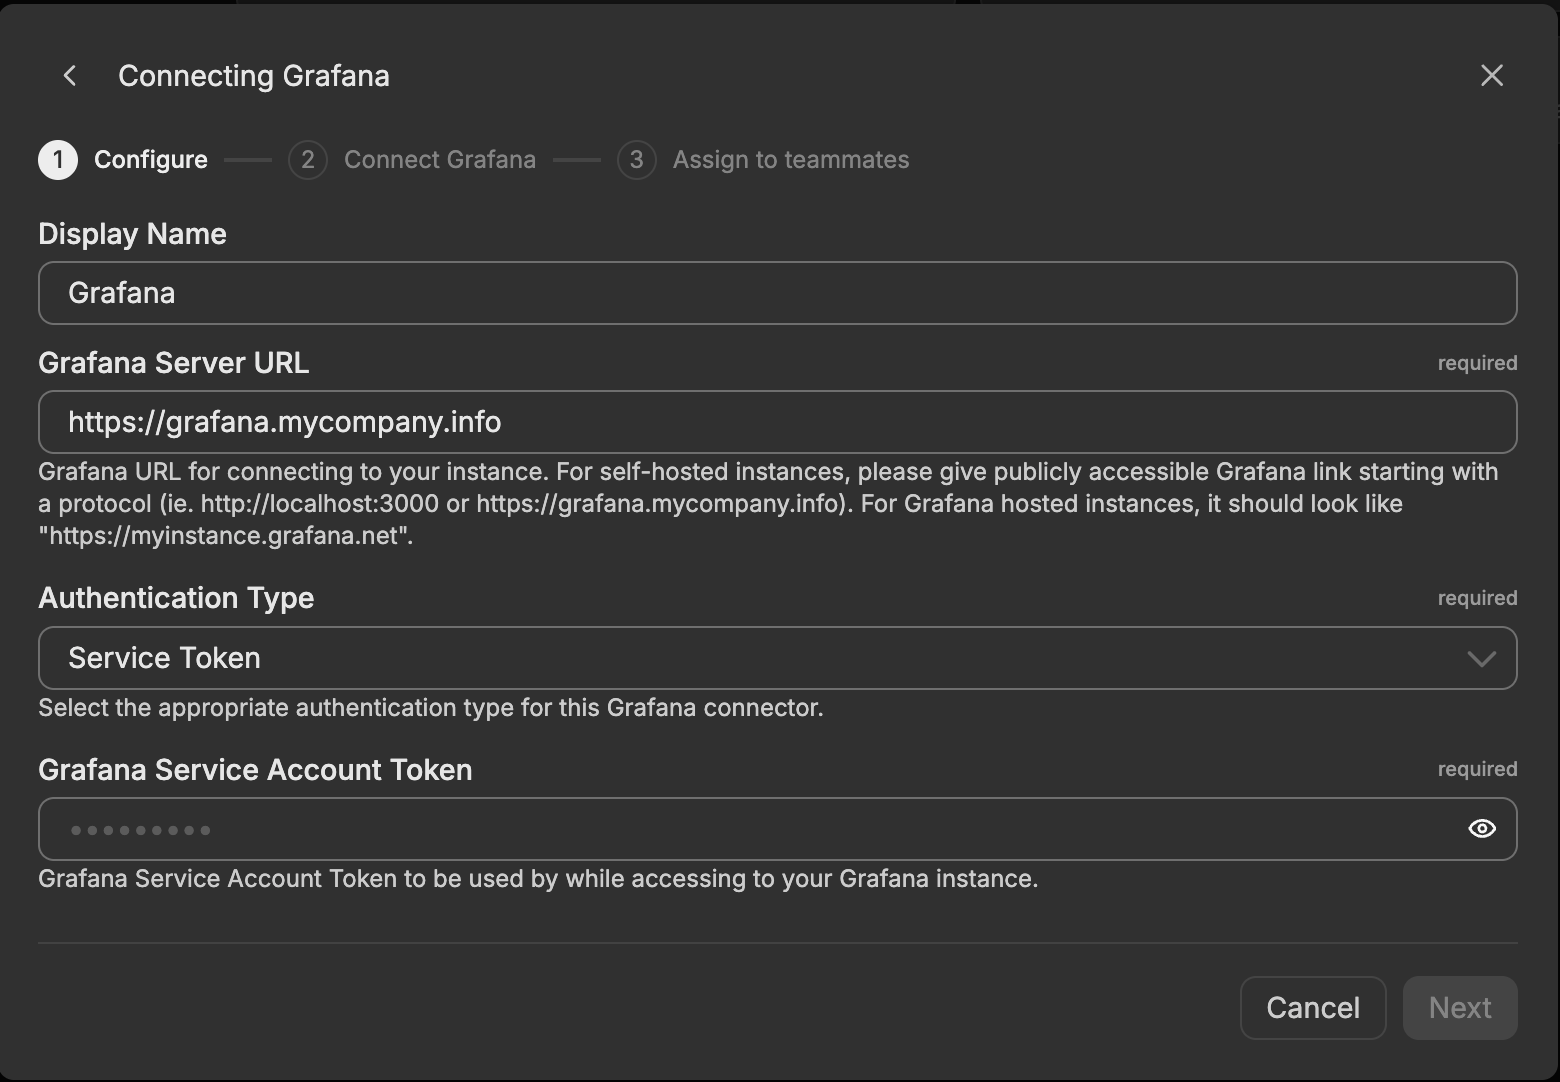
- Configure the options (see below)
- Click Next to initiate the connector onboarding flow
The connector is now available for use by AI Team members who have been assigned this connector.
Configuration Options
Display Name
Name to identify this Grafana connector instance. Choose a descriptive name like “Grafana Production” to differentiate it from other connectors.
Grafana Server URL
Grafana URL for connecting to your instance. For self-hosted instances, provide a publicly accessible Grafana link starting with a protocol (for example, http://grafana.example.com or https://grafana.mycompany.info). For Grafana Cloud hosted instances, it should look like https://myinstance.grafana.net.
Authentication Type
Select the appropriate authentication type for this Grafana connector:
- Service Token (default): Authenticate using a Grafana service account token.
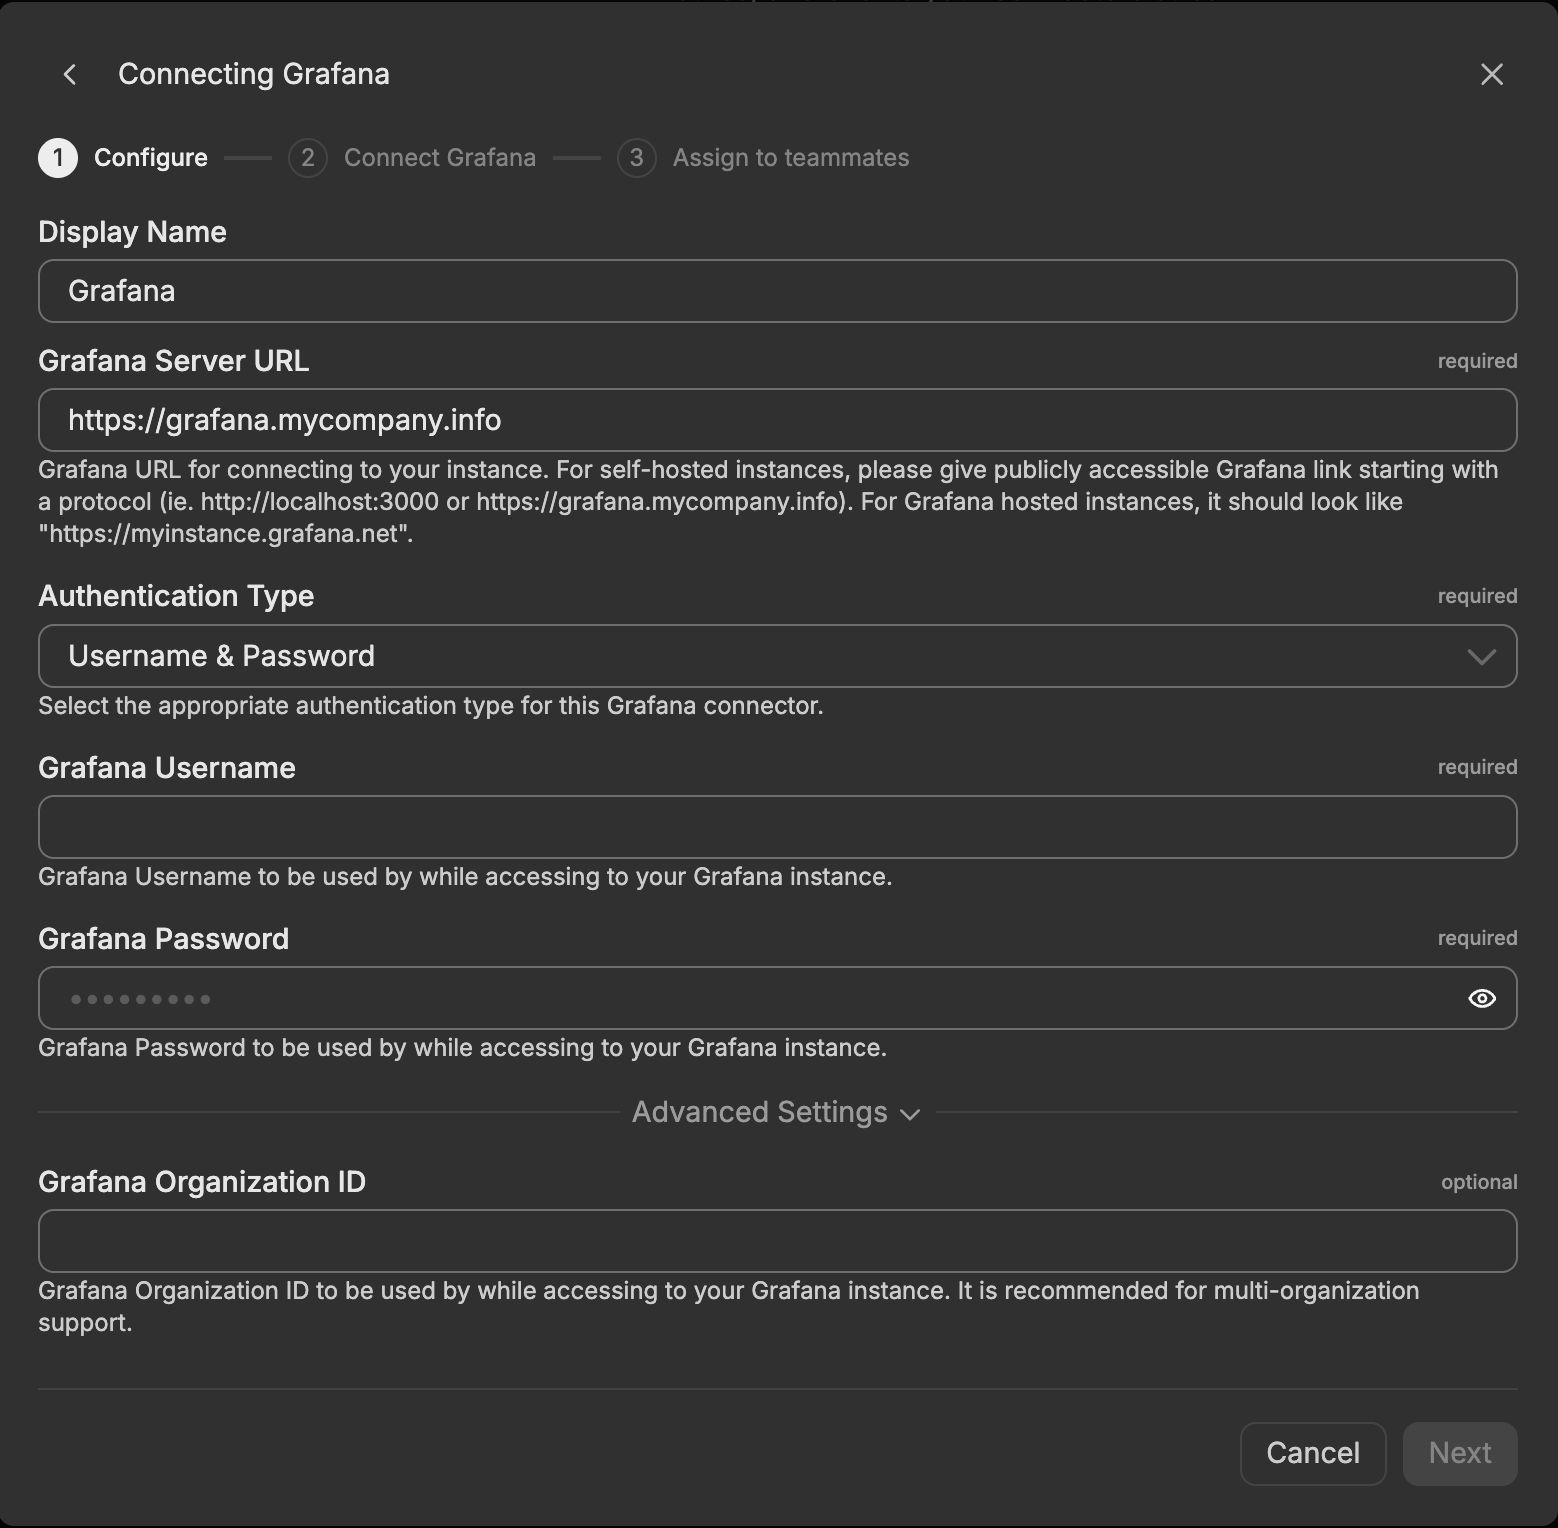
- Username & Password: Authenticate using a Grafana username and password.
Grafana Service Account Token
Required when the authentication type is Service Token. The Grafana service account token is used while accessing your Grafana instance.
To create a service account token, log into Grafana, navigate to Administration > Users and access > Service accounts, create a service account with the permissions your tools need, and then add a token to it. Copy the token value when it is displayed, since it cannot be retrieved again afterward.
Grafana Username
Required when the authentication type is Username & Password. The Grafana username is used while accessing your Grafana instance.
Grafana Password
Required when the authentication type is Username & Password. The Grafana password is used while accessing your Grafana instance.
Grafana Organization ID
Optional and available under advanced options when the authentication type is Username & Password. The Grafana Organization ID is used while accessing your Grafana instance and is recommended for multi-organization support.
Tools
The Grafana connector exposes the following tools, grouped by category. Available tools depend on the datasources, plugins, and features enabled in your Grafana instance.
Search
search_dashboards
Searches for dashboards.
search_folders
Searches for folders by query string.
Dashboards
get_dashboard_by_uid
Gets a dashboard by UID.
update_dashboard
Updates an existing dashboard or creates a new one.
get_dashboard_panel_queries
Extracts panel titles, queries, and datasource details from a dashboard.
get_dashboard_property
Extracts specific parts of a dashboard using a JSONPath expression.
get_dashboard_summary
Retrieves a compact dashboard overview without the full JSON.
create_folder
Creates a Grafana folder with a title and optional UID.
Datasources
list_datasources
Lists datasources.
get_datasource
Gets a datasource by UID or name.
get_query_examples
Gets example queries for a datasource type.
run_panel_query
Executes one or more dashboard panel queries.
Prometheus
query_prometheus
Executes queries against Prometheus datasources.
list_prometheus_metric_metadata
Lists metric metadata.
list_prometheus_metric_names
Lists available metric names.
list_prometheus_label_names
Lists label names matching a selector.
list_prometheus_label_values
Lists values for a specific label.
query_prometheus_histogram
Calculates histogram percentile values.
Loki
query_loki_logs
Queries and retrieves logs using LogQL.
list_loki_label_names
Lists all available label names in logs.
list_loki_label_values
Lists values for a specific log label.
query_loki_stats
Gets statistics about log streams.
query_loki_patterns
Identifies common log structure patterns.
Alerting
alerting_manage_rules
Manages alert rules (list, create, update, delete).
alerting_manage_routing
Manages notification policies and contact points.
Incidents
list_incidents
Lists incidents in Grafana Incident.
create_incident
Creates an incident in Grafana Incident.
add_activity_to_incident
Adds activity items to an incident.
get_incident
Gets a single incident by ID.
OnCall
list_oncall_schedules
Lists schedules from Grafana OnCall.
get_oncall_shift
Retrieves details about a specific OnCall shift.
get_current_oncall_users
Identifies users currently on call.
list_oncall_teams
Lists teams from Grafana OnCall.
list_oncall_users
Lists users from Grafana OnCall.
list_alert_groups
Lists alert groups with filtering.
get_alert_group
Gets a specific alert group from Grafana OnCall by its ID.
Sift
list_sift_investigations
Retrieves a list of Sift investigations.
get_sift_investigation
Retrieves a Sift investigation by UUID.
get_sift_analysis
Retrieves a specific analysis from an investigation.
find_error_pattern_logs
Identifies elevated error patterns in Loki logs.
find_slow_requests
Detects slow requests from Tempo datasources.
Additional Datasources
query_influxdb
Queries InfluxDB using InfluxQL (v1) or Flux (v2).
list_clickhouse_tables
Lists tables in a ClickHouse database.
describe_clickhouse_table
Gets a ClickHouse table schema with column types.
query_clickhouse
Executes ClickHouse SQL queries with macro substitution.
list_cloudwatch_namespaces
Lists available AWS CloudWatch namespaces.
list_cloudwatch_metrics
Lists metrics in a CloudWatch namespace.
list_cloudwatch_dimensions
Lists dimensions for a CloudWatch metric.
query_cloudwatch
Executes CloudWatch metric queries.
query_elasticsearch
Queries Elasticsearch using Lucene or DSL syntax.
list_snowflake_tables
Lists Snowflake tables via INFORMATION_SCHEMA.
describe_snowflake_table
Retrieves Snowflake table schemas with column details.
query_snowflake
Executes Snowflake SQL queries with macro and variable substitution.
Pyroscope
list_pyroscope_label_names
Lists label names matching a selector.
list_pyroscope_label_values
Lists label values for specific labels.
list_pyroscope_profile_types
Lists available profile types.
query_pyroscope
Queries profiles, metrics, or both from Pyroscope.
Annotations
get_annotations
Fetches annotations with filters.
create_annotation
Creates new annotations in standard or Graphite format.
update_annotation
Performs partial updates to annotation fields.
get_annotation_tags
Lists annotation tags with optional filtering.
Administration
list_teams
Lists all teams.
list_users_by_org
Lists all users in an organization.
list_all_roles
Lists all Grafana roles.
get_role_details
Gets details for a Grafana role.
get_role_assignments
Lists assignments for a role.
list_user_roles
Lists roles for users.
list_team_roles
Lists roles for teams.
get_resource_permissions
Lists permissions for a resource.
get_resource_description
Describes a Grafana resource type.
Other
get_assertions
Gets an assertion summary for a given entity.
generate_deeplink
Generates accurate deeplink URLs for Grafana resources.
get_panel_image
Renders dashboards or panels as PNG images.
list_provisioning_repositories
Lists git-sync sources with sync status.
validate_provisioning_file
Validates provisioning files before application.
How to Use the Grafana Connector
The Grafana connector integrates with AI Team, enabling AI teammates to query observability data based on natural language queries. Once configured, AI teammates can pull dashboard and metric context, investigate firing alerts, and correlate signals during incident investigations.
Use Case: Pull Dashboard and Metric Context During Incidents
When an incident begins, AI teammates search for relevant dashboards, extract the panel queries behind them, and run those queries against the underlying datasources (such as Prometheus and Loki). This gives responders the same metric and log context that on-call engineers would gather manually, but in seconds and summarized in natural language.
Use Case: Investigate Firing Alerts and Their Related Panels
AI teammates list active alert rules and alert groups, identify which alerts are firing, and trace each alert back to the dashboards and panels that visualize the affected metrics. By inspecting the queries and recent values behind those panels, teammates explain why an alert fired and surface the supporting evidence.
Use Case: Correlate Observability Signals with Service Impact
AI teammates query metrics, logs, and traces across multiple datasources and correlate them to determine whether an observability signal reflects real service impact. By combining Prometheus metrics, Loki logs, and Sift investigations, teammates distinguish noisy or transient signals from genuine degradations and help prioritize the response.
Troubleshooting
Connection errors: Verify your Grafana Server URL is correct and publicly accessible, including the protocol (http:// or https://). Check that firewall rules allow outbound traffic from Edge Delta to the Grafana API.
Authentication errors: For service token authentication, verify that the service account token is valid and has not been revoked, and that the service account has the permissions required for the tools you want to use. For username and password authentication, verify the credentials and, for multi-organization instances, confirm the Grafana Organization ID is set correctly.
Missing data: Verify that the authenticated service account or user has access to the dashboards, datasources, and folders you are trying to query. Some tools depend on specific datasources, plugins, or features (such as Grafana Incident, OnCall, or Sift) being enabled in your Grafana instance.
Next Steps
- Learn about creating custom teammates that can use this connector
- Explore other connectors to integrate additional tools
For additional help, visit AI Team Support.