Platform Overview
2 minute read
The Edge Delta platform provides tools for exploring your telemetry data, building dashboards, configuring alerts, and managing your observability workflows. This section covers all platform features and how to use them effectively.
AI Team
AI Team is Edge Delta’s flagship feature that transforms how you interact with your observability data. Instead of manually searching logs and correlating events, AI teammates autonomously investigate incidents, analyze patterns, and surface insights in natural language.
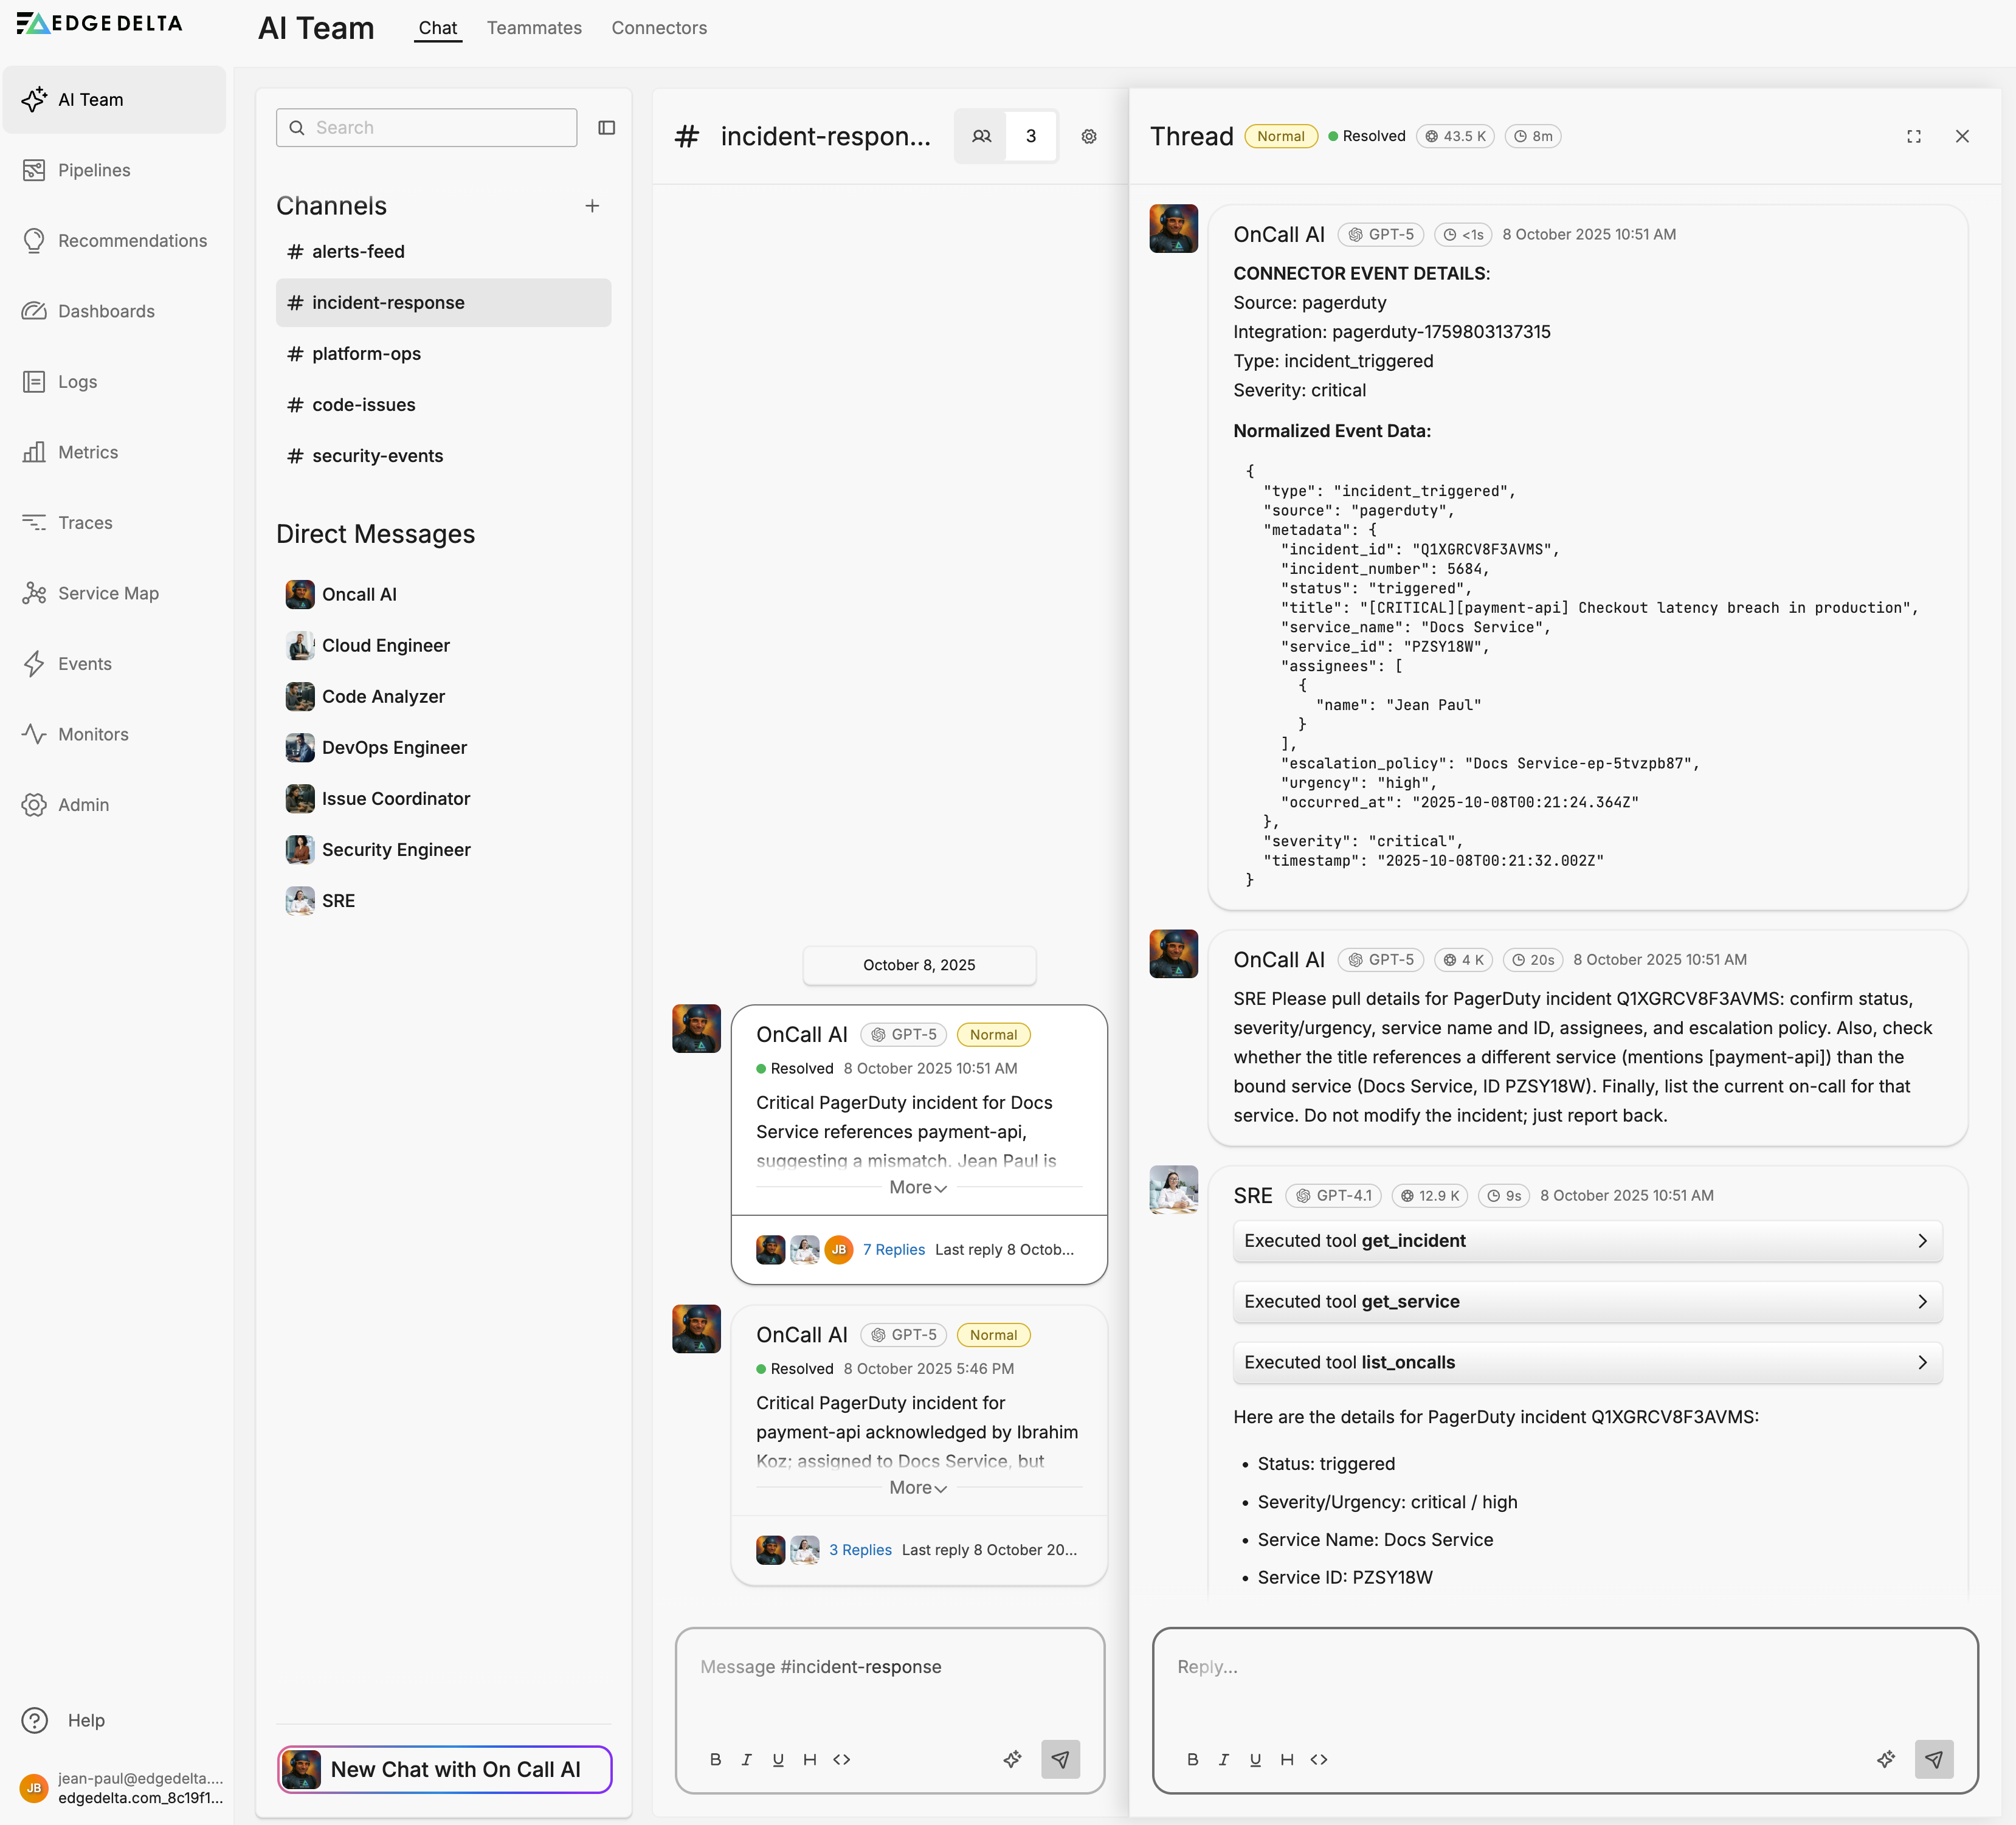
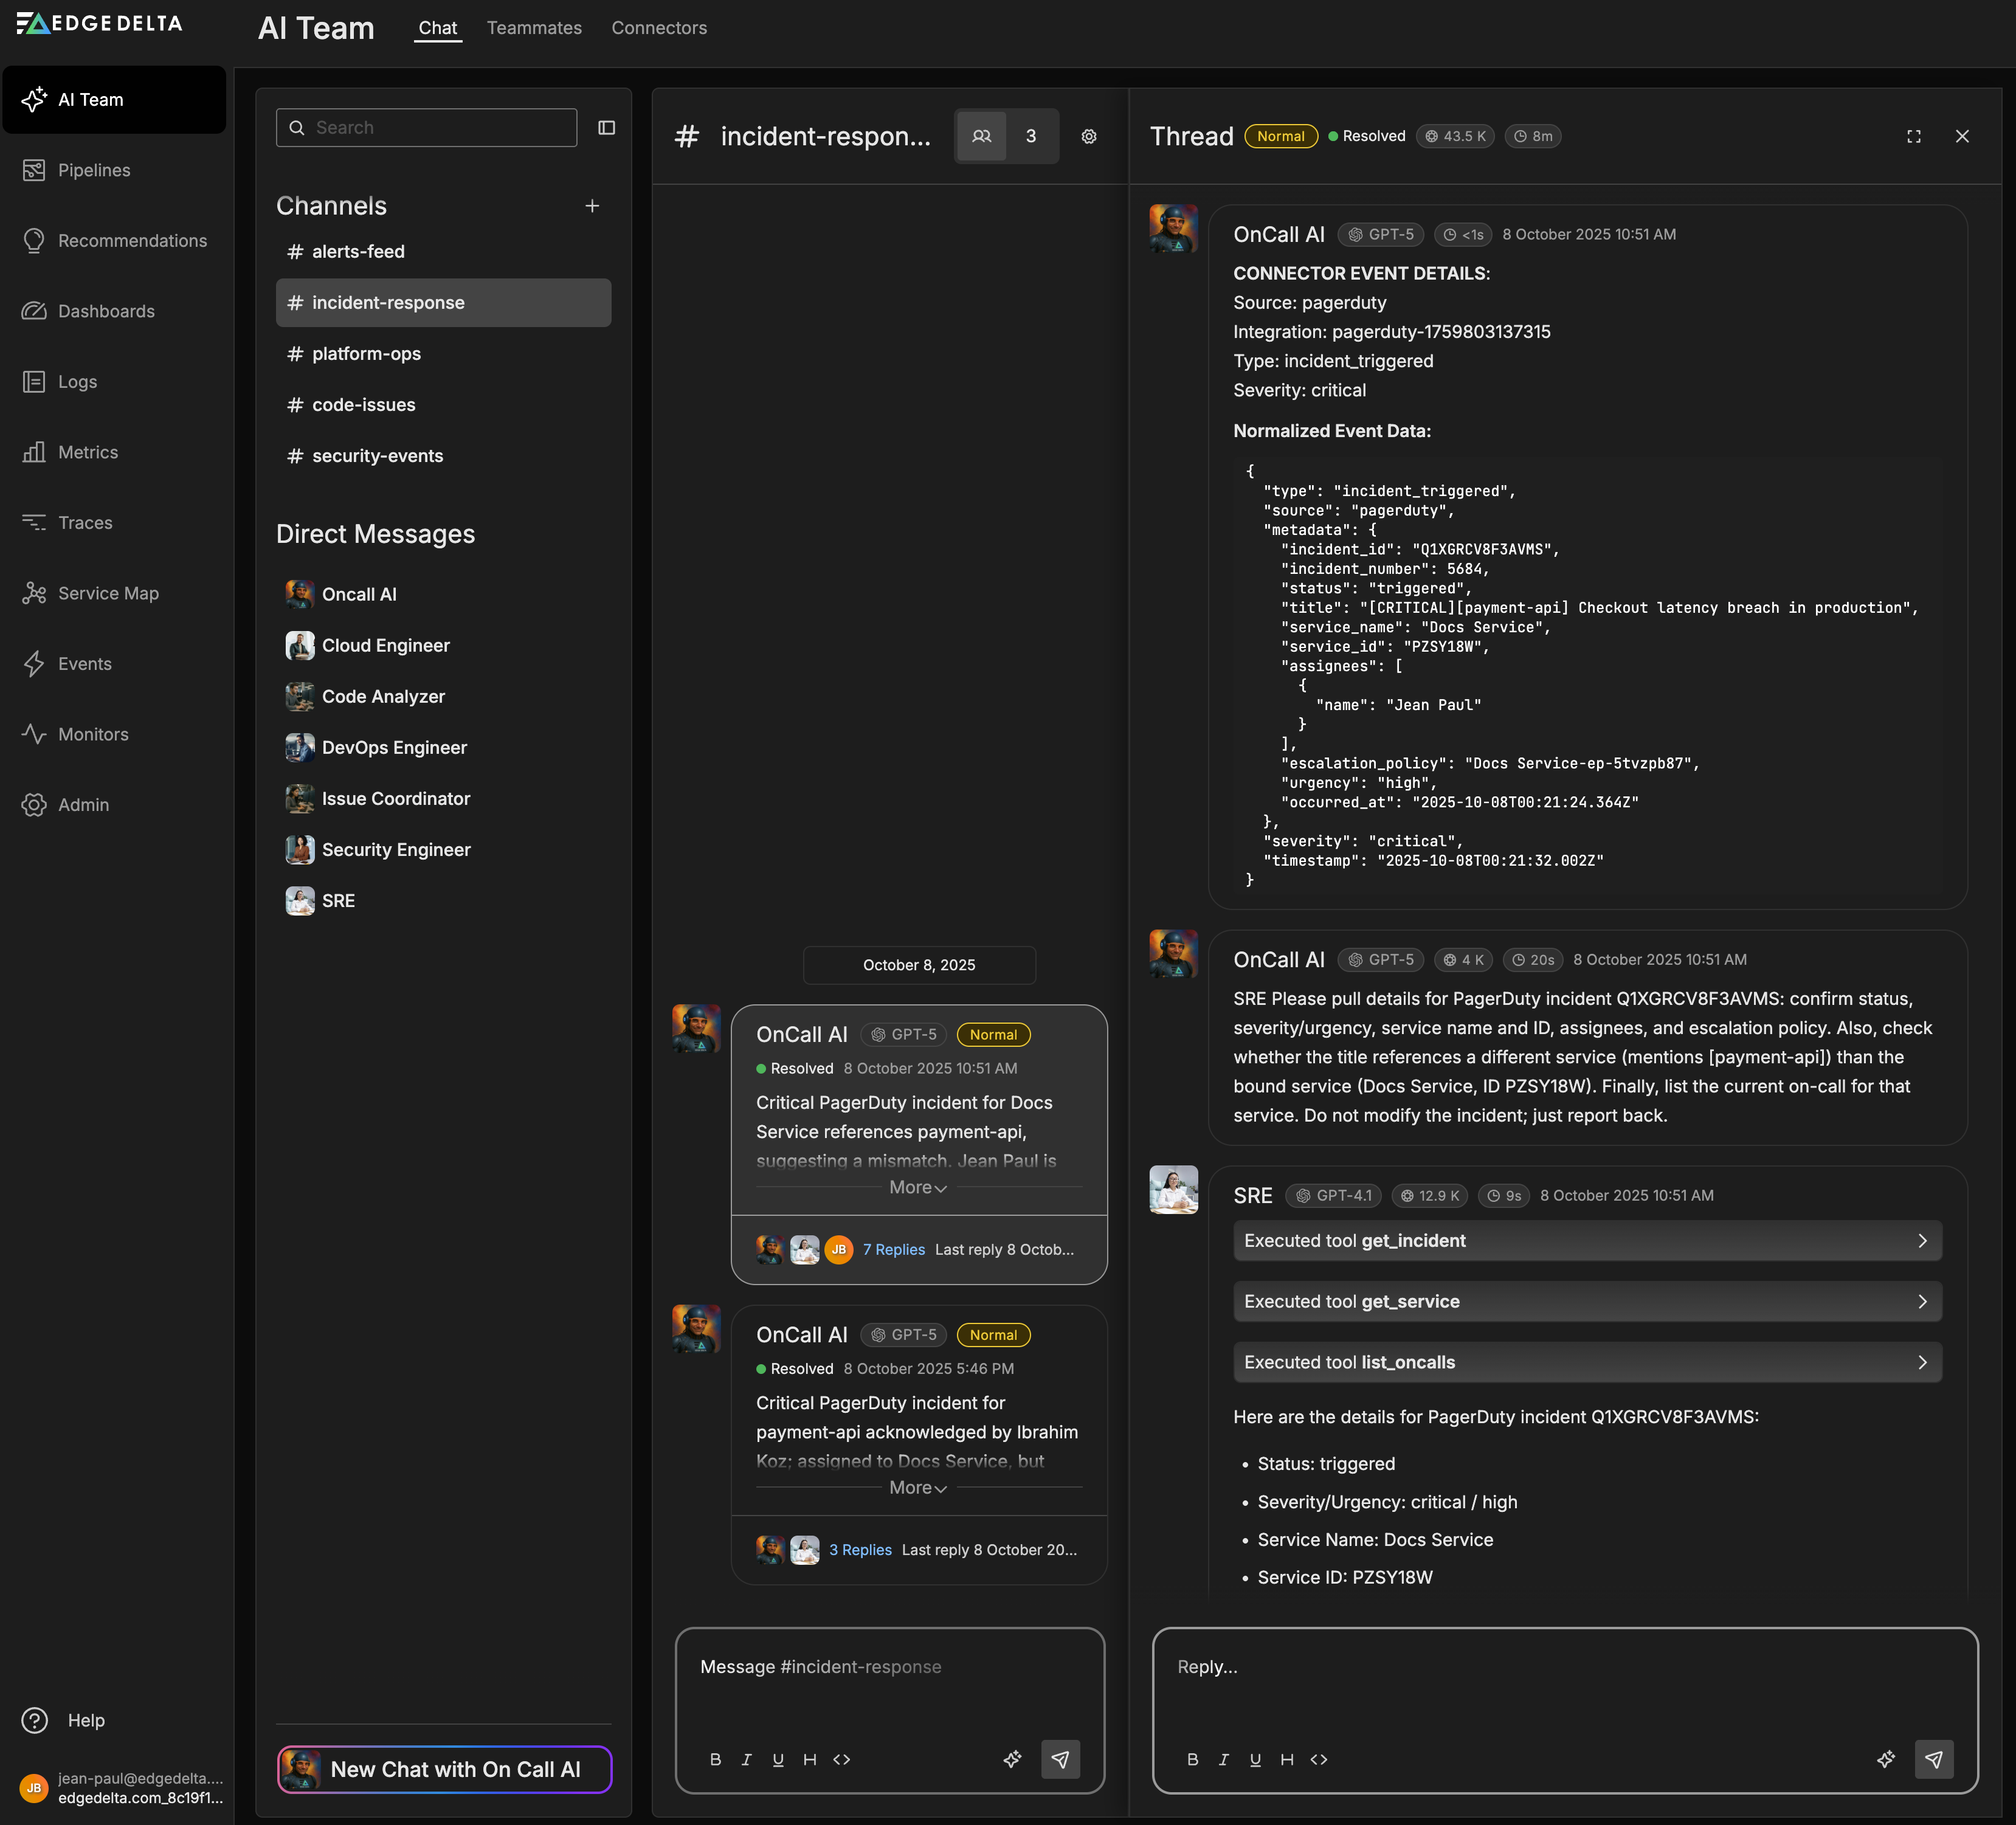
AI Team connects to your existing tools like PagerDuty, Slack, and GitHub through Connectors, enabling teammates to respond to alerts, investigate root causes, and communicate findings directly in your workflow.
Get started with AI Team | Configure Connectors
Signal Exploration
Explore and analyze your telemetry data across all signal types:
- Logs - Search, filter, and analyze log data using CQL
- Metrics - Query and visualize metric data in the Metrics Explorer
- Traces - Explore distributed traces and service dependencies
- Events - Monitor Kubernetes events and alert-generated events
- Service Map - Visualize service interconnections and dependencies
Visualization and Alerting
Build custom views and stay informed about system health:
- Dashboards - Create and share custom dashboards with flexible widgets
- Monitors - Configure centralized monitors with notifications
- Pipeline Triggers - Configure edge-based alerts within pipelines
Configuration and Automation
Streamline your observability setup:
- Packs - Pre-built, reusable pipeline configurations for common use cases
- Recommendations - AI-powered suggestions to optimize your pipelines
- Rehydrations - Restore archived data for incident investigation and compliance