HTTP Pull Connector
Configure the HTTP Pull connector to periodically fetch data from REST APIs and HTTP endpoints with support for dynamic parameters, pagination, and authentication.
13 minute read
Overview
The HTTP Pull connector periodically fetches data from HTTP and HTTPS REST API endpoints. It polls external APIs at regular intervals to collect metrics, status information, configuration data, and telemetry. Content streams into Edge Delta Pipelines for analysis by AI teammates through the Edge Delta MCP connector.
The connector supports dynamic configuration through OTTL expressions, automatic pagination handling, flexible authentication, and configurable retry logic, enabling integration with virtually any REST API.
When you add this streaming connector, it appears as a HTTP Pull source in your selected pipeline. AI teammates access this data by querying the Edge Delta backend with the Edge Delta MCP connector.
Add the HTTP Pull Connector
To add the HTTP Pull connector, you specify the endpoint URL, HTTP method, and polling interval, then deploy to an environment.
Prerequisites
Before configuring the connector, ensure you have:
- Edge Delta agent deployed with outbound network access to target APIs
- Target API endpoint accessible from Edge Delta agent’s network location
- Authentication credentials (API keys, bearer tokens, basic auth) if required
- Identified endpoint URL and required headers/parameters
Configuration Steps
- Navigate to AI Team > Connectors in the Edge Delta application
- Find the HTTP Pull connector in Streaming Connectors
- Click the connector card
- Configure the Endpoint URL
- Set the Method (GET, POST, etc.)
- Add Headers for authentication if needed
- Optionally add Query Parameters
- Configure Advanced Settings for dynamic expressions, pagination, or TLS
- Select a target environment
- Click Save
The connector now polls the endpoint at the specified interval and streams content.
Configuration Options
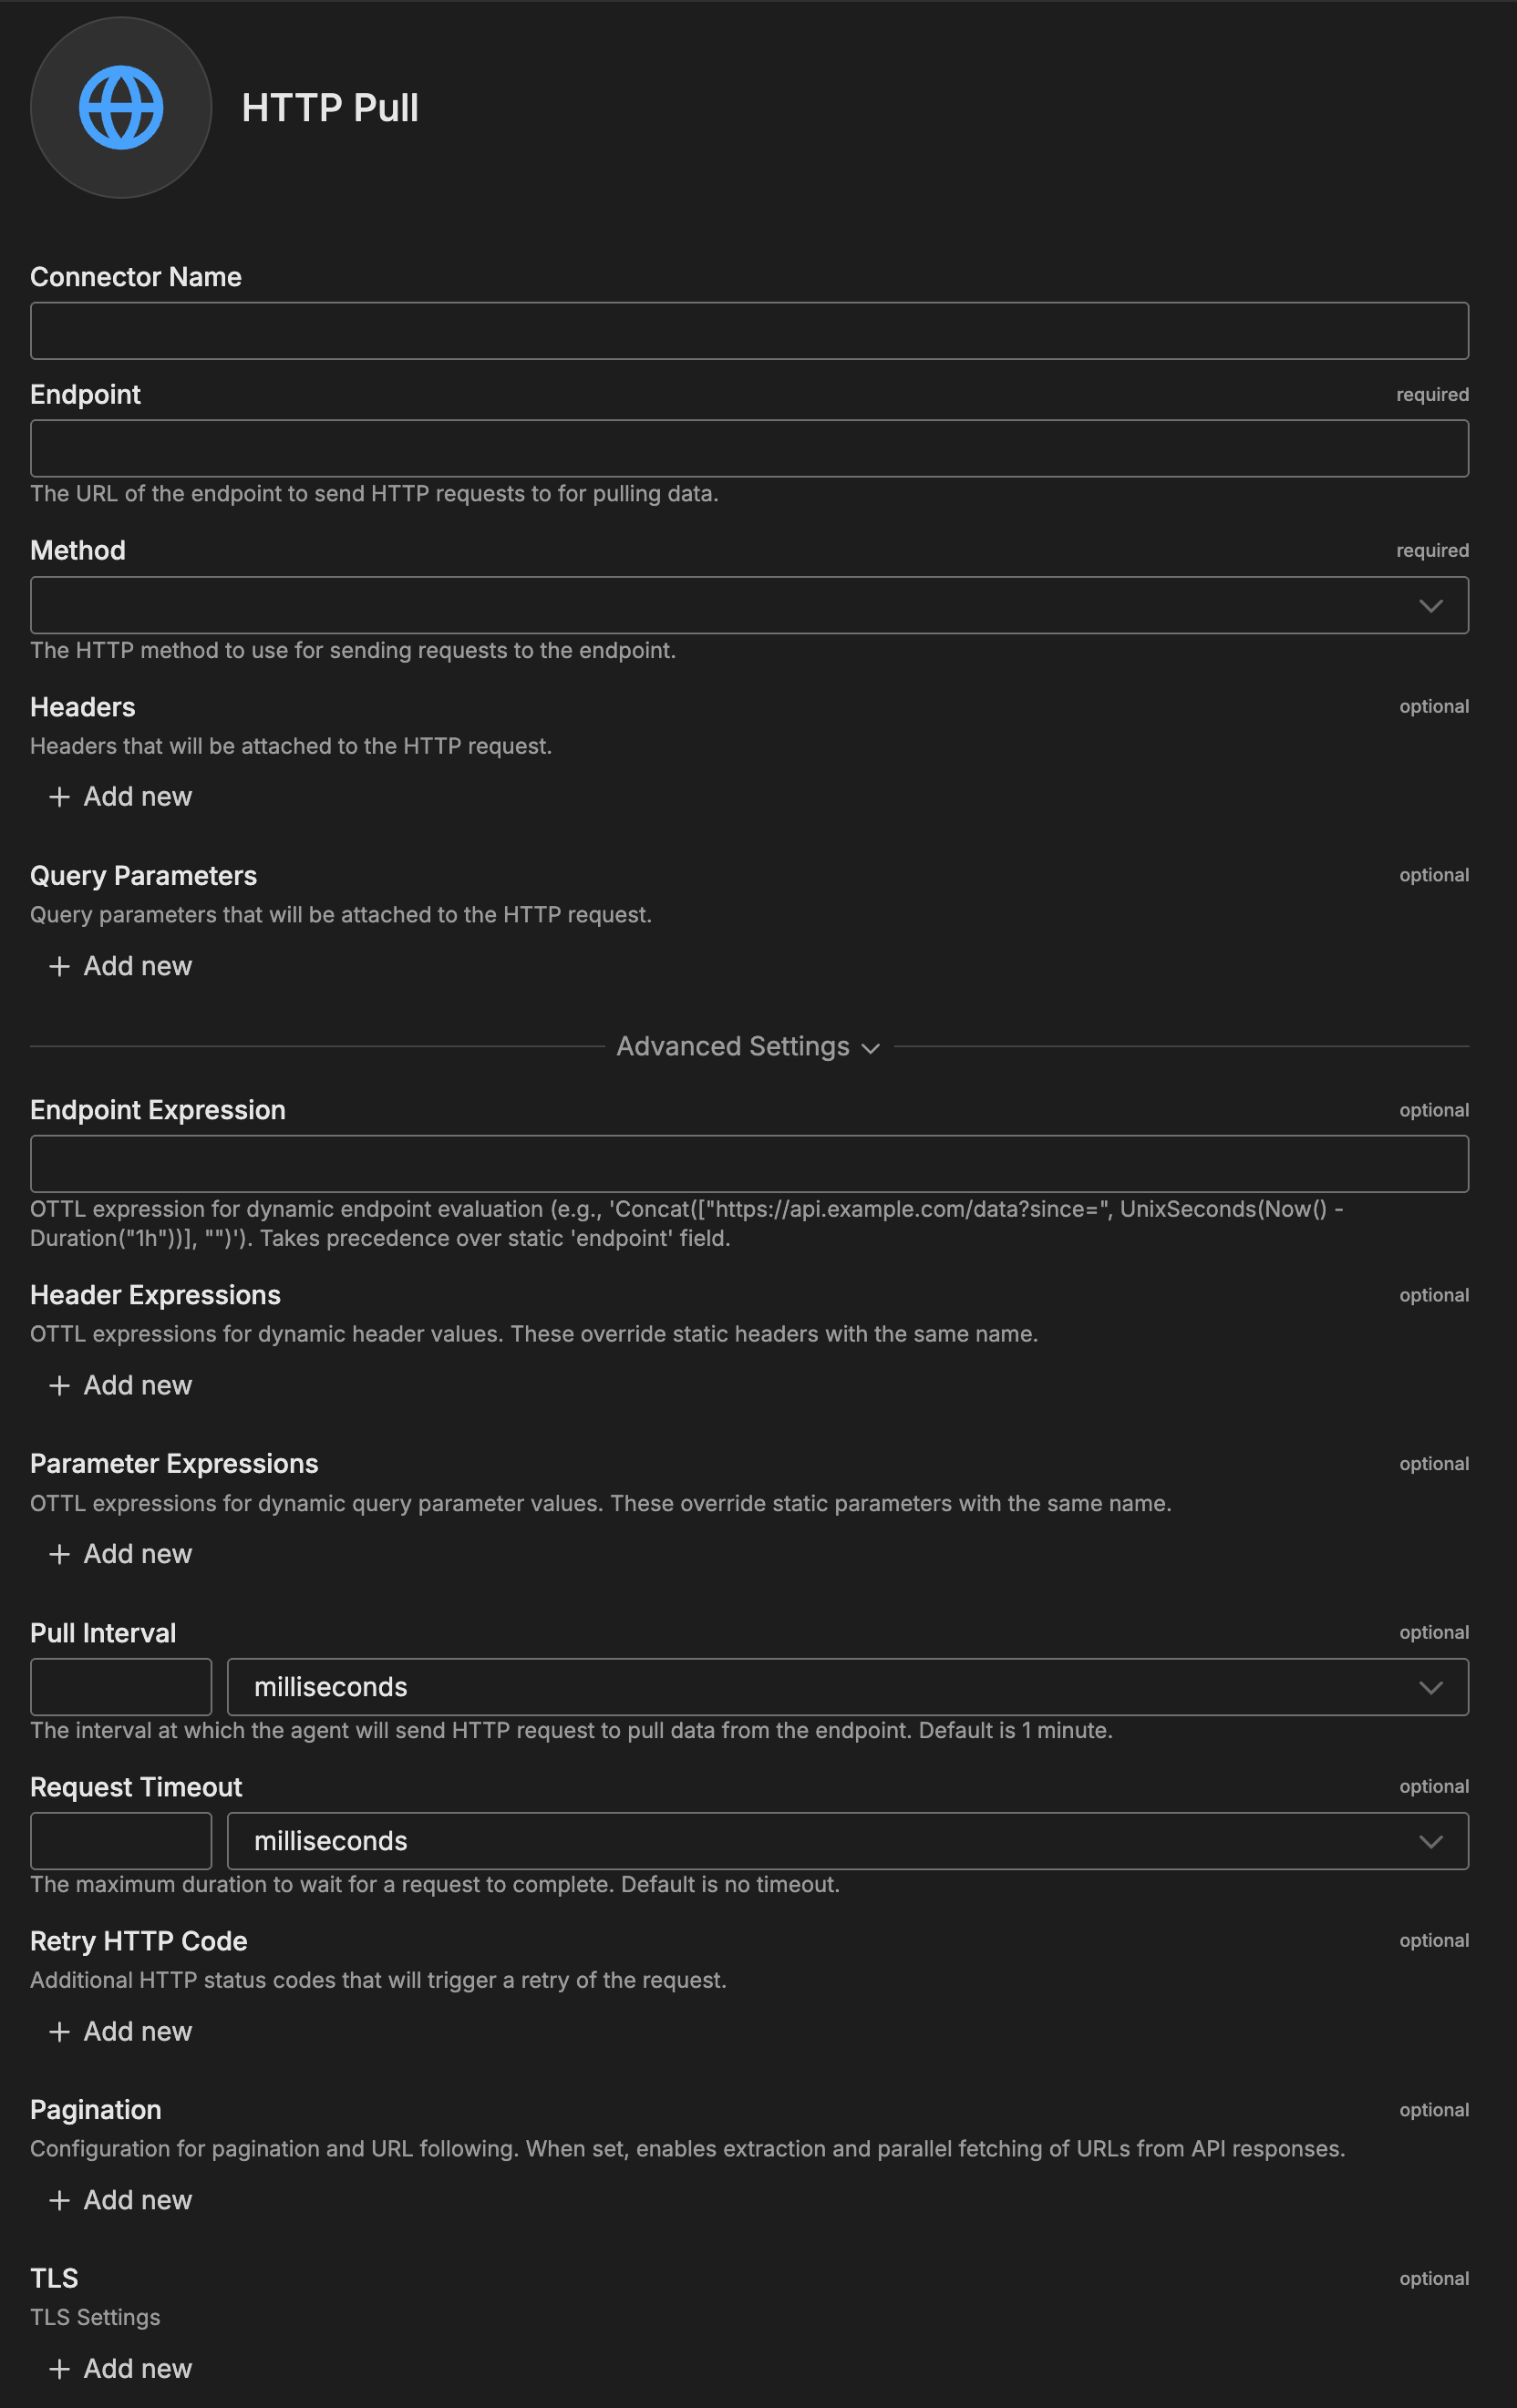
Connector Name
Name to identify this HTTP Pull connector instance.
Endpoint
The URL of the endpoint to send HTTP requests to for pulling data. Must be a valid HTTP or HTTPS URL.
Format: Complete URL with protocol
Examples:
https://api.example.com/v1/metricshttp://service.local:8080/healthhttps://status.service.com/api/v2/status.json
Note: Use Endpoint for static URLs, or Endpoint Expression (Advanced Settings) for dynamic URLs.
Method
The HTTP method to use for requests to the endpoint.
Values: GET, POST, PUT, DELETE
Default: GET
Headers
Headers attached to HTTP requests. Specified as key-value pairs.
Format: Header name and value
Examples:
Authorization:Bearer YOUR_API_TOKENX-API-Key:your-api-key-hereAccept:application/jsonContent-Type:application/json
Query Parameters
Query parameters attached to HTTP requests. Automatically URL-encoded and appended to the endpoint URL.
Format: Parameter name and value
Examples:
format:jsonlimit:100page:1include_metadata:true
Advanced Settings
Endpoint Expression
OTTL expression for dynamic endpoint evaluation. Takes precedence over static Endpoint field.
Format: OTTL expression (single-line)
Examples:
Concat(["https://api.example.com/data?since=", UnixSeconds(Now() - Duration("1h"))], "")Concat(["https://", EDXEnv("API_HOST", "api.example.com"), "/v1/logs"], "")
Use Cases:
- Environment-specific endpoints (dev/staging/prod)
- Time-based query parameters
- Dynamic API versioning
Header Expressions
OTTL expressions for dynamic header values. These override static headers with the same name.
Format: Header name and OTTL value expression
Examples:
Authorization:Concat(["Bearer ", EDXEnv("API_TOKEN", "")], "")X-Request-ID:Concat(["req-", String(UnixMilli(Now()))], "")
Parameter Expressions
OTTL expressions for dynamic query parameter values. These override static parameters with the same name.
Format: Parameter name and OTTL value expression
Examples:
start_time:FormatTime(Now() - Duration("1h"), "%Y-%m-%dT%H:%M:%SZ")end_time:FormatTime(Now(), "%Y-%m-%dT%H:%M:%SZ")since:String(UnixSeconds(Now() - Duration("24h")))
Common OTTL Functions:
Now()- Current timestampDuration("1h")- Parse durationFormatTime()- Format timestampUnixSeconds()- Unix timestamp in secondsUnixMilli()- Unix timestamp in millisecondsEDXEnv()- Get environment variableConcat()- Concatenate strings
For complete OTTL reference, see HTTP Pull Input Node documentation.
Pull Interval
The interval at which the agent sends HTTP requests to pull data from the endpoint.
Format: Duration in milliseconds
Default: 1 minute (60000 ms)
Examples:
30000- 30 seconds (high-frequency monitoring)60000- 1 minute (default)300000- 5 minutes (standard logging)3600000- 1 hour (batch processing)
Request Timeout
Maximum duration to wait for a request to complete.
Format: Duration in milliseconds
Default: No timeout
Example: 30000 - 30 second timeout
Retry HTTP Code
Additional HTTP status codes that trigger request retry.
Format: Array of HTTP status codes
Examples:
409- Conflict429- Too Many Requests503- Service Unavailable502- Bad Gateway
Pagination
Configuration for pagination and URL following. When set, enables extraction and parallel fetching of URLs from API responses.
URL JSON Path: JSON path expression to extract URLs from JSON responses (e.g., $.links[*].href). Only used when response_format is json.
Response Format: Format for parsing followed URL responses: json, text, or binary.
Max Parallel Requests: Maximum number of parallel requests when following URLs.
Inherit Authentication: Whether to use same authentication for followed URLs.
Error Strategy: How to handle errors when following URLs. continue skips failed URLs, stop halts processing.
Follow Link Header: Whether to follow URLs from Link headers in HTTP responses.
Link Relation: Link relation type to follow when using Link headers (e.g., next, prev).
Example JSON Pagination:
pagination:
  url_json_path: "next_page_url"
  response_format: json
  max_parallel: 5
  inherit_auth: true
  error_strategy: continue
Example Link Header Pagination:
pagination:
  follow_link_header: true
  link_relation: next
  max_parallel: 3
For detailed pagination configuration and examples, see HTTP Pull Input Node Pagination.
TLS
Optional TLS/SSL configuration for secure connections.
Configuration Options:
- Enable TLS: Enables SSL/TLS connection
- Ignore Certificate Check: Disables SSL/TLS certificate verification. Use with caution in testing environments only.
- CA File: Absolute file path to the CA certificate for SSL/TLS connections
- CA Path: Absolute path where CA certificate files are located
- CRT File: Absolute path to the SSL/TLS certificate file
- Key File: Absolute path to the private key file
- Key Password: Optional password for the key file
- Client Auth Type: Client authentication type. Default is noclientcert.
- Minimum Version: Minimum TLS version. Default is TLSv1_2.
- Maximum Version: Maximum TLS version allowed for connections
Metadata Level
This option is used to define which detected resources and attributes to add to each data item as it is ingested by Edge Delta. You can select:
- Required Only: This option includes the minimum required resources and attributes for Edge Delta to operate.
- Default: This option includes the required resources and attributes plus those selected by Edge Delta
- High: This option includes the required resources and attributes along with a larger selection of common optional fields.
- Custom: With this option selected, you can choose which attributes and resources to include. The required fields are selected by default and can’t be unchecked.
Based on your selection in the GUI, the source_metadata YAML is populated as two dictionaries (resource_attributes and attributes) with Boolean values.
See Choose Data Item Metadata for more information on selecting metadata.
HTTP Pull-specific metadata included:
http.url- Request URLhttp.response.status_code- HTTP response status
Rate Limit
The rate_limit parameter enables you to control data ingestion based on system resource usage. This advanced setting helps prevent source nodes from overwhelming the agent by automatically throttling or stopping data collection when CPU or memory thresholds are exceeded.
Use rate limiting to prevent runaway log collection from overwhelming the agent in high-volume sources, protect agent stability in resource-constrained environments with limited CPU/memory, automatically throttle during bursty traffic patterns, and ensure fair resource allocation across source nodes in multi-tenant deployments.
When rate limiting triggers, pull-based sources (File, S3, HTTP Pull) stop fetching new data, push-based sources (HTTP, TCP, UDP, OTLP) reject incoming data, and stream-based sources (Kafka, Pub/Sub) pause consumption. Rate limiting operates at the source node level, where each source with rate limiting enabled independently monitors and enforces its own thresholds.
Rate limiting vs backpressure: Rate limiting and backpressure are different mechanisms. Rate limiting controls data ingestion at the source based on CPU or memory thresholds. Backpressure controls data output at the destination when in-memory queues fill up. Backpressure logs such as
backpressure: dataCh at 92% capacitydo not appear when rate limiting triggers, and rate limiting logs do not appear during backpressure events.
Observability: When rate limiting is active in enforce mode, the agent does not produce INFO, WARN, or ERROR level logs. To confirm that rate limiting is triggering, check the source node’s Bytes I/O metrics in the Edge Delta app for gaps or drops that coincide with expected throttling periods.
Configuration Steps:
- Click Add New in the Rate Limit section
- Click Add New for Evaluation Policy
- Select Policy Type:
- CPU Usage: Monitors CPU consumption and rate limits when usage exceeds defined thresholds. Use for CPU-intensive sources like file parsing or complex transformations.
- Memory Usage: Monitors memory consumption and rate limits when usage exceeds defined thresholds. Use for memory-intensive sources like large message buffers or caching.
- AND (composite): Combines multiple sub-policies with AND logic. All sub-policies must be true simultaneously to trigger rate limiting. Use when you want conservative rate limiting (both CPU and memory must be high).
- OR (composite): Combines multiple sub-policies with OR logic. Any sub-policy can trigger rate limiting. Use when you want aggressive rate limiting (either CPU or memory being high triggers).
- Select Evaluation Mode. Choose how the policy behaves when thresholds are exceeded:
- Enforce (default): Actively applies rate limiting when thresholds are met. Pull-based sources (File, S3, HTTP Pull) stop fetching new data, push-based sources (HTTP, TCP, UDP, OTLP) reject incoming data, and stream-based sources (Kafka, Pub/Sub) pause consumption. Use in production to protect agent resources.
- Monitor: Logs when rate limiting would occur without actually limiting data flow. Use for testing thresholds before enforcing them in production.
- Passthrough: Disables rate limiting entirely while keeping the configuration in place. Use to temporarily disable rate limiting without removing configuration.
- Set Absolute Limits and Relative Limits (for CPU Usage and Memory Usage policies)
Note: If you specify both absolute and relative limits, the system evaluates both conditions and rate limiting triggers when either condition is met (OR logic). For example, if you set absolute limit to
1.0CPU cores and relative limit to50%, rate limiting triggers when the source uses either 1 full core OR 50% of available CPU, whichever happens first.
For CPU Absolute Limits: Enter value in full core units:
0.1= one-tenth of a CPU core0.5= half a CPU core1.0= one full CPU core2.0= two full CPU cores
For CPU Relative Limits: Enter percentage of total available CPU (0-100):
50= 50% of available CPU75= 75% of available CPU85= 85% of available CPU
For Memory Absolute Limits: Enter value in bytes
104857600= 100Mi (100 × 1024 × 1024)536870912= 512Mi (512 × 1024 × 1024)1073741824= 1Gi (1 × 1024 × 1024 × 1024)
For Memory Relative Limits: Enter percentage of total available memory (0-100)
60= 60% of available memory75= 75% of available memory80= 80% of available memory
- Set Refresh Interval (for CPU Usage and Memory Usage policies). Specify how frequently the system checks resource usage:
- Recommended Values:
10sto30sfor most use cases5sto10sfor high-volume sources requiring quick response1mor higher for stable, low-volume sources
The system fetches current CPU/memory usage at the specified refresh interval and uses that value for evaluation until the next refresh. Shorter intervals provide more responsive rate limiting but incur slightly higher overhead, while longer intervals are more efficient but slower to react to sudden resource spikes.
The GUI generates YAML as follows:
# Simple CPU-based rate limiting
nodes:
  - name: <node name>
    type: <node type>
    rate_limit:
      evaluation_policy:
        policy_type: cpu_usage
        evaluation_mode: enforce
        absolute_limit: 0.5  # Limit to half a CPU core
        refresh_interval: 10s
# Simple memory-based rate limiting
nodes:
  - name: <node name>
    type: <node type>
    rate_limit:
      evaluation_policy:
        policy_type: memory_usage
        evaluation_mode: enforce
        absolute_limit: 536870912  # 512Mi in bytes
        refresh_interval: 30s
Composite Policies (AND / OR)
When using AND or OR policy types, you define sub-policies instead of limits. Sub-policies must be siblings (at the same level)—do not nest sub-policies within other sub-policies. Each sub-policy is independently evaluated, and the parent policy’s evaluation mode applies to the composite result.
- AND Logic: All sub-policies must evaluate to true at the same time to trigger rate limiting. Use when you want conservative rate limiting (limit only when CPU AND memory are both high).
- OR Logic: Any sub-policy evaluating to true triggers rate limiting. Use when you want aggressive protection (limit when either CPU OR memory is high).
Configuration Steps:
- Select AND (composite) or OR (composite) as the Policy Type
- Choose the Evaluation Mode (typically Enforce)
- Click Add New under Sub-Policies to add the first condition
- Configure the first sub-policy by selecting policy type (CPU Usage or Memory Usage), selecting evaluation mode, setting absolute and/or relative limits, and setting refresh interval
- In the parent policy (not within the child), click Add New again to add a sibling sub-policy
- Configure additional sub-policies following the same pattern
The GUI generates YAML as follows:
# AND composite policy - both CPU AND memory must exceed limits
nodes:
  - name: <node name>
    type: <node type>
    rate_limit:
      evaluation_policy:
        policy_type: and
        evaluation_mode: enforce
        sub_policies:
          # First sub-policy (sibling)
          - policy_type: cpu_usage
            evaluation_mode: enforce
            absolute_limit: 0.75  # Limit to 75% of one core
            refresh_interval: 15s
          # Second sub-policy (sibling)
          - policy_type: memory_usage
            evaluation_mode: enforce
            absolute_limit: 1073741824  # 1Gi in bytes
            refresh_interval: 15s
# OR composite policy - either CPU OR memory can trigger
nodes:
  - name: <node name>
    type: <node type>
    rate_limit:
      evaluation_policy:
        policy_type: or
        evaluation_mode: enforce
        sub_policies:
          - policy_type: cpu_usage
            evaluation_mode: enforce
            relative_limit: 85  # 85% of available CPU
            refresh_interval: 20s
          - policy_type: memory_usage
            evaluation_mode: enforce
            relative_limit: 80  # 80% of available memory
            refresh_interval: 20s
# Monitor mode for testing thresholds
nodes:
  - name: <node name>
    type: <node type>
    rate_limit:
      evaluation_policy:
        policy_type: memory_usage
        evaluation_mode: monitor  # Only logs, doesn't limit
        relative_limit: 70  # Test at 70% before enforcing
        refresh_interval: 30s
Target Environments
Select the Edge Delta pipeline (environment) where you want to deploy this connector.
How to Use the HTTP Pull Connector
The HTTP Pull connector integrates seamlessly with AI Team, enabling analysis of data from external APIs. AI teammates automatically leverage the ingested data based on the queries they receive and the context of the conversation.
Use Case: Third-Party Service Status Monitoring
Poll public status APIs to track service health and availability of external dependencies like payment processors or cloud providers. AI teammates analyze trends, detect status changes, component degradations, and service outages as soon as they appear. When combined with PagerDuty alerts, teammates automatically query recent status data during incident investigation to determine if external service issues are contributing to problems.
Configuration: Configure endpoint to status API (e.g., https://status.stripe.com/api/v2/status.json), add Accept header, set appropriate pull interval.
Use Case: Microservice Health Check Polling
Monitor internal microservices by polling health check endpoints to track service health, database connectivity, cache status, and resource availability. AI teammates detect unhealthy components and provide diagnostic recommendations. This is valuable when investigating performance issues—teammates can correlate health check failures with error spikes in logs and identify which dependencies are causing problems.
Configuration: Configure endpoint to internal health endpoint with authentication header, set shorter pull interval for critical services (30s-1m).
Use Case: Prometheus Metrics Collection
Query specific metrics from Prometheus via HTTP API and ingest into Edge Delta for AI-powered analysis. AI teammates correlate Prometheus metrics with log data and other telemetry for comprehensive observability. When combined with Jira integration, teammates can automatically document capacity issues by querying metric trends and creating detailed tickets with historical data.
Configuration: Use endpoint http://prometheus:9090/api/v1/query with query parameter for PromQL expression, configure pull interval based on metric granularity needs.
Troubleshooting
Connection timeout errors: Verify endpoint URL is correct and reachable. Test connection using curl from agent host. Check firewall rules allow outbound traffic.
401/403 authentication errors: Verify authentication headers are correctly formatted. Check API token is valid and not expired. Ensure token has necessary permissions for the endpoint.
404 Not Found errors: Verify endpoint URL matches API documentation exactly, including API version. Check query parameters are properly formatted and match expected names.
429 Too Many Requests: Reduce polling frequency by increasing pull interval. Check API provider’s rate limits and adjust accordingly. Implement exponential backoff if needed.
Invalid JSON response errors: Verify endpoint returns JSON by checking Content-Type header. Review API documentation for expected response format. Use debugging tools to inspect raw response.
Slow response times: Use query parameters to filter data at source. Implement pagination if API supports it. Check timeout settings provide enough time for legitimate responses.
Pagination not working: Confirm API returns pagination information (Link header or JSON field). Verify json path or link relation configuration matches API response structure. Check debug logs for pagination attempts.
OTTL expression errors: Ensure expressions are single-line (multi-line fails validation). Test expressions in development before production deployment. Provide fallback values in EDXEnv() calls.
Next Steps
- Learn about HTTP Pull Input Node for detailed OTTL examples and pagination strategies
- Explore vendor-specific integrations for GitHub, Microsoft Graph, and other APIs
- Learn about creating custom teammates that can use HTTP Pull data
For additional help, visit AI Team Support.