HTTP(S) Connector
Configure the HTTP(S) connector to receive logs, metrics, and telemetry data pushed to HTTP/HTTPS webhook endpoints from applications and services.
17 minute read
Overview
The HTTP(S) connector receives telemetry data, logs, metrics, and events pushed to HTTP/HTTPS endpoints. Edge Delta acts as an HTTP server, accepting data from webhooks, custom applications, monitoring tools, and third-party services that publish data via HTTP POST requests. Content streams into Edge Delta Pipelines for analysis by AI teammates through the Edge Delta MCP connector.
The connector supports various data formats (JSON, text, compressed), configurable authentication (Bearer token, Basic auth, custom headers), TLS/SSL encryption, path-based routing, and automatic metadata extraction from HTTP requests.
When you add this streaming connector, it appears as a HTTP source in your selected pipeline. AI teammates access this data by querying the Edge Delta backend with the Edge Delta MCP connector.
Add the HTTP(S) Connector
To add the HTTP(S) connector, you configure Edge Delta to listen on a specified port and IP address, define path-based routing patterns, and set up authentication to secure the endpoint.
Prerequisites
Before configuring the connector, ensure you have:
- Edge Delta agent deployed with network access to receive inbound HTTP/HTTPS traffic
- Firewall rules configured to allow inbound traffic on the designated port
- Identified port number and authentication method for the endpoint
Configuration Steps
- Navigate to AI Team > Connectors in the Edge Delta application
- Find the HTTP(S) connector in Streaming Connectors
- Click the connector card
- Configure the Port number to listen on
- Set the Listen address (default: 0.0.0.0)
- Configure Read Timeout for incoming connections
- Optionally configure Advanced Settings for path filtering, compression, TLS, or authentication
- Select a target environment
- Click Save
The connector now listens for HTTP POST requests and streams content.
Configuration Options
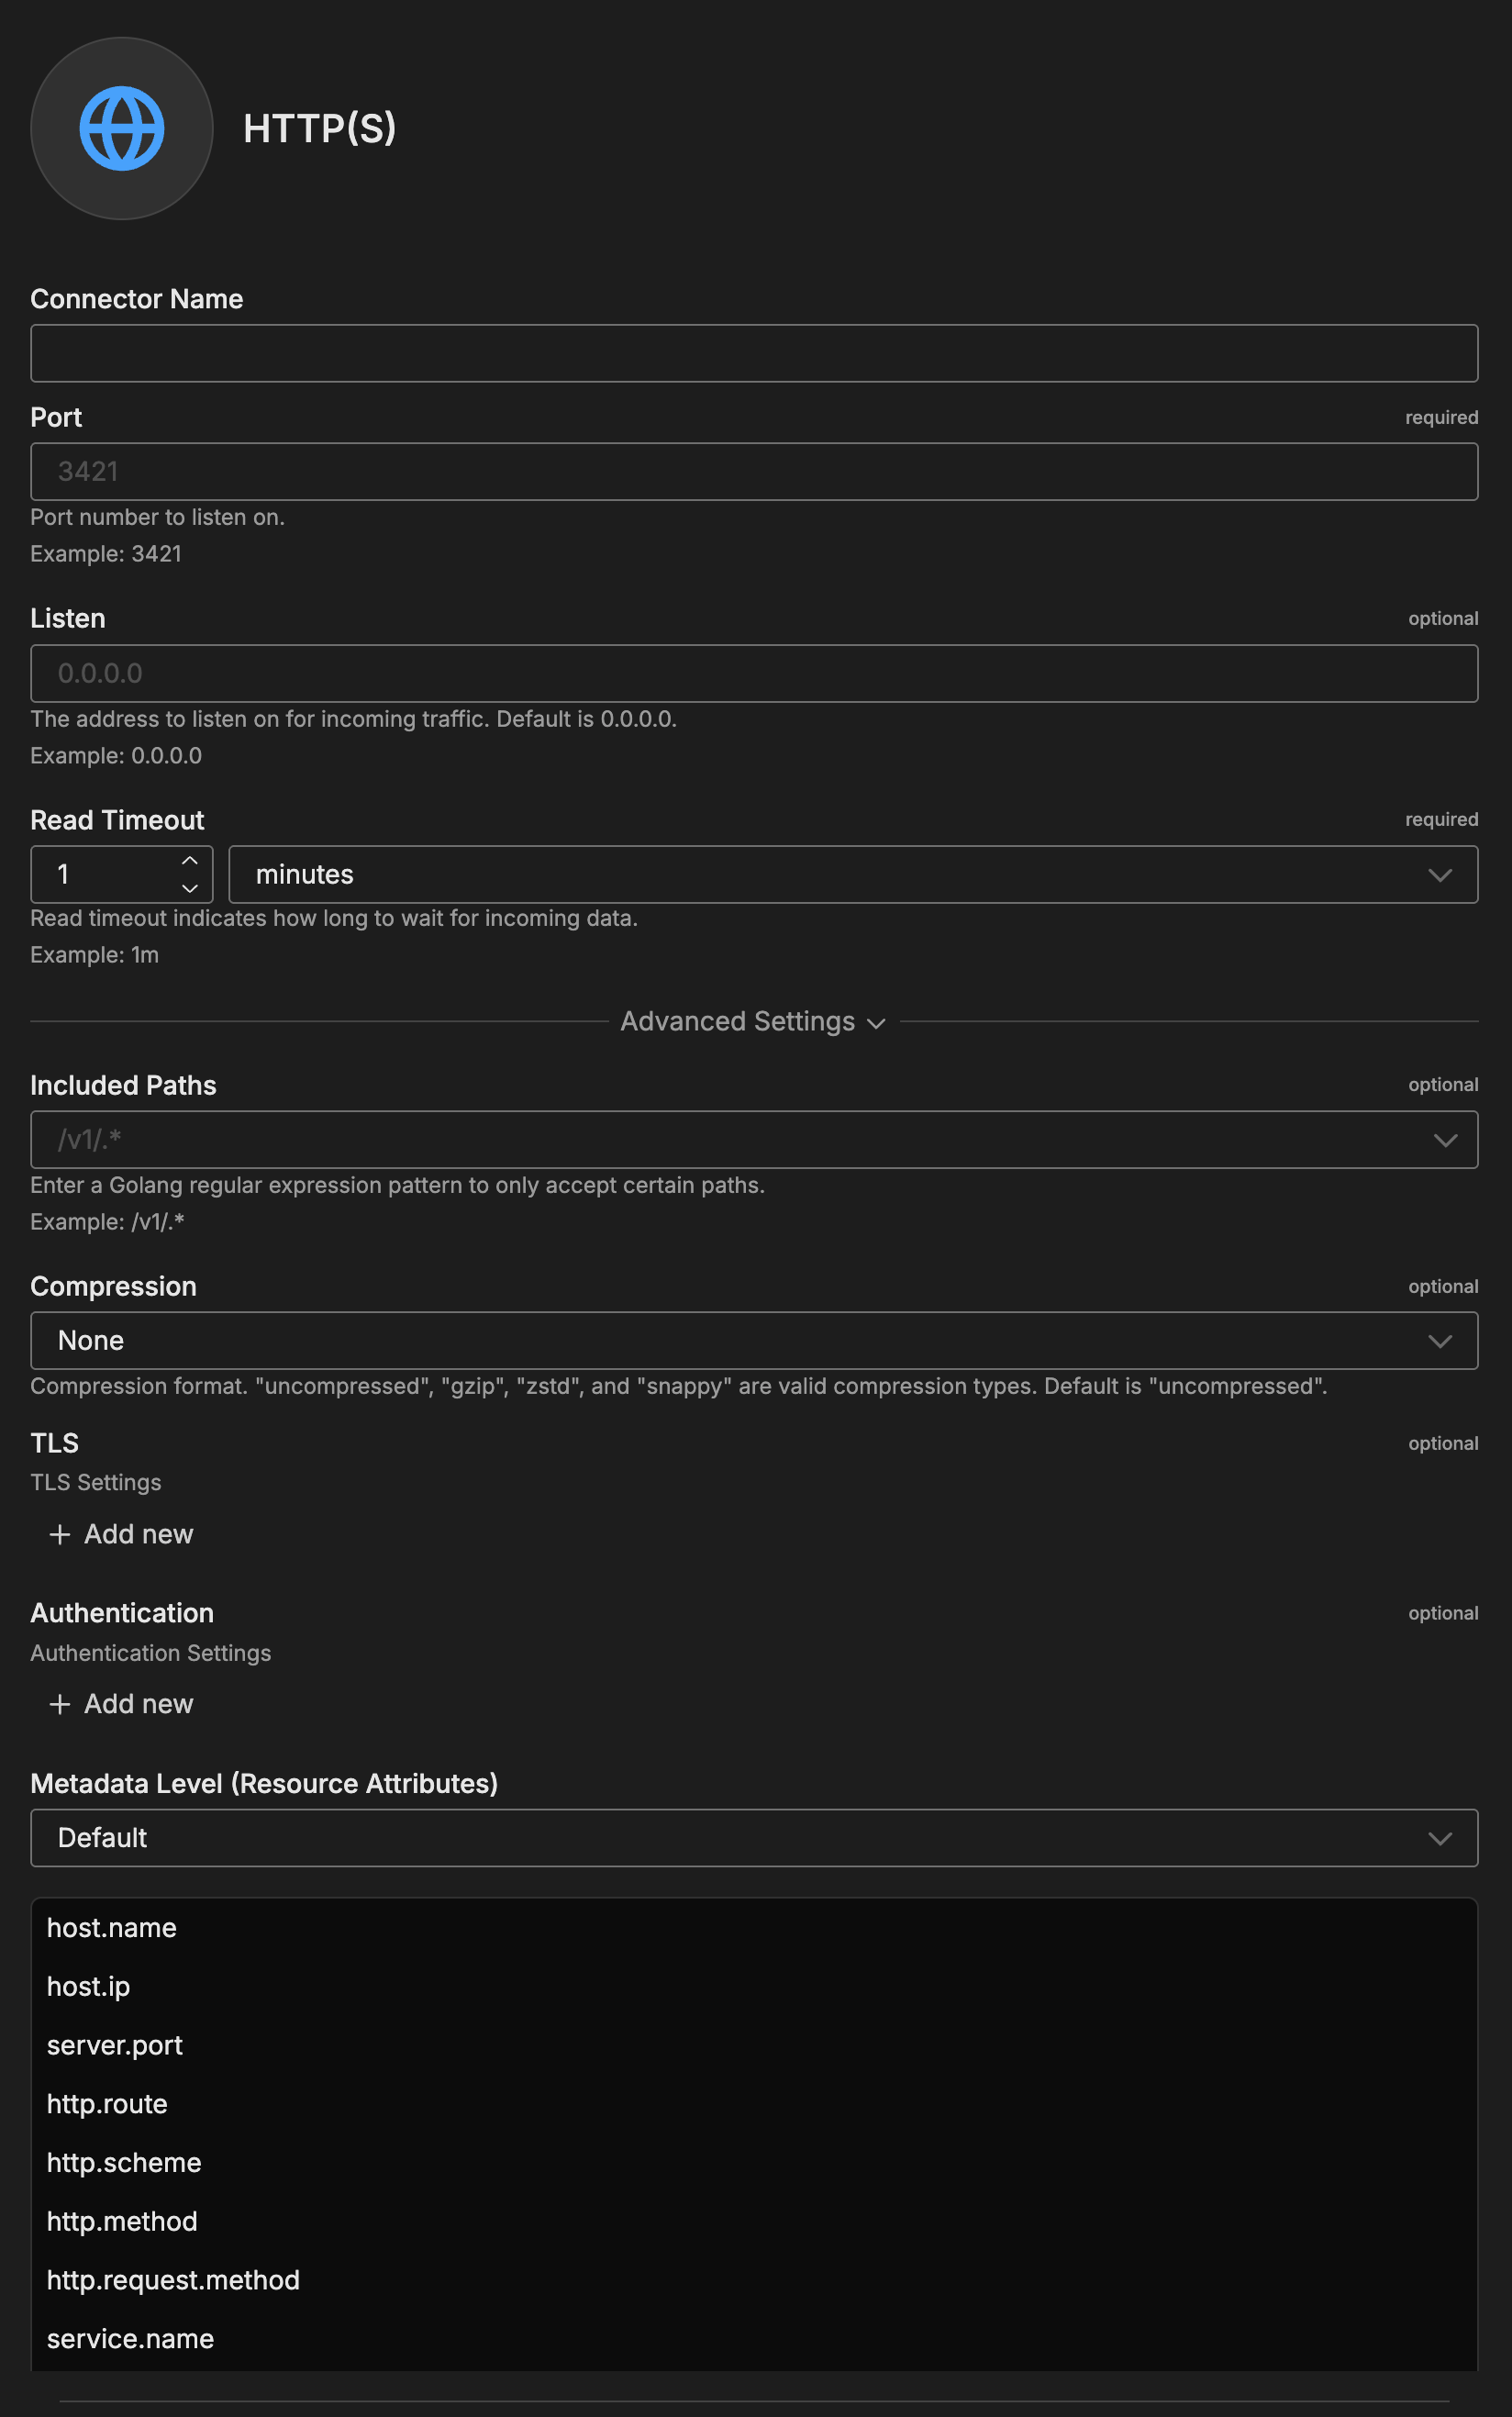
Connector Name
Name to identify this HTTP(S) connector instance.
Port
Port number to listen on for incoming HTTP/HTTPS requests.
Format: Integer between 1-65535
Examples:
3421- Standard HTTP port8443- Standard HTTPS port9090- Custom port
Note: Ports below 1024 require elevated privileges. Use ports 1024+ for non-root deployments.
Listen
IP address the HTTP server will bind to.
Format: Valid IPv4 address
Examples:
0.0.0.0- All interfaces (default)192.168.1.100- Specific interface127.0.0.1- Localhost only (testing)
Read Timeout
Maximum time to wait for incoming data on established connections.
Format: Duration with unit
Default: 1 minute
Examples:
30s- 30 seconds for fast timeout1m- 1 minute (default)2m- 2 minutes for large payloads
Advanced Settings
Included Paths
Filter incoming requests by URL path using Golang regular expression patterns. Only matching requests are accepted.
Format: Golang regex pattern
Default: .* (accept all paths)
Examples:
/v1/.*- All paths under/v1/v1/(logs|metrics|events)- Specific endpoints only/api/.*- All API paths
Use Cases:
- Organize different data types on different paths
- Accept only versioned API endpoints
- Separate production and development traffic
Compression
Compression format expected for incoming data.
Values: None, gzip, zstd, snappy
Default: None (uncompressed)
Use Cases:
gzip- Most common, 60-80% bandwidth reductionzstd- High compression ratiosnappy- Fast compression/decompressionNone- No compression (default)
TLS
Configure TLS settings for secure connections to this source. TLS is optional and typically used when the source node needs to accept encrypted connections or perform mutual TLS authentication with clients.
YAML Configuration Example:
nodes:
  - name: <node name>
    type: <source type>
    tls:
      <tls options>
CA Certificate File
Specifies the absolute path to a single CA (Certificate Authority) certificate file used to verify client certificates during mutual TLS authentication. This file contains the trusted CA certificate that signed the client certificates. Use this when you have a single CA certificate. (YAML parameter: ca_file)
When to use: Required when client_auth_type is set to verifyclientcertifgiven or requireandverifyclientcert. Choose either ca_file or ca_path, not both.
YAML Configuration Example:
nodes:
  - name: <node name>
    type: <source type>
    tls:
      ca_file: /certs/ca.pem
      client_auth_type: requireandverifyclientcert
CA Certificate Path
Specifies a directory path containing one or more CA certificate files for client certificate verification. Use this when you need to trust multiple CAs or when managing CA certificates across multiple files. All certificate files in the directory will be loaded. (YAML parameter: ca_path)
When to use: Alternative to ca_file when you have multiple CA certificates. Required when client_auth_type is set to verifyclientcertifgiven or requireandverifyclientcert. Choose either ca_file or ca_path, not both.
YAML Configuration Example:
nodes:
  - name: <node name>
    type: <source type>
    tls:
      ca_path: /certs/ca-certificates/
      client_auth_type: requireandverifyclientcert
Certificate File
Path to the server certificate file (public key) that will be presented to connecting clients during the TLS handshake. This certificate identifies the server and must match the private key. The certificate should be in PEM format and can include the full certificate chain. (YAML parameter: crt_file)
When to use: Required for TLS/HTTPS connections. Must be used together with key_file. Obtain this from your certificate authority or generate a self-signed certificate for testing.
YAML Configuration Example:
nodes:
  - name: <node name>
    type: <source type>
    tls:
      crt_file: /certs/server-cert.pem
      key_file: /certs/server-key.pem
Private Key File
Path to the private key file corresponding to the server certificate. This key must match the public key in the certificate file and is used to decrypt communications encrypted with the public key. Keep this file secure and restrict access permissions. (YAML parameter: key_file)
When to use: Required for TLS/HTTPS connections. Must be used together with crt_file. If the key file is encrypted, also specify key_password.
YAML Configuration Example:
nodes:
  - name: <node name>
    type: <source type>
    tls:
      crt_file: /certs/server-cert.pem
      key_file: /certs/server-key.pem
      key_password: <password>  # Only if key is encrypted
Private Key Password
Password (passphrase) used to decrypt an encrypted private key file. Only needed if your private key file is password-protected. If your key file is unencrypted, omit this parameter. (YAML parameter: key_password)
When to use: Optional. Only required if key_file is encrypted/password-protected. For enhanced security, use encrypted keys in production environments.
YAML Configuration Example:
nodes:
  - name: <node name>
    type: <source type>
    tls:
      crt_file: /certs/server-cert.pem
      key_file: /certs/encrypted-server-key.pem
      key_password: mySecurePassword123
Client Authentication Type
Controls how client certificates are requested and validated during the TLS handshake. This setting is specific to server-side TLS and determines the mutual TLS (mTLS) behavior. Use this to enforce certificate-based authentication from connecting clients for enhanced security. (YAML parameter: client_auth_type)
Valid options:
noclientcert- No client certificate is requested; any sent certificates are ignored. Use for standard TLS encryption without client authentication.requestclientcert- Client certificate is requested but not required. Useful for optional client authentication where you want to accept both authenticated and unauthenticated clients.requireanyclientcert- Client must send a certificate, but it is not validated against a CA. Use when you need proof a client has a certificate but don’t need to verify its authenticity.verifyclientcertifgiven- Certificate is requested but not required; if sent, it must be valid and signed by a trusted CA. Balances security with flexibility for mixed client environments.requireandverifyclientcert- Client must send a valid certificate signed by a trusted CA (full mutual TLS). Use for maximum security when all clients can be provisioned with certificates.
Default: noclientcert
When to use: Set to verifyclientcertifgiven or requireandverifyclientcert for secure environments where you need to verify client identity. When using certificate verification options, you must also configure ca_file or ca_path to specify the trusted CA certificates.
YAML Configuration Example:
nodes:
  - name: <node name>
    type: <source type>
    tls:
      client_auth_type: requireandverifyclientcert
      ca_file: /certs/ca.pem  # Required for certificate validation
Minimum TLS Version
Minimum TLS protocol version that will be accepted from connecting clients. This enforces a baseline security level by rejecting connections from clients using older, less secure TLS versions. (YAML parameter: min_version)
Available versions:
TLSv1_0- Deprecated, not recommended (security vulnerabilities)TLSv1_1- Deprecated, not recommended (security vulnerabilities)TLSv1_2- Recommended minimum for production (default)TLSv1_3- Most secure, use when all clients support it
Default: TLSv1_2
When to use: Set to TLSv1_2 or higher for production deployments. Only use TLSv1_0 or TLSv1_1 if you must support legacy clients that cannot upgrade, and be aware of the security risks. TLS 1.0 and 1.1 are officially deprecated and should be avoided.
YAML Configuration Example:
nodes:
  - name: <node name>
    type: <source type>
    tls:
      min_version: TLSv1_2
Maximum TLS Version
Maximum TLS protocol version that will be accepted from connecting clients. This is typically used to restrict newer TLS versions if compatibility issues arise with specific client implementations. (YAML parameter: max_version)
Available versions:
TLSv1_0TLSv1_1TLSv1_2TLSv1_3
When to use: Usually left unset to allow the most secure version available. Only set this if you encounter specific compatibility issues with TLS 1.3 clients, or for testing purposes. In most cases, you should allow the latest TLS version.
YAML Configuration Example:
nodes:
  - name: <node name>
    type: <source type>
    tls:
      max_version: TLSv1_3
When to Enable:
- Public endpoints exposed to internet
- Compliance requirements for encryption
- Sensitive data transmission
- Production deployments
Authentication
Authentication settings control access to the HTTP endpoint.
Strategy Options:
- Bearer Token: Requires
Authorization: Bearer <token>header- Secret: Token value clients must provide
- Basic Auth: Standard HTTP Basic Authentication
- User Name: Username for authentication
- Password: Password for authentication
- None: No authentication (use only in secure/isolated networks)
Examples:
- Bearer token for API integration
- Basic auth for simple username/password
- None for VPC-internal endpoints with network isolation
Security Note: Always use authentication for public endpoints. Combine with TLS for production.
Metadata Level
This option is used to define which detected resources and attributes to add to each data item as it is ingested by Edge Delta. You can select:
- Required Only: This option includes the minimum required resources and attributes for Edge Delta to operate.
- Default: This option includes the required resources and attributes plus those selected by Edge Delta
- High: This option includes the required resources and attributes along with a larger selection of common optional fields.
- Custom: With this option selected, you can choose which attributes and resources to include. The required fields are selected by default and can’t be unchecked.
Based on your selection in the GUI, the source_metadata YAML is populated as two dictionaries (resource_attributes and attributes) with Boolean values.
See Choose Data Item Metadata for more information on selecting metadata.
HTTP(S)-specific metadata included:
server.port- Port number server is listening onhttp.route- URL path of the requesthttp.scheme- HTTP or HTTPShttp.method- HTTP method (POST, GET, PUT)http.request.method- Detailed request method
Rate Limit
The rate_limit parameter enables you to control data ingestion based on system resource usage. This advanced setting helps prevent source nodes from overwhelming the agent by automatically throttling or stopping data collection when CPU or memory thresholds are exceeded.
Use rate limiting to prevent runaway log collection from overwhelming the agent in high-volume sources, protect agent stability in resource-constrained environments with limited CPU/memory, automatically throttle during bursty traffic patterns, and ensure fair resource allocation across source nodes in multi-tenant deployments.
When rate limiting triggers, pull-based sources (File, S3, HTTP Pull) stop fetching new data, push-based sources (HTTP, TCP, UDP, OTLP) reject incoming data, and stream-based sources (Kafka, Pub/Sub) pause consumption. Rate limiting operates at the source node level, where each source with rate limiting enabled independently monitors and enforces its own thresholds.
Rate limiting vs backpressure: Rate limiting and backpressure are different mechanisms. Rate limiting controls data ingestion at the source based on CPU or memory thresholds. Backpressure controls data output at the destination when in-memory queues fill up. Backpressure logs such as
backpressure: dataCh at 92% capacitydo not appear when rate limiting triggers, and rate limiting logs do not appear during backpressure events.
Observability: When rate limiting is active in enforce mode, the agent does not produce INFO, WARN, or ERROR level logs. To confirm that rate limiting is triggering, check the source node’s Bytes I/O metrics in the Edge Delta app for gaps or drops that coincide with expected throttling periods.
Configuration Steps:
- Click Add New in the Rate Limit section
- Click Add New for Evaluation Policy
- Select Policy Type:
- CPU Usage: Monitors CPU consumption and rate limits when usage exceeds defined thresholds. Use for CPU-intensive sources like file parsing or complex transformations.
- Memory Usage: Monitors memory consumption and rate limits when usage exceeds defined thresholds. Use for memory-intensive sources like large message buffers or caching.
- AND (composite): Combines multiple sub-policies with AND logic. All sub-policies must be true simultaneously to trigger rate limiting. Use when you want conservative rate limiting (both CPU and memory must be high).
- OR (composite): Combines multiple sub-policies with OR logic. Any sub-policy can trigger rate limiting. Use when you want aggressive rate limiting (either CPU or memory being high triggers).
- Select Evaluation Mode. Choose how the policy behaves when thresholds are exceeded:
- Enforce (default): Actively applies rate limiting when thresholds are met. Pull-based sources (File, S3, HTTP Pull) stop fetching new data, push-based sources (HTTP, TCP, UDP, OTLP) reject incoming data, and stream-based sources (Kafka, Pub/Sub) pause consumption. Use in production to protect agent resources.
- Monitor: Logs when rate limiting would occur without actually limiting data flow. Use for testing thresholds before enforcing them in production.
- Passthrough: Disables rate limiting entirely while keeping the configuration in place. Use to temporarily disable rate limiting without removing configuration.
- Set Absolute Limits and Relative Limits (for CPU Usage and Memory Usage policies)
Note: If you specify both absolute and relative limits, the system evaluates both conditions and rate limiting triggers when either condition is met (OR logic). For example, if you set absolute limit to
1.0CPU cores and relative limit to50%, rate limiting triggers when the source uses either 1 full core OR 50% of available CPU, whichever happens first.
For CPU Absolute Limits: Enter value in full core units:
0.1= one-tenth of a CPU core0.5= half a CPU core1.0= one full CPU core2.0= two full CPU cores
For CPU Relative Limits: Enter percentage of total available CPU (0-100):
50= 50% of available CPU75= 75% of available CPU85= 85% of available CPU
For Memory Absolute Limits: Enter value in bytes
104857600= 100Mi (100 × 1024 × 1024)536870912= 512Mi (512 × 1024 × 1024)1073741824= 1Gi (1 × 1024 × 1024 × 1024)
For Memory Relative Limits: Enter percentage of total available memory (0-100)
60= 60% of available memory75= 75% of available memory80= 80% of available memory
- Set Refresh Interval (for CPU Usage and Memory Usage policies). Specify how frequently the system checks resource usage:
- Recommended Values:
10sto30sfor most use cases5sto10sfor high-volume sources requiring quick response1mor higher for stable, low-volume sources
The system fetches current CPU/memory usage at the specified refresh interval and uses that value for evaluation until the next refresh. Shorter intervals provide more responsive rate limiting but incur slightly higher overhead, while longer intervals are more efficient but slower to react to sudden resource spikes.
The GUI generates YAML as follows:
# Simple CPU-based rate limiting
nodes:
  - name: <node name>
    type: <node type>
    rate_limit:
      evaluation_policy:
        policy_type: cpu_usage
        evaluation_mode: enforce
        absolute_limit: 0.5  # Limit to half a CPU core
        refresh_interval: 10s
# Simple memory-based rate limiting
nodes:
  - name: <node name>
    type: <node type>
    rate_limit:
      evaluation_policy:
        policy_type: memory_usage
        evaluation_mode: enforce
        absolute_limit: 536870912  # 512Mi in bytes
        refresh_interval: 30s
Composite Policies (AND / OR)
When using AND or OR policy types, you define sub-policies instead of limits. Sub-policies must be siblings (at the same level)—do not nest sub-policies within other sub-policies. Each sub-policy is independently evaluated, and the parent policy’s evaluation mode applies to the composite result.
- AND Logic: All sub-policies must evaluate to true at the same time to trigger rate limiting. Use when you want conservative rate limiting (limit only when CPU AND memory are both high).
- OR Logic: Any sub-policy evaluating to true triggers rate limiting. Use when you want aggressive protection (limit when either CPU OR memory is high).
Configuration Steps:
- Select AND (composite) or OR (composite) as the Policy Type
- Choose the Evaluation Mode (typically Enforce)
- Click Add New under Sub-Policies to add the first condition
- Configure the first sub-policy by selecting policy type (CPU Usage or Memory Usage), selecting evaluation mode, setting absolute and/or relative limits, and setting refresh interval
- In the parent policy (not within the child), click Add New again to add a sibling sub-policy
- Configure additional sub-policies following the same pattern
The GUI generates YAML as follows:
# AND composite policy - both CPU AND memory must exceed limits
nodes:
  - name: <node name>
    type: <node type>
    rate_limit:
      evaluation_policy:
        policy_type: and
        evaluation_mode: enforce
        sub_policies:
          # First sub-policy (sibling)
          - policy_type: cpu_usage
            evaluation_mode: enforce
            absolute_limit: 0.75  # Limit to 75% of one core
            refresh_interval: 15s
          # Second sub-policy (sibling)
          - policy_type: memory_usage
            evaluation_mode: enforce
            absolute_limit: 1073741824  # 1Gi in bytes
            refresh_interval: 15s
# OR composite policy - either CPU OR memory can trigger
nodes:
  - name: <node name>
    type: <node type>
    rate_limit:
      evaluation_policy:
        policy_type: or
        evaluation_mode: enforce
        sub_policies:
          - policy_type: cpu_usage
            evaluation_mode: enforce
            relative_limit: 85  # 85% of available CPU
            refresh_interval: 20s
          - policy_type: memory_usage
            evaluation_mode: enforce
            relative_limit: 80  # 80% of available memory
            refresh_interval: 20s
# Monitor mode for testing thresholds
nodes:
  - name: <node name>
    type: <node type>
    rate_limit:
      evaluation_policy:
        policy_type: memory_usage
        evaluation_mode: monitor  # Only logs, doesn't limit
        relative_limit: 70  # Test at 70% before enforcing
        refresh_interval: 30s
Target Environments
Select the Edge Delta pipeline (environment) where you want to deploy this connector.
How to Use the HTTP(S) Connector
The HTTP(S) connector integrates seamlessly with AI Team, enabling analysis of webhook events and HTTP-pushed data. AI teammates automatically leverage the ingested data based on the queries they receive and the context of the conversation.
Use Case: Webhook Event Processing
Receive webhook notifications from third-party services like payment processors, order management systems, or inventory platforms. AI teammates analyze patterns, detect anomalies, and correlate events across multiple services. When combined with PagerDuty alerts, teammates automatically query recent webhook events during incident investigation to identify which external service triggered the issue and correlate with internal system behavior.
Configuration: Port 8443 with HTTPS enabled, path filter /v1/webhooks/.*, Bearer token authentication.
Use Case: Serverless Function Logging
Accept structured logs from AWS Lambda, Azure Functions, or other serverless platforms via simple HTTP POST requests. AI teammates analyze logs to identify performance bottlenecks, memory issues, and execution failures. This is valuable when investigating function failures—teammates can correlate error patterns with execution duration and memory usage to recommend configuration optimizations.
Configuration: Port 3421, path filter /v1/logs, gzip compression enabled, no auth (VPC-internal).
Use Case: Custom Application Metrics
Collect custom business metrics (conversion rates, cart abandonment, user engagement) that applications send via HTTP. AI teammates correlate business metrics with operational telemetry to identify how application performance affects business outcomes. When integrated with Jira, teammates can automatically document business impact by combining metric trends with error rates.
Configuration: Port 3421, path filter /v1/metrics, Basic authentication, no compression for small payloads.
Troubleshooting
Connection refused errors: Verify Edge Delta is listening on configured port (netstat -tuln | grep 3421). Check firewall rules allow inbound traffic.
Request timeout errors: Increase Read Timeout setting for large payloads or slow networks. Check network latency with ping/traceroute.
401 Unauthorized errors: Verify authentication credentials exactly match configuration. Check header format for Bearer tokens (Authorization: Bearer token).
SSL/TLS handshake failures: Ensure TLS is enabled with valid certificate and private key. Verify certificate matches hostname. Check certificate hasn’t expired.
404 Not Found on valid endpoint: Check Included Paths regex pattern matches request path. Test regex with online validator. Verify configuration deployed to all agents.
Data sent but not appearing: Verify JSON payload is well-formed. Ensure Content-Type: application/json header set. Check for pipeline filters dropping data.
Compression errors: Ensure Compression setting matches client’s compression format. Verify Content-Encoding header set correctly. Test decompression manually.
High latency: Check network round-trip time. Enable compression for large payloads. Monitor Edge Delta agent resource usage (CPU, memory).
Too many connections: Configure HTTP client to use connection pooling and keep-alive. Reuse client objects across requests. Check file descriptor limits.
Sending Data Examples
Python
import requests

url = "http://edge-delta-host:3421/v1/logs"
log_event = {
    "timestamp": "2024-10-01T14:30:00Z",
    "level": "ERROR",
    "message": "Payment processing failed",
    "service": "payment-service"
}

response = requests.post(url, json=log_event)
print(f"Status: {response.status_code}")
cURL
# With authentication
curl -X POST https://edge-delta-host:8443/v1/events \
  -H "Content-Type: application/json" \
  -H "Authorization: Bearer YOUR_TOKEN" \
  -d '{"event":"user_login","timestamp":"2024-10-01T14:30:00Z"}'

# Compressed
echo '{"level":"ERROR","message":"Timeout"}' | gzip | \
  curl -X POST http://edge-delta-host:3421/v1/logs \
    -H "Content-Encoding: gzip" \
    --data-binary @-
JavaScript/Node.js
const axios = require('axios');

const logEvent = {
    timestamp: new Date().toISOString(),
    level: "ERROR",
    message: "Database timeout"
};

axios.post('http://edge-delta-host:3421/v1/logs', logEvent)
    .then(res => console.log(`Sent: ${res.status}`))
    .catch(err => console.error(`Failed: ${err.message}`));
Next Steps
- Learn about creating custom teammates that can use HTTP(S) webhook data
- Explore the Edge Delta MCP connector for querying ingested data
For additional help, visit AI Team Support.