Ingest Audit Logs from Edge Delta Platform
5 minute read
Overview
Edge Delta audit logs capture user activity within the Edge Delta platform, providing visibility for compliance, security monitoring, and troubleshooting. While these logs are available through the Edge Delta web interface, you can also ingest them into Edge Delta pipelines to:
- Forward to SIEM platforms for centralized security monitoring
- Route to multiple destinations such as data lakes, compliance systems, and security analytics tools
- Transform and enrich audit data before forwarding
- Correlate audit logs with other telemetry data
- Apply custom processing and filtering rules
This integration uses the Edge Delta Search API to pull audit logs into a pipeline, where they can be processed and routed like any other telemetry data.
Understanding the Pipeline Processing
The pipeline processes audit logs through several stages:
1. API Response Structure
The Edge Delta Search API returns audit logs in this format:
{
  "items": [
    {
      "body": "Audit log message",
      "severity_text": "INFO",
      "timestamp": "2024-01-15T10:30:00Z",
      "attributes": {
        "user": "user@example.com",
        "action": "login",
        "path": "/api/v1/resource"
      }
    }
  ]
}
2. Processing Steps
| Step | Processor | Purpose |
|---|---|---|
| 1 | JSON Unroll | Extracts individual log entries from the items array |
| 2 | Parse JSON | Parses each log entry and merges fields into attributes |
| 3 | Copy Fields | Promotes body, severity_text, and timestamp to log record fields |
| 4 | Delete Fields | Removes redundant fields and HTTP response headers |
3. Final Log Format
After processing, each audit log entry becomes a structured log with:
- Body: The audit log message
- Severity: Log level (INFO, WARN, ERROR, etc.)
- Timestamp: When the action occurred
- Attributes: All metadata fields (user, action, path, method, etc.)
Prerequisites
Before configuring audit log ingestion, ensure you have:
- Audit logging enabled in your Edge Delta organization (see Audit Logs)
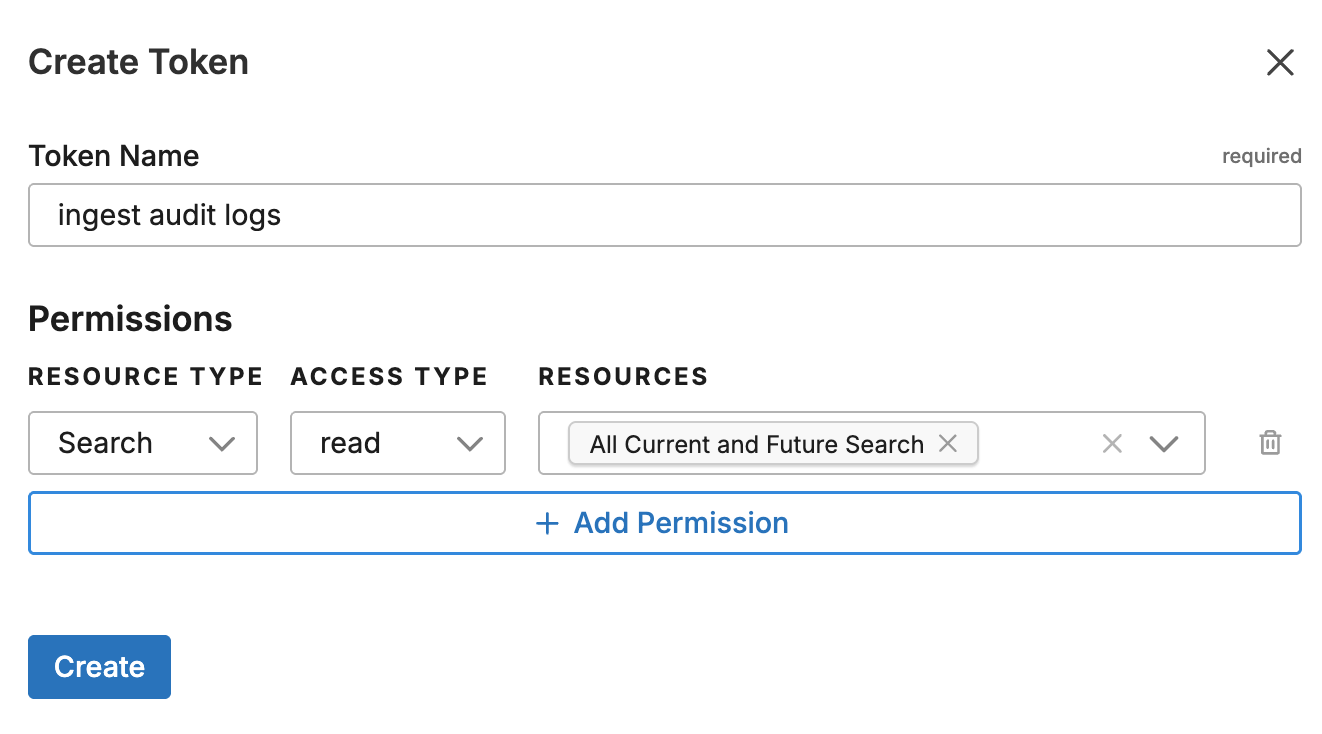
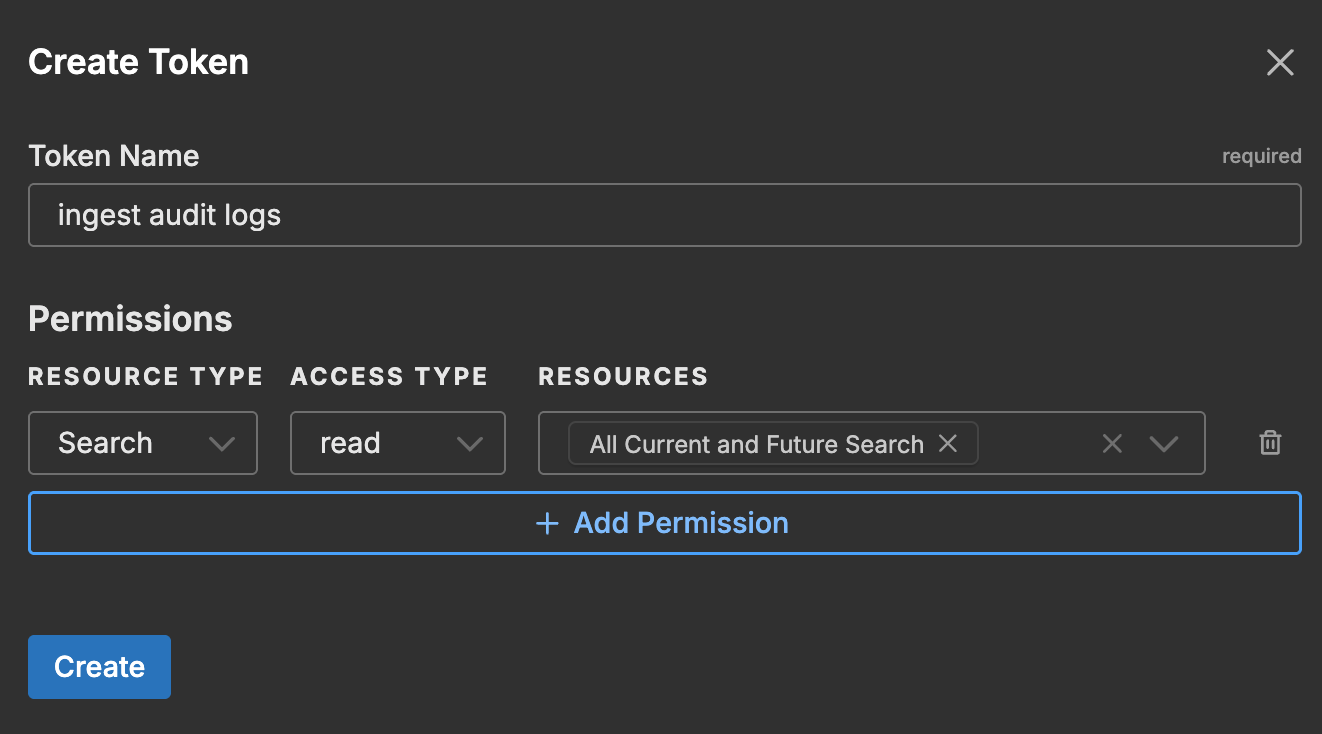
Step 1: Create an API Token
You need an API token with specific permissions to access audit logs via the Search API.
Create the Token
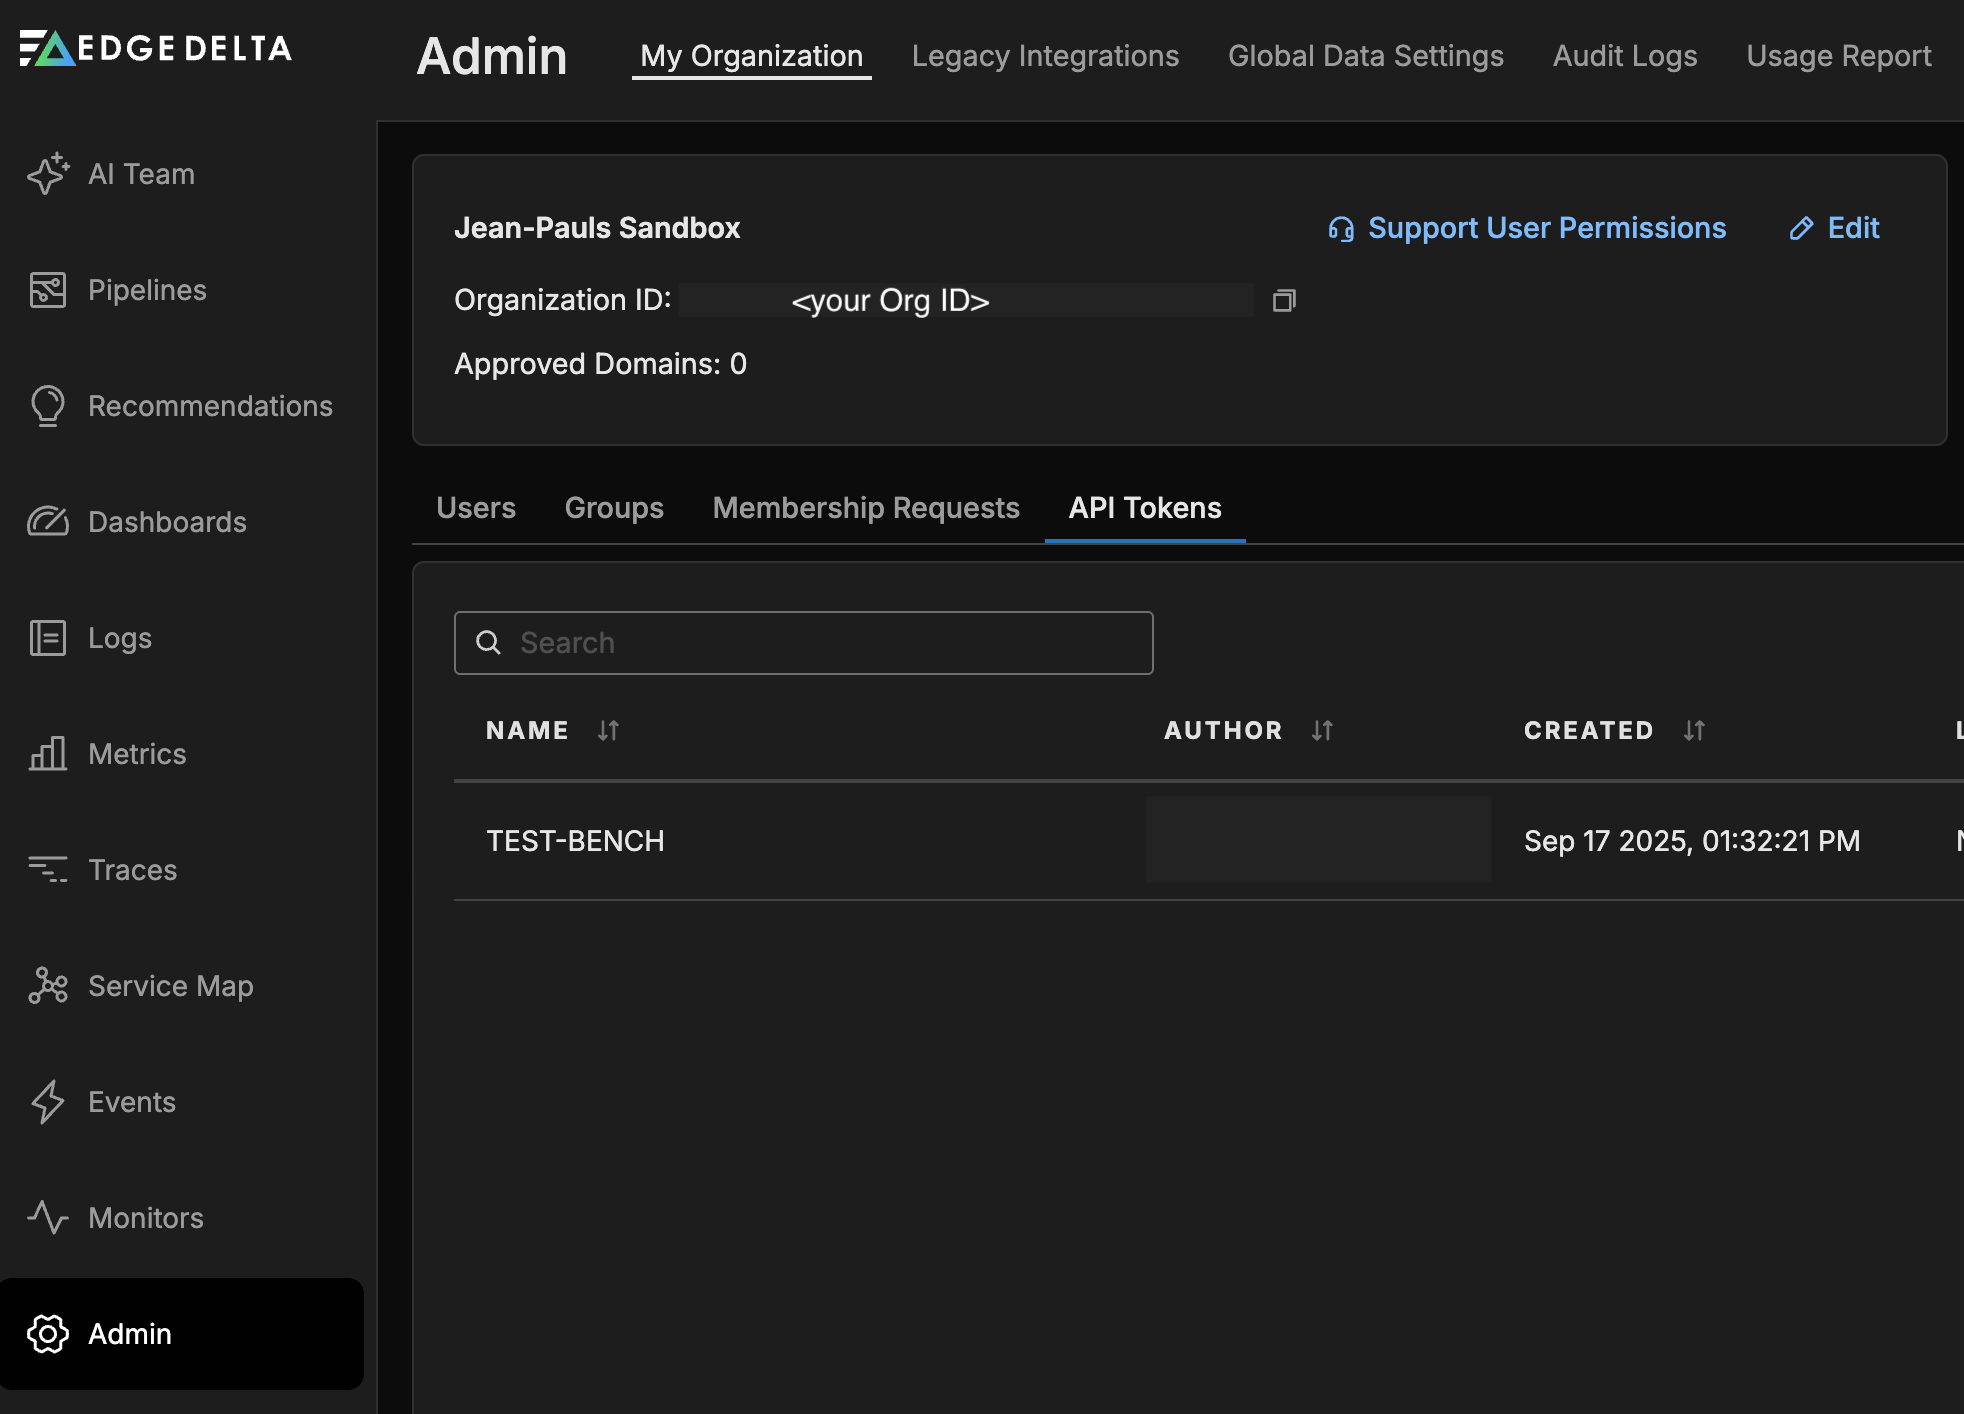
- Click Admin and select the My Organization tab.
- Click the API Tokens tab and click Create Token.
- Enter a descriptive token name (e.g.,
audit-log-ingestion).
Configure Permissions
Add the following permission to the token:
| Field | Value |
|---|---|
| Resource Type | Search |
| Access Type | Read |
| Resource Instance | All current and future search resources |
- Copy the access token and store it securely. You will need this for the pipeline configuration.
For more details on API token management, see Manage API Tokens.
Step 2: Get Your Organization ID
- In the Edge Delta Admin console, click Admin and select the My Organization tab.
- Copy your Organization ID from the page.

Step 3: Configure the Pipeline
Configure an Edge Delta pipeline to ingest audit logs using the HTTP Pull source. You can create the pipeline through the Edge Delta GUI or using YAML configuration.
Step 3.1: Add the HTTP Pull Source
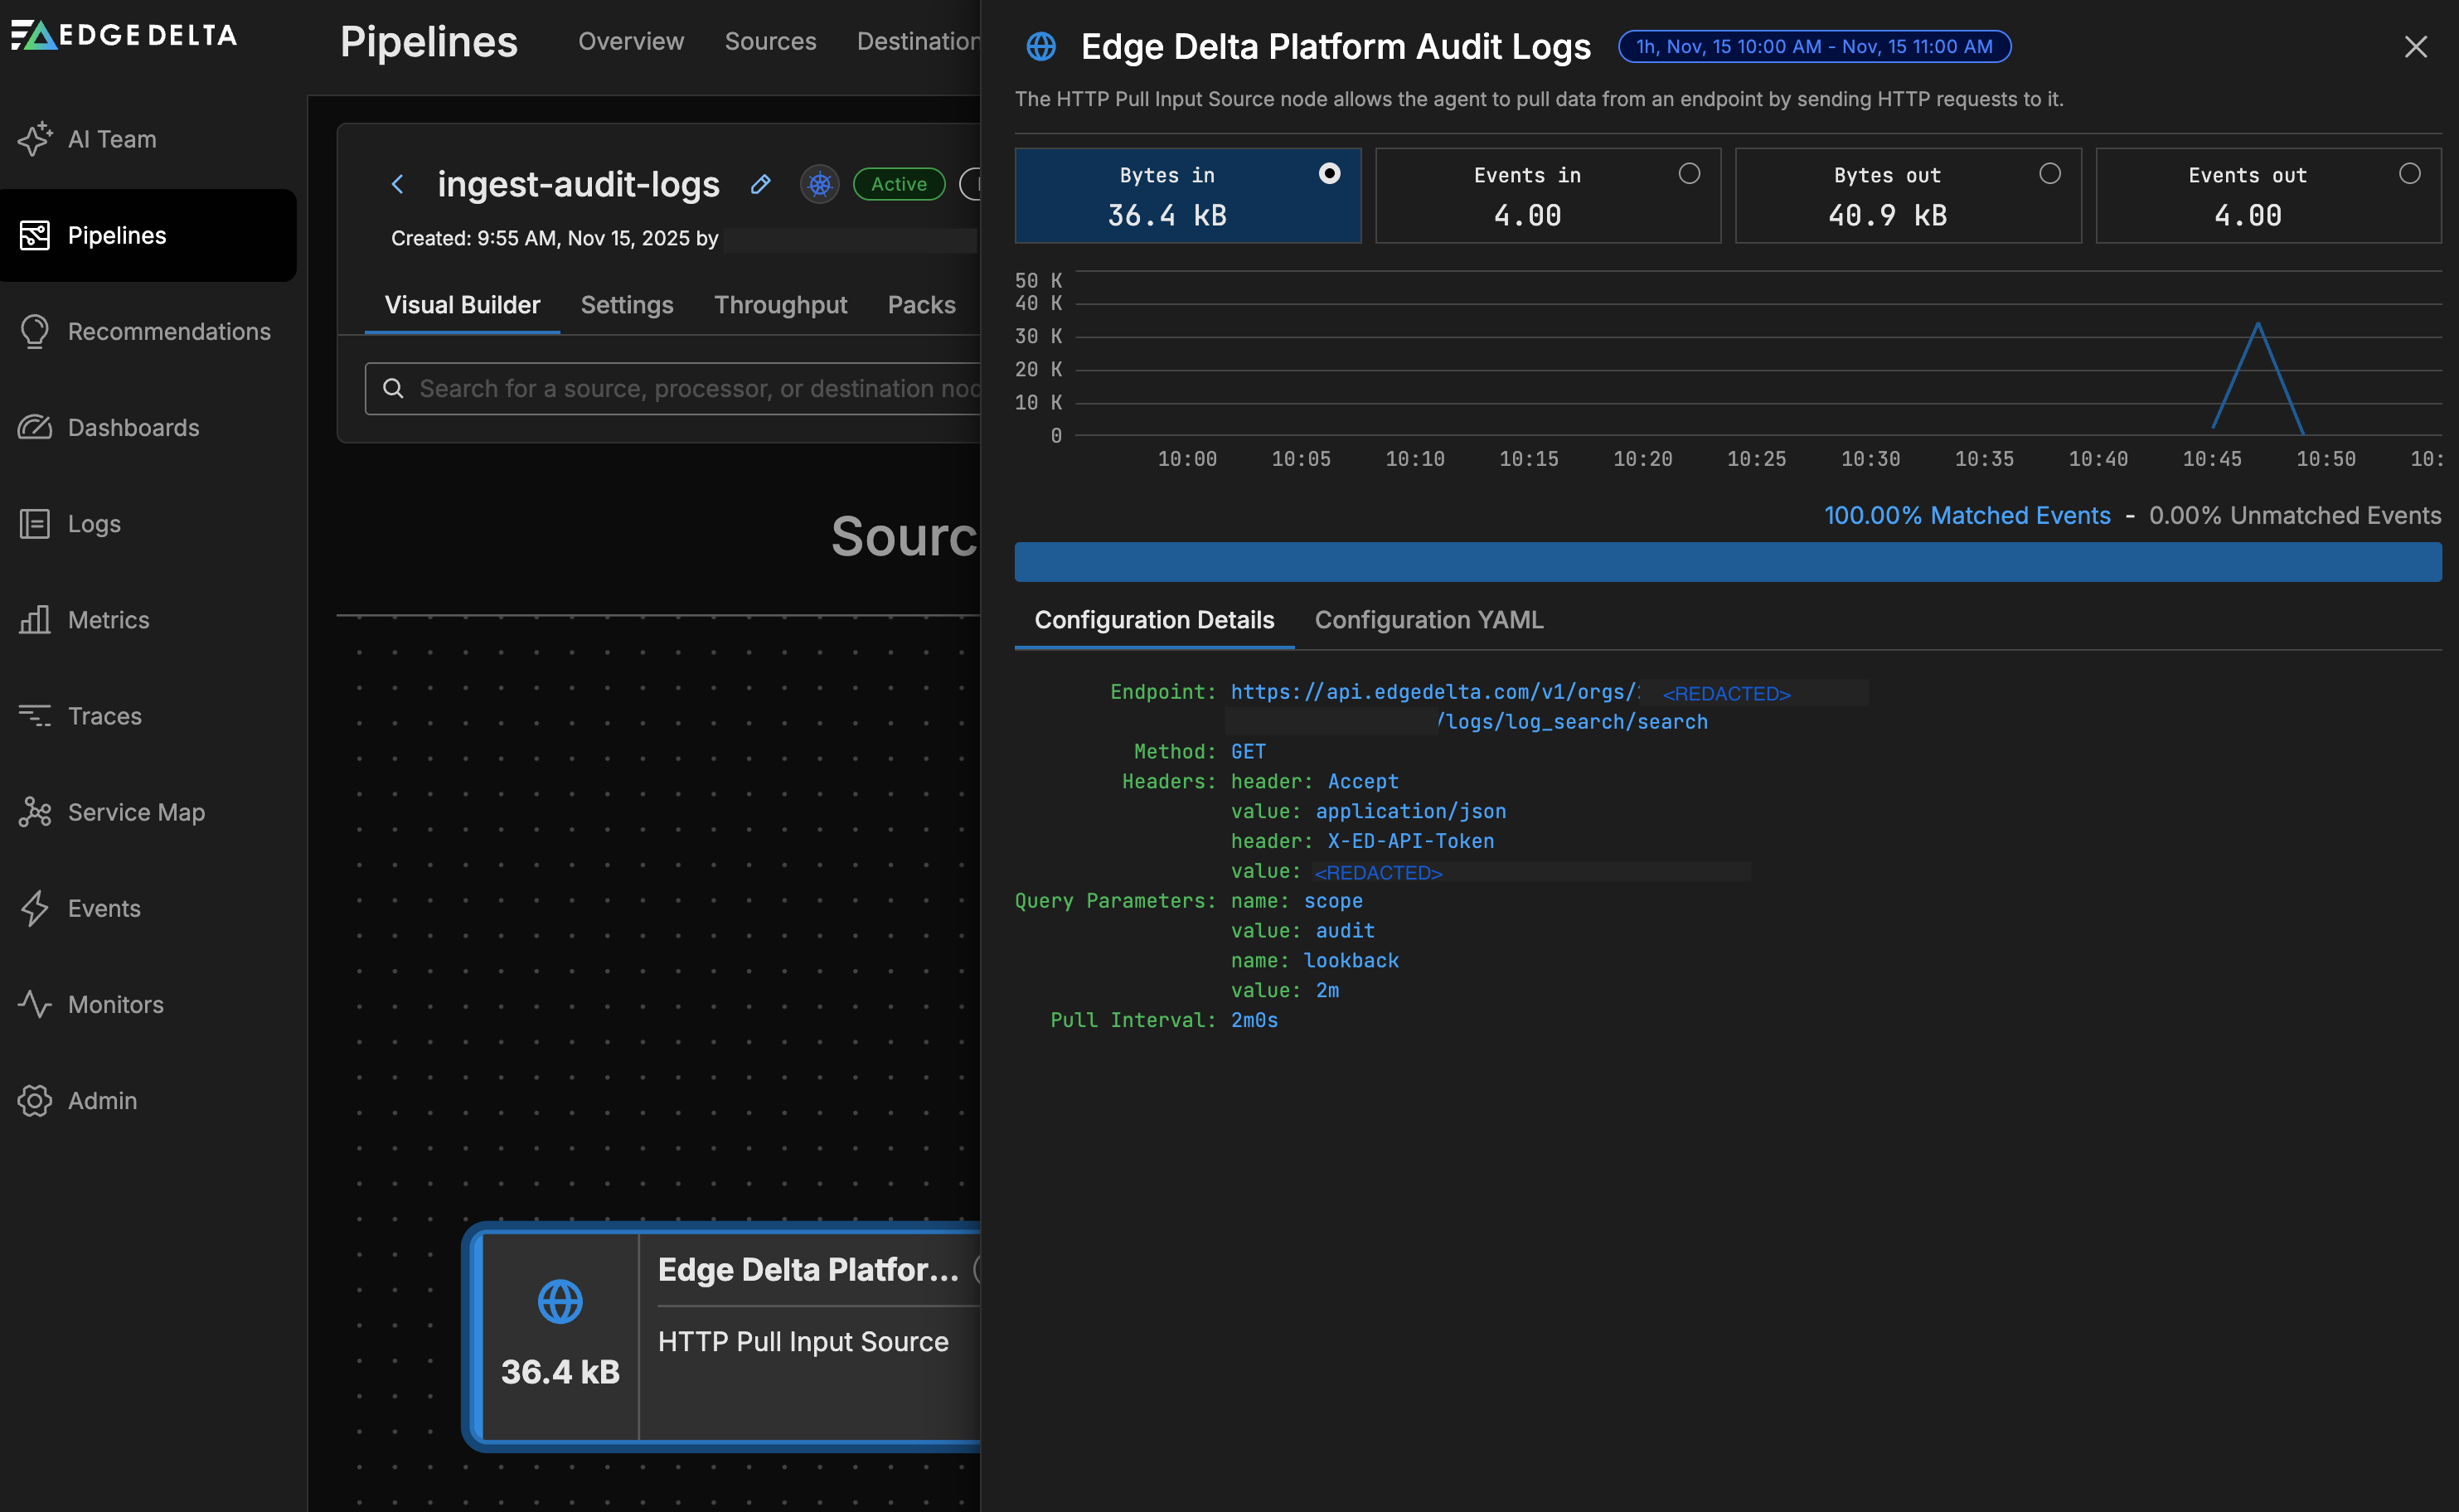
In the Edge Delta pipeline editor, add an HTTP Pull source node with the following configuration:
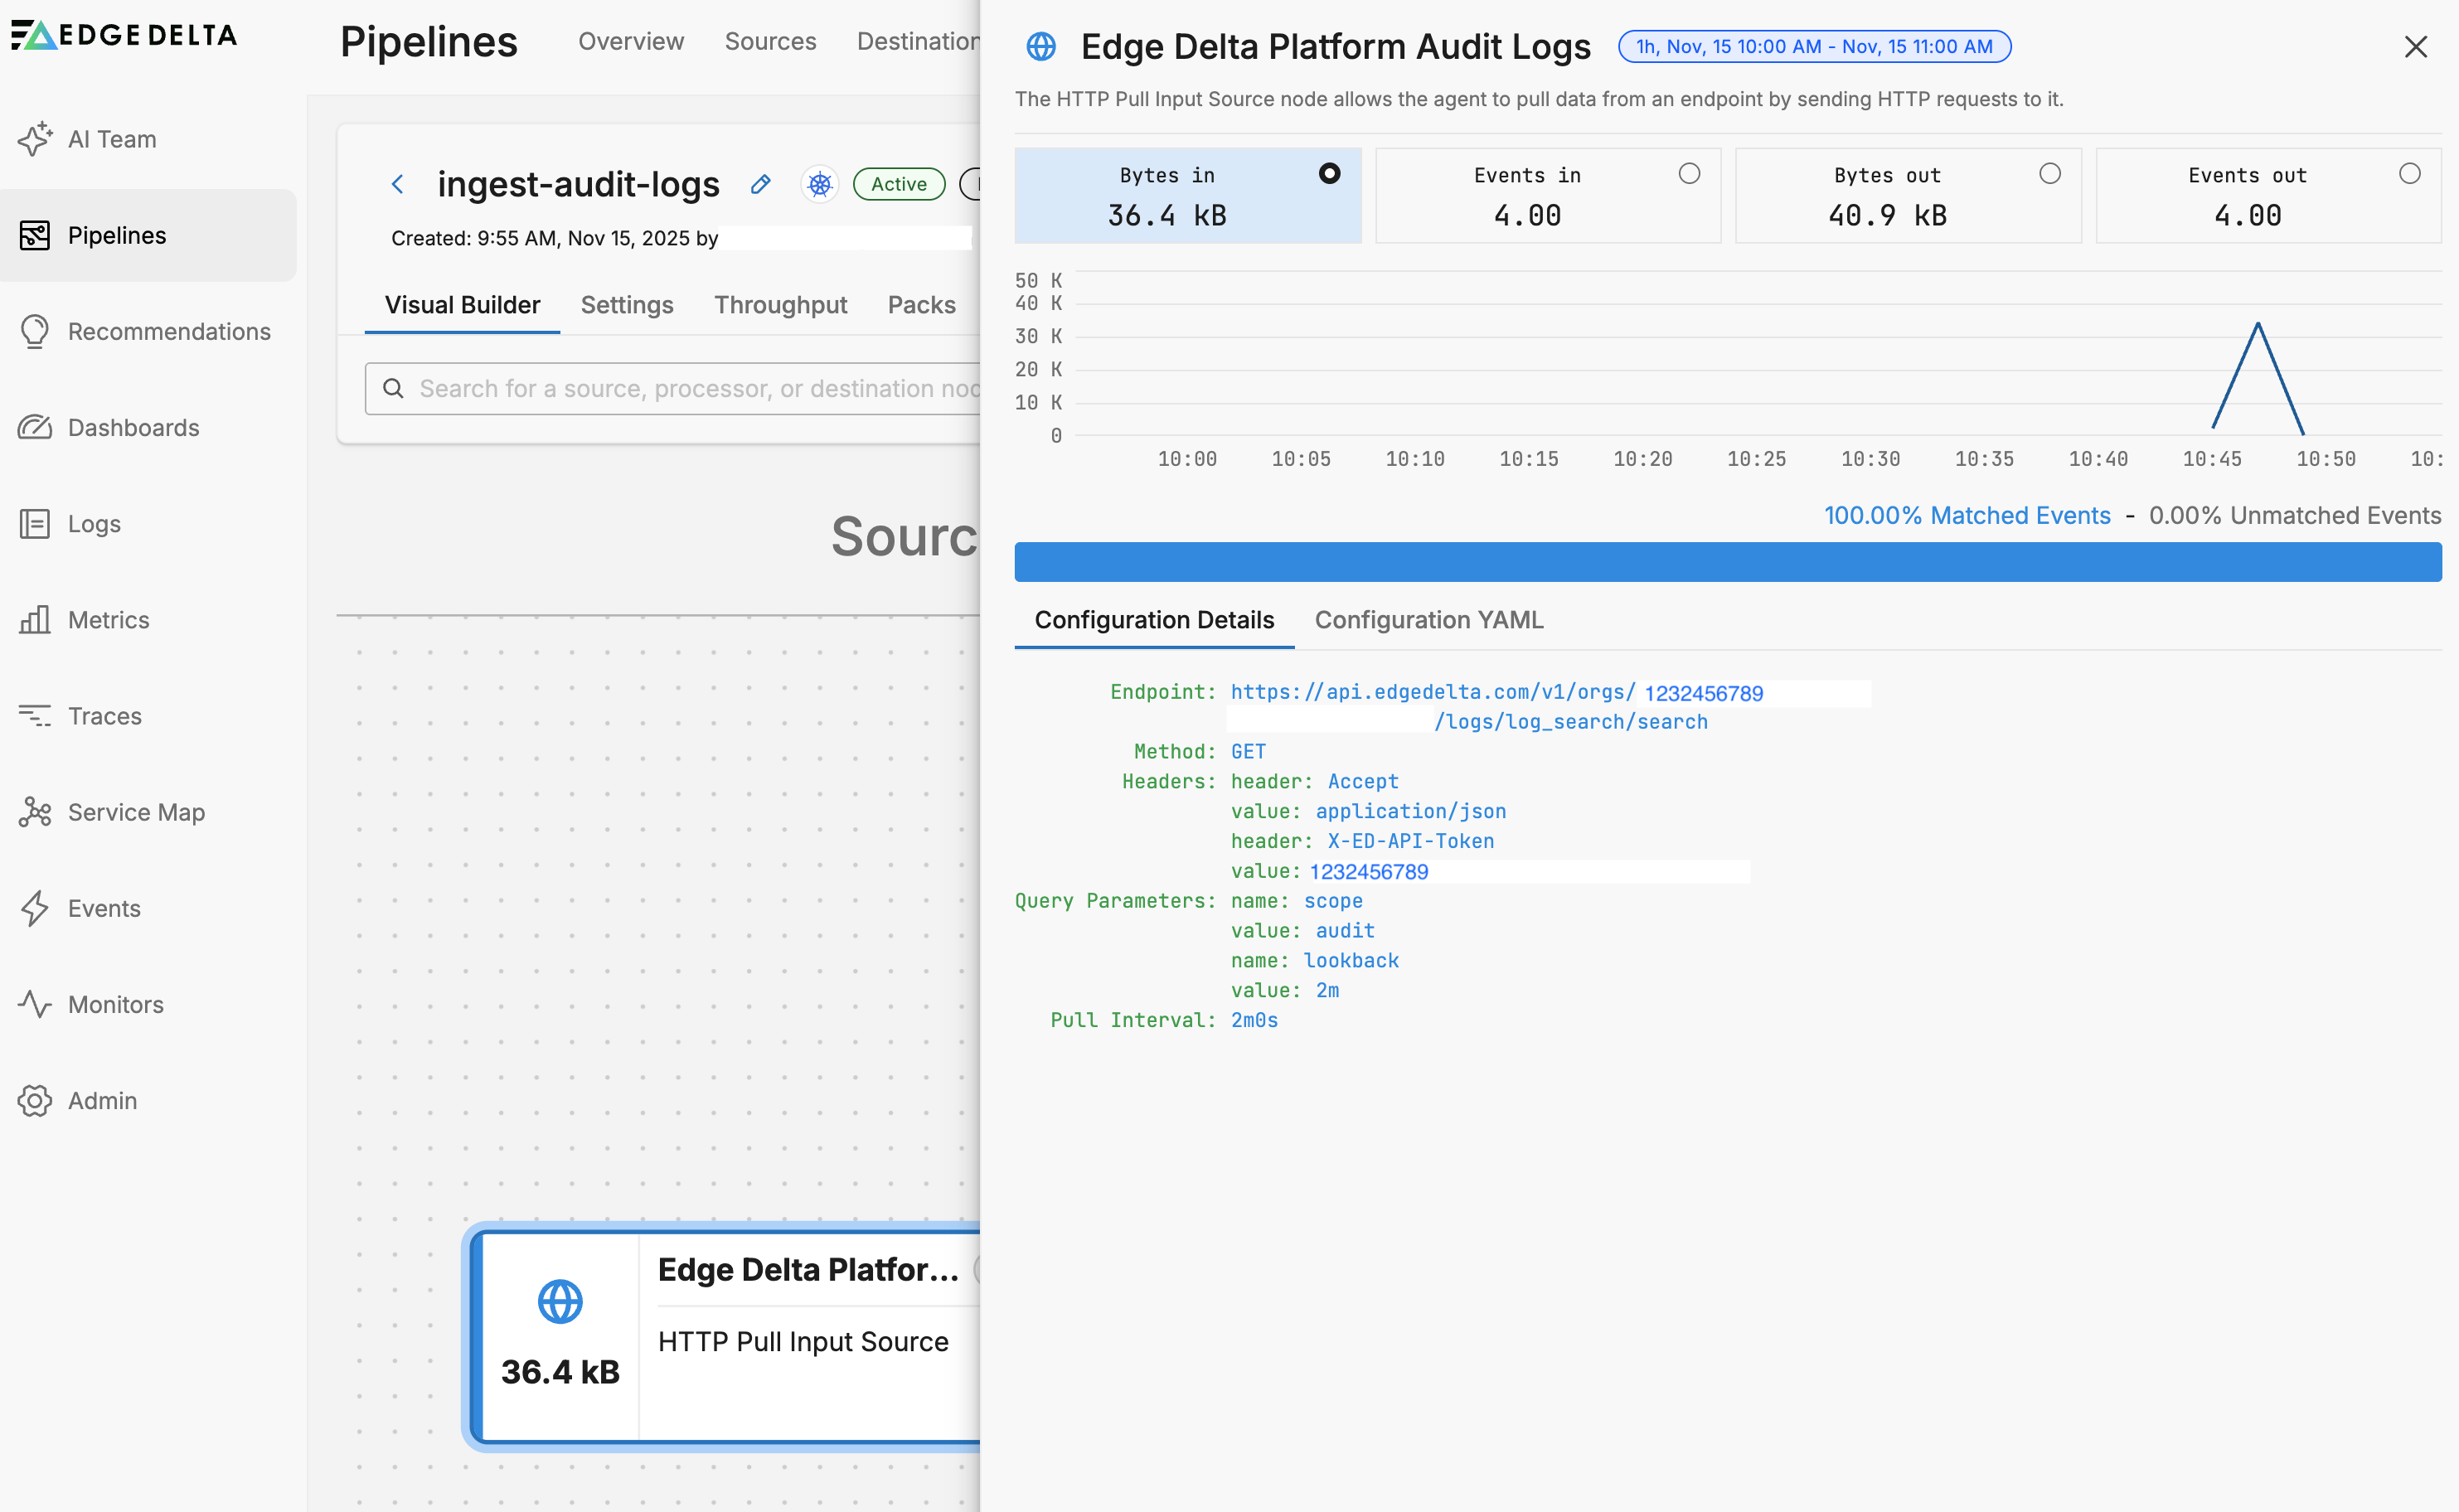
- name: audit_logs_source
  type: http_pull_input
  user_description: Edge Delta Platform Audit Logs
  endpoint: https://api.edgedelta.com/v1/orgs/<YOUR_ORG_ID>/logs/log_search/search
  headers:
  - header: Accept
    value: application/json
  - header: X-ED-API-Token
    value: <YOUR_API_TOKEN>
  method: GET
  parameters:
  - name: scope
    value: audit
  - name: lookback
    value: 2m
  pull_interval: 2m0s
Configuration Parameters:
| Field | Value | Description |
|---|---|---|
endpoint | https://api.edgedelta.com/v1/orgs/<YOUR_ORG_ID>/logs/log_search/search | Replace <YOUR_ORG_ID> with your Organization ID |
X-ED-API-Token | <YOUR_API_TOKEN> | Replace with your API token from Step 1 |
scope | audit | Filters for audit logs only |
lookback | 2m | Retrieves logs from the last 2 minutes |
pull_interval | 2m0s | Pulls data every 2 minutes |
Important: Ensure the lookback duration matches or slightly exceeds the pull_interval to avoid gaps in data collection.
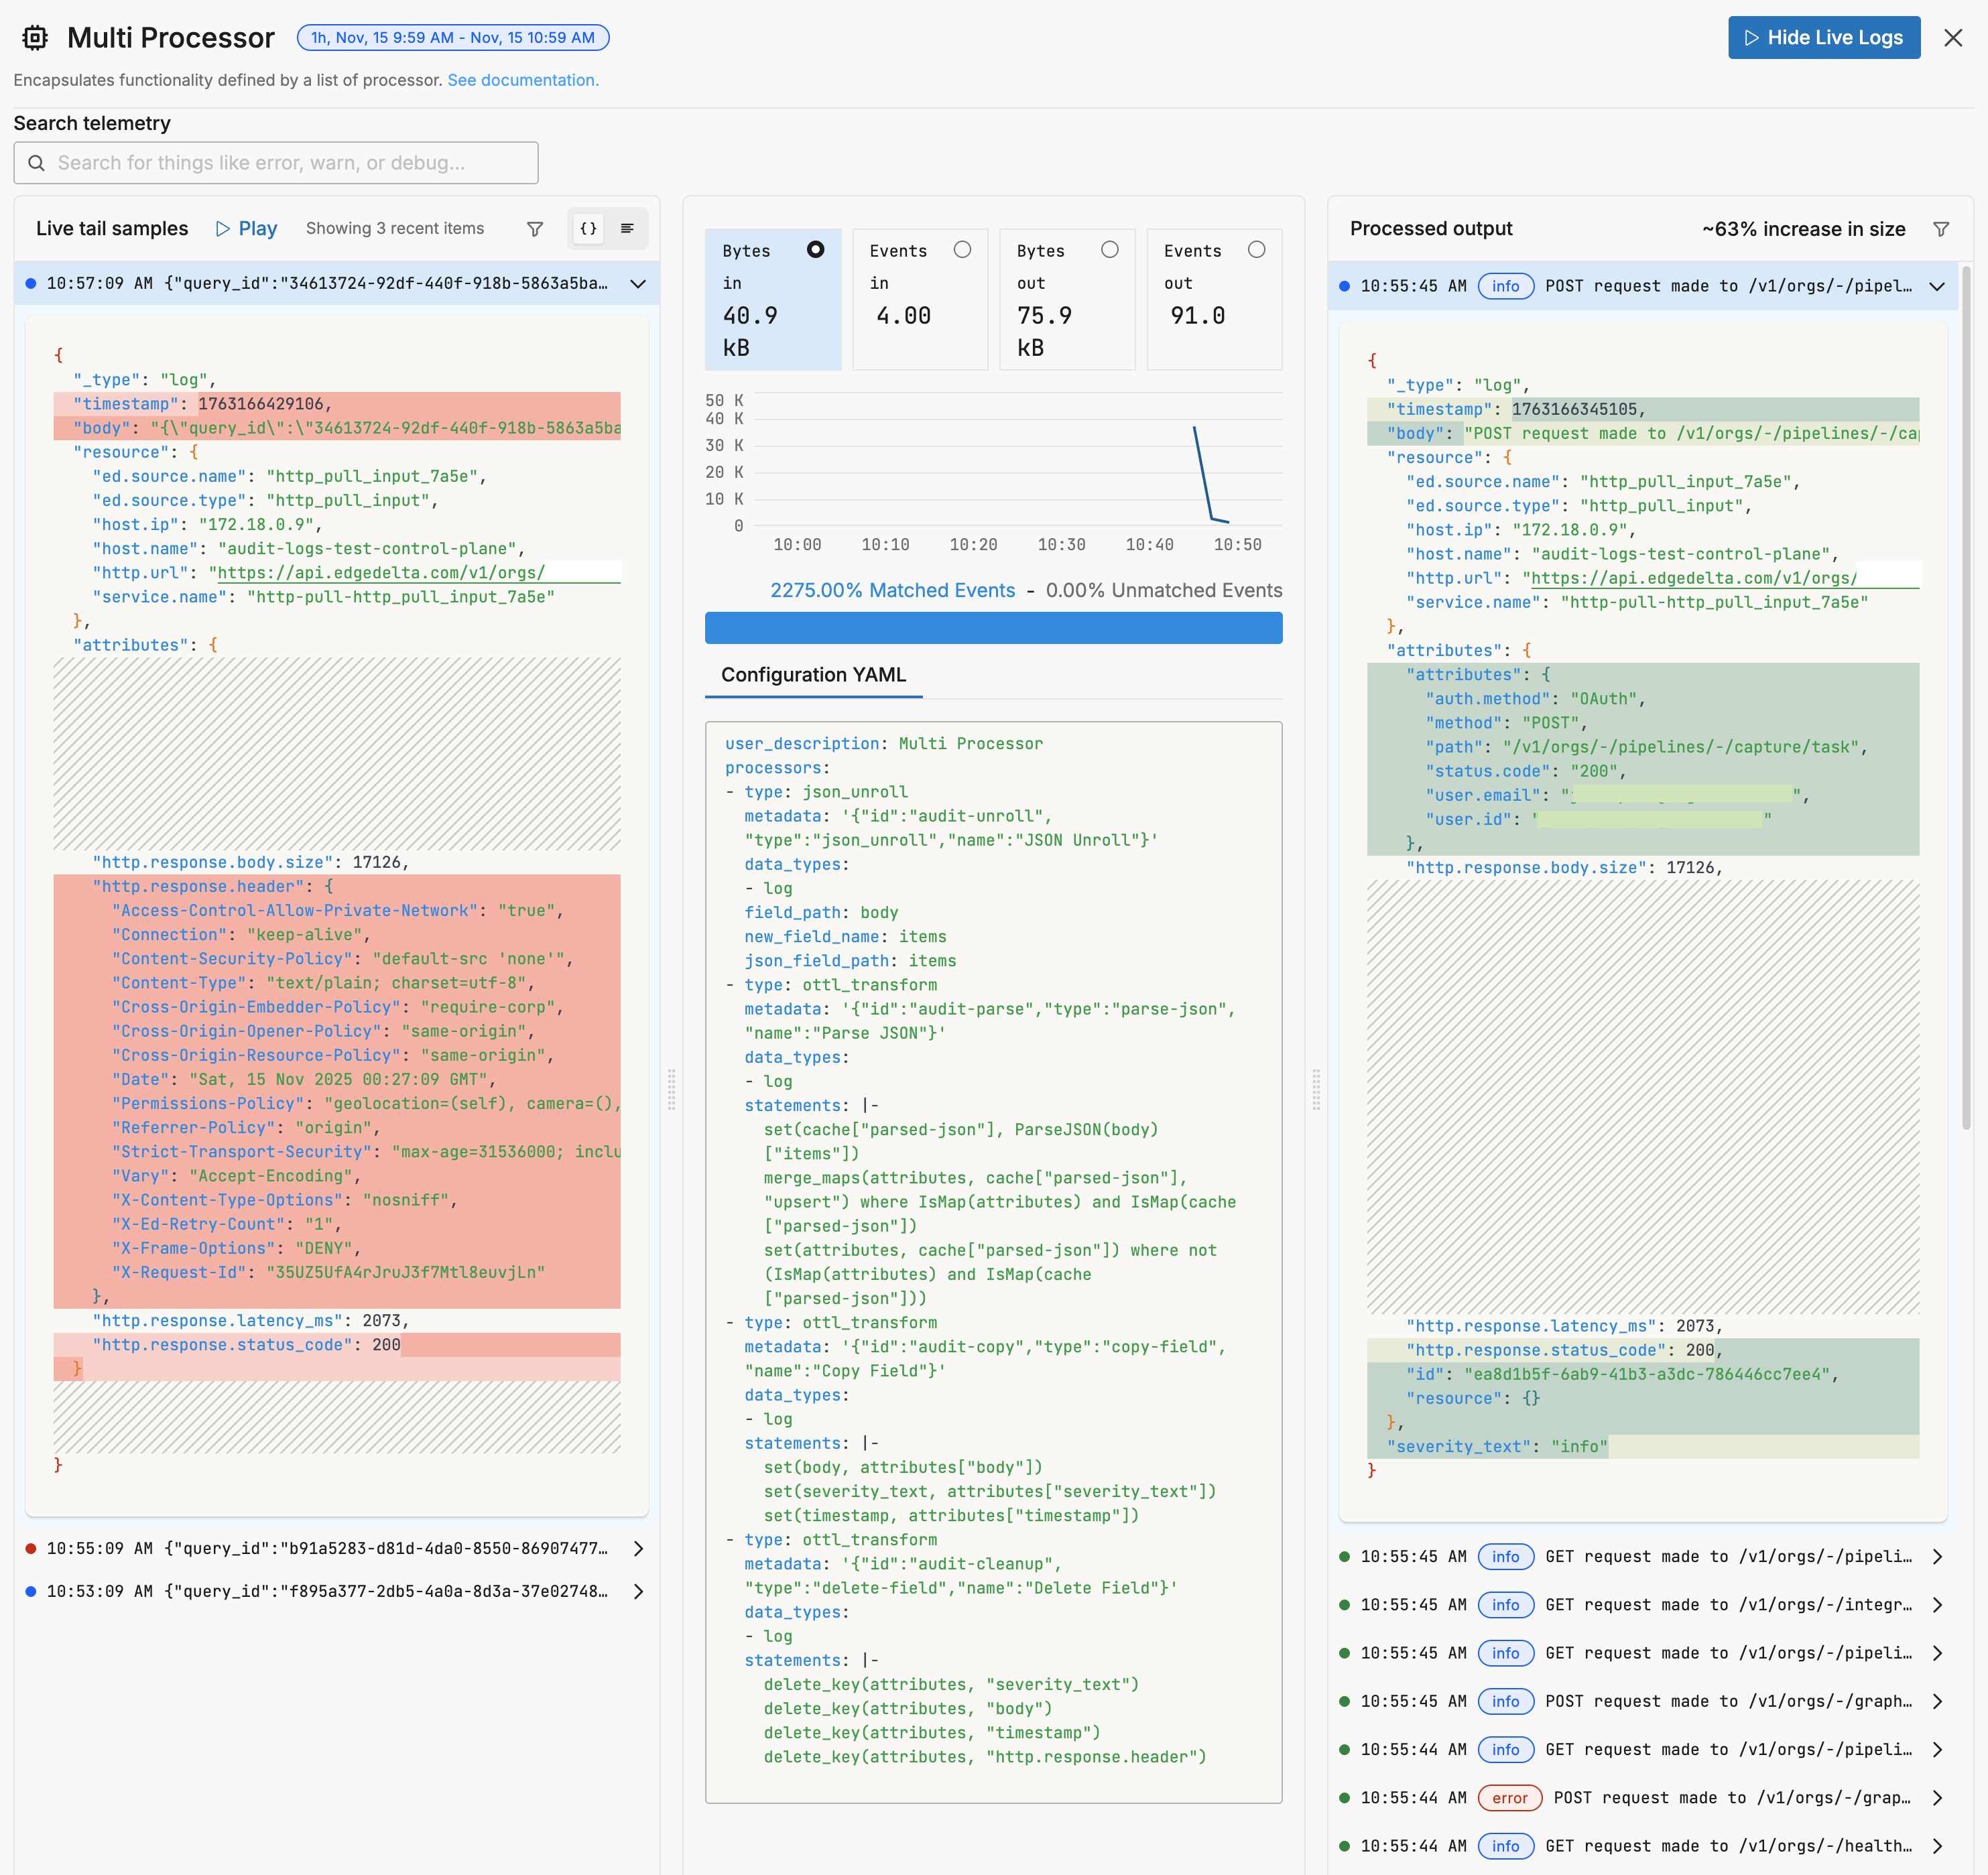
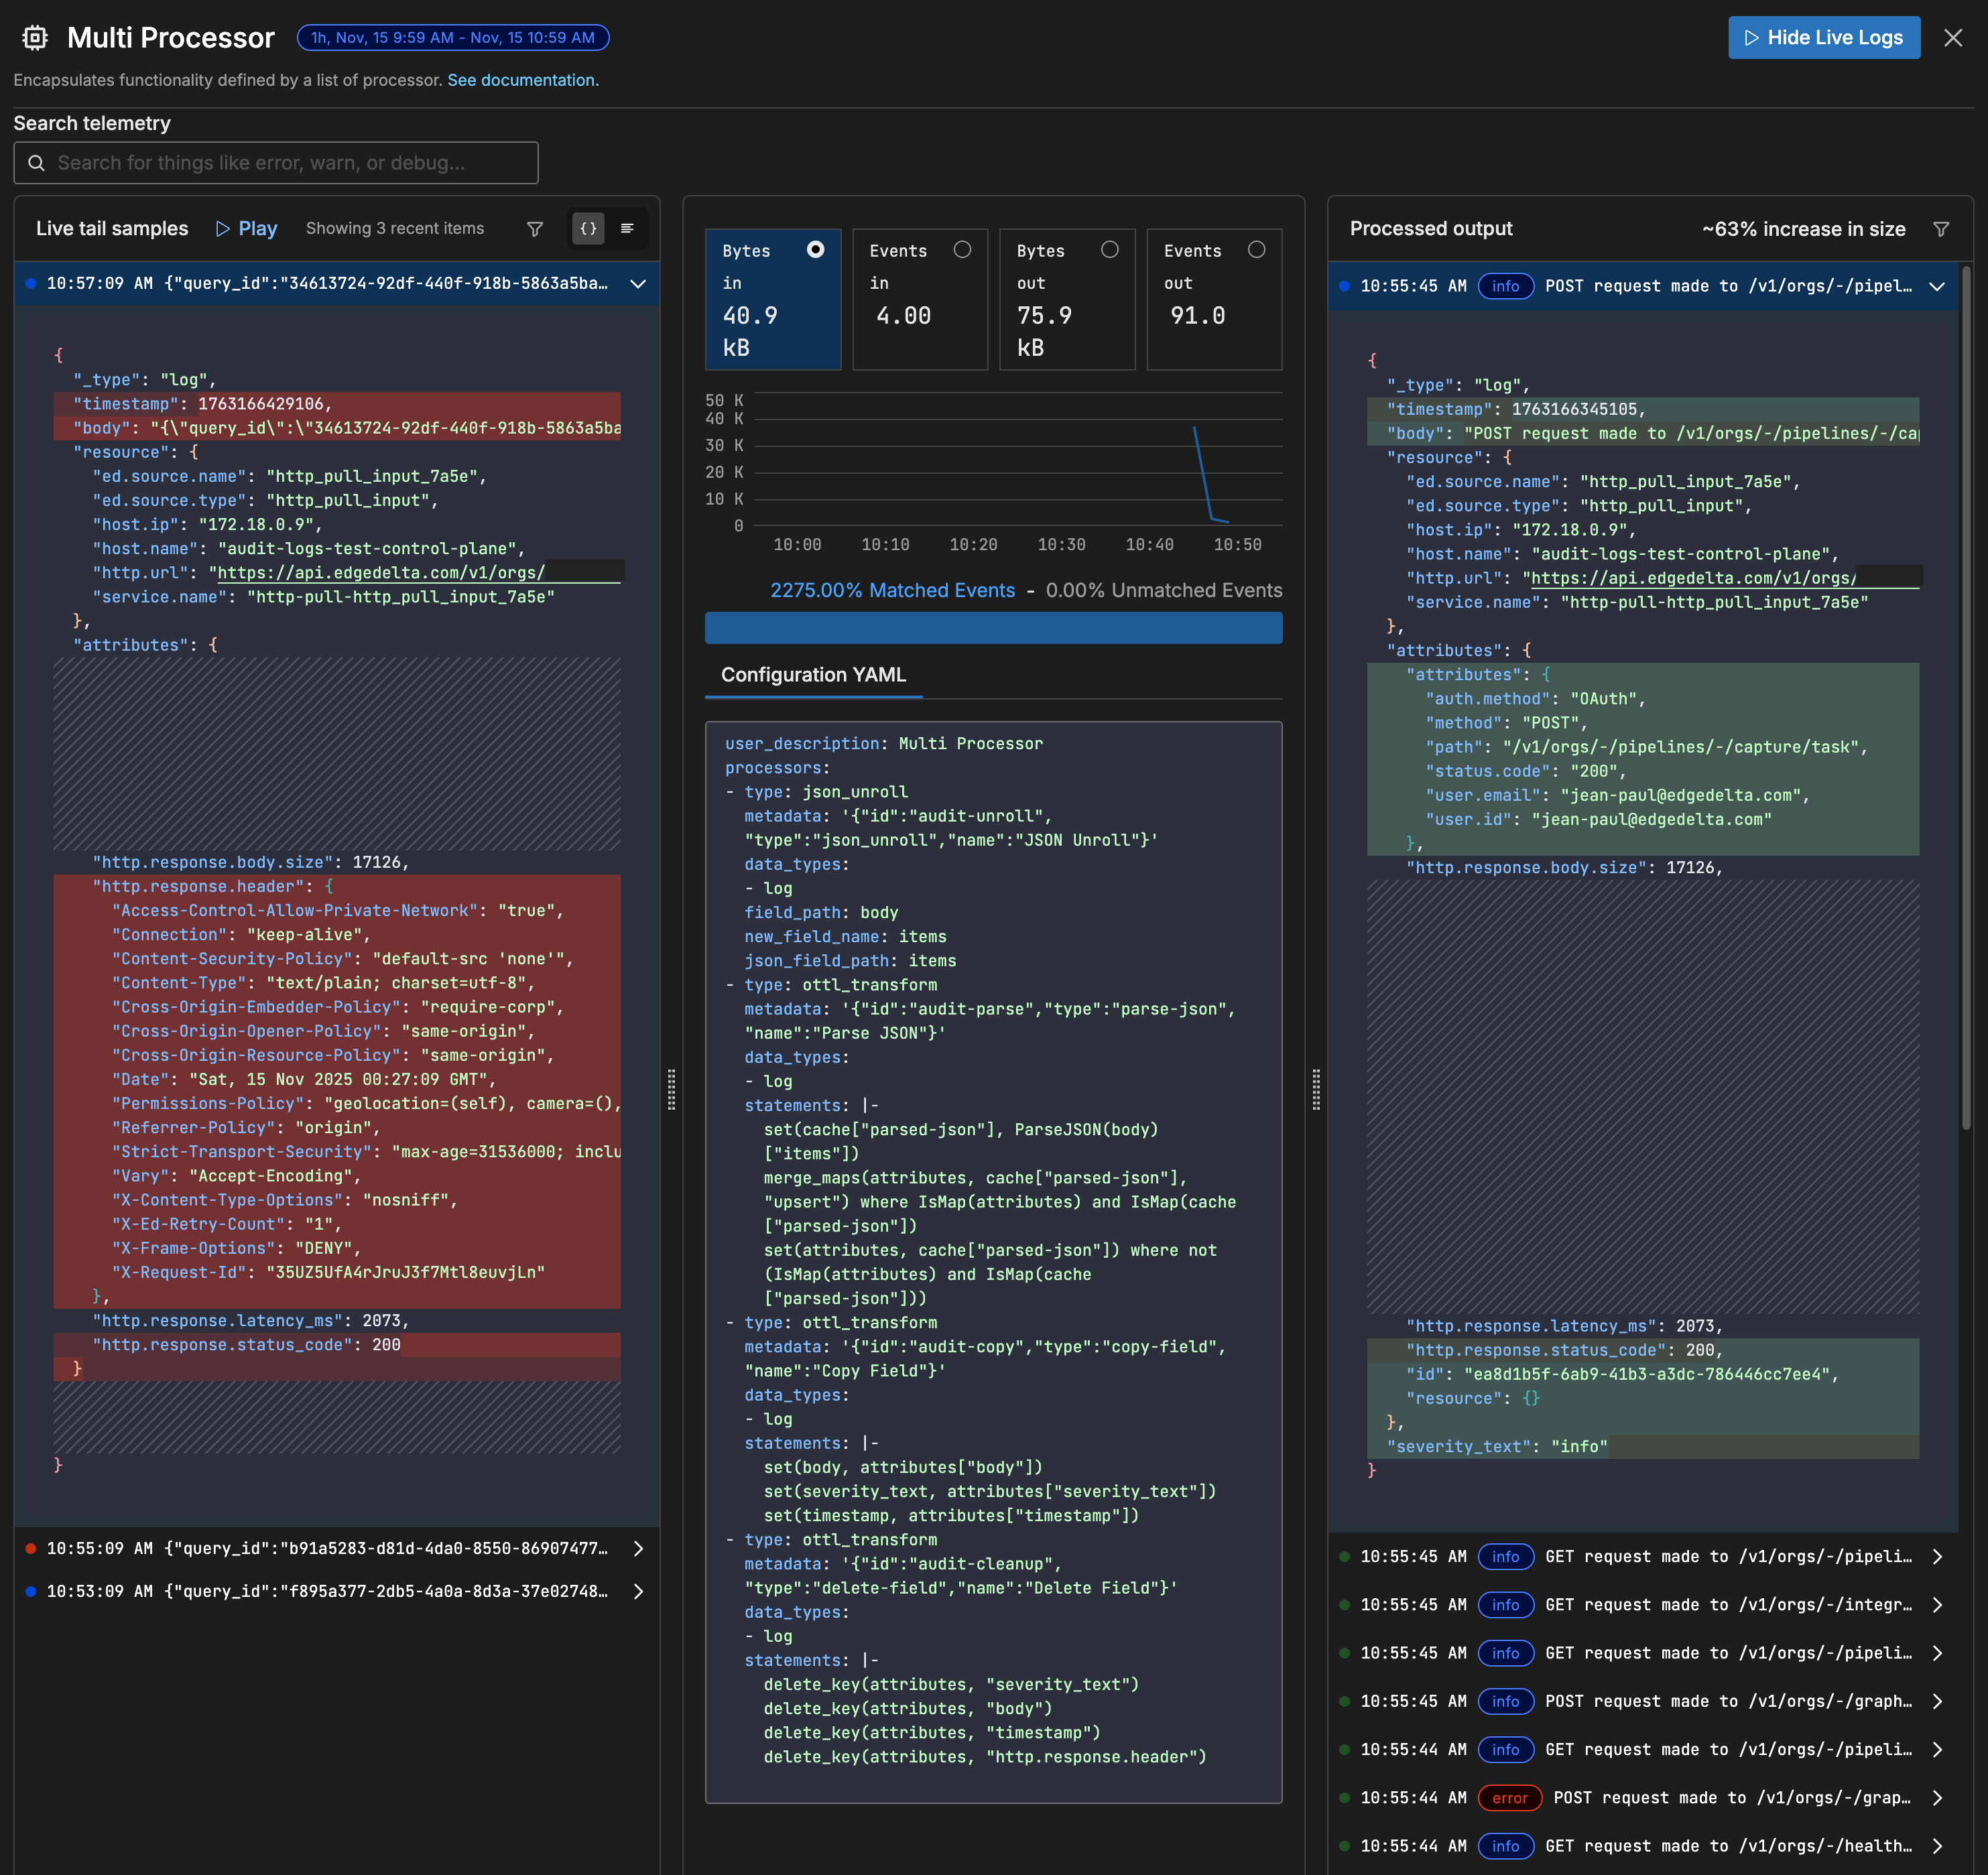
Step 3.2: Add Processors to Transform Audit Logs
After adding the source, connect it to a processor sequence that extracts and transforms the audit log data.
Add the following processors in order:
1. JSON Unroll Processor
Extracts individual audit log entries from the API response array:
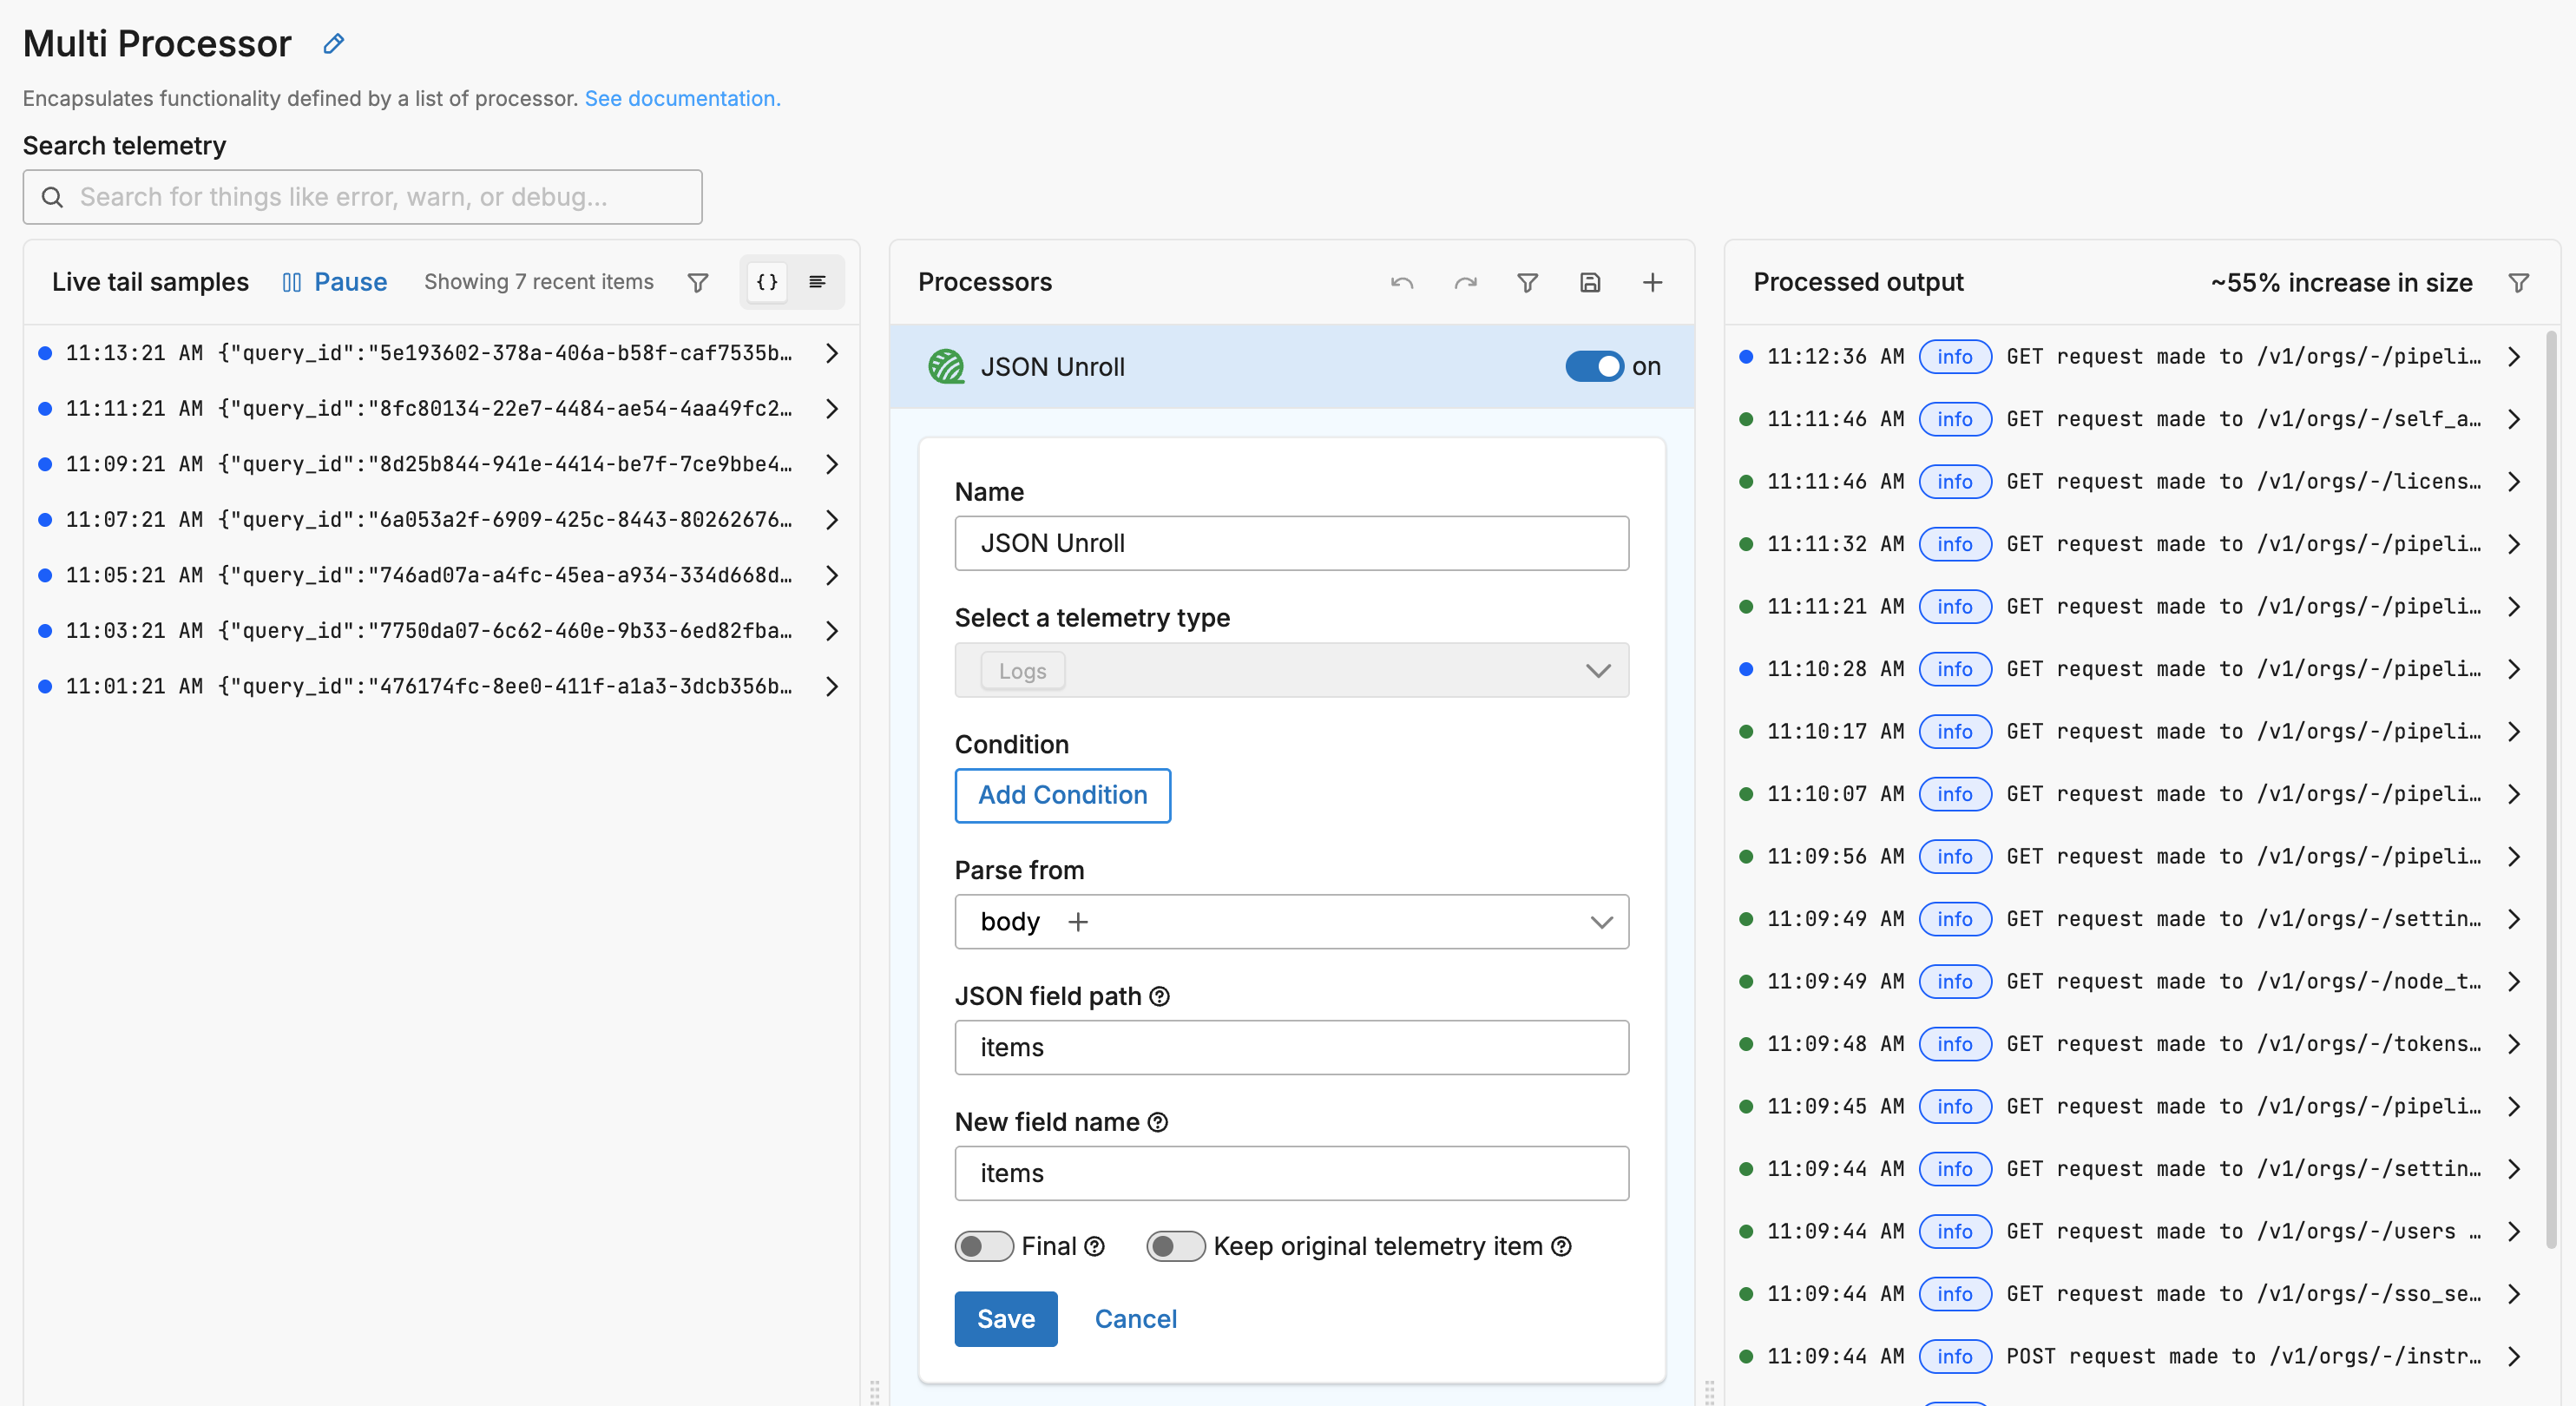
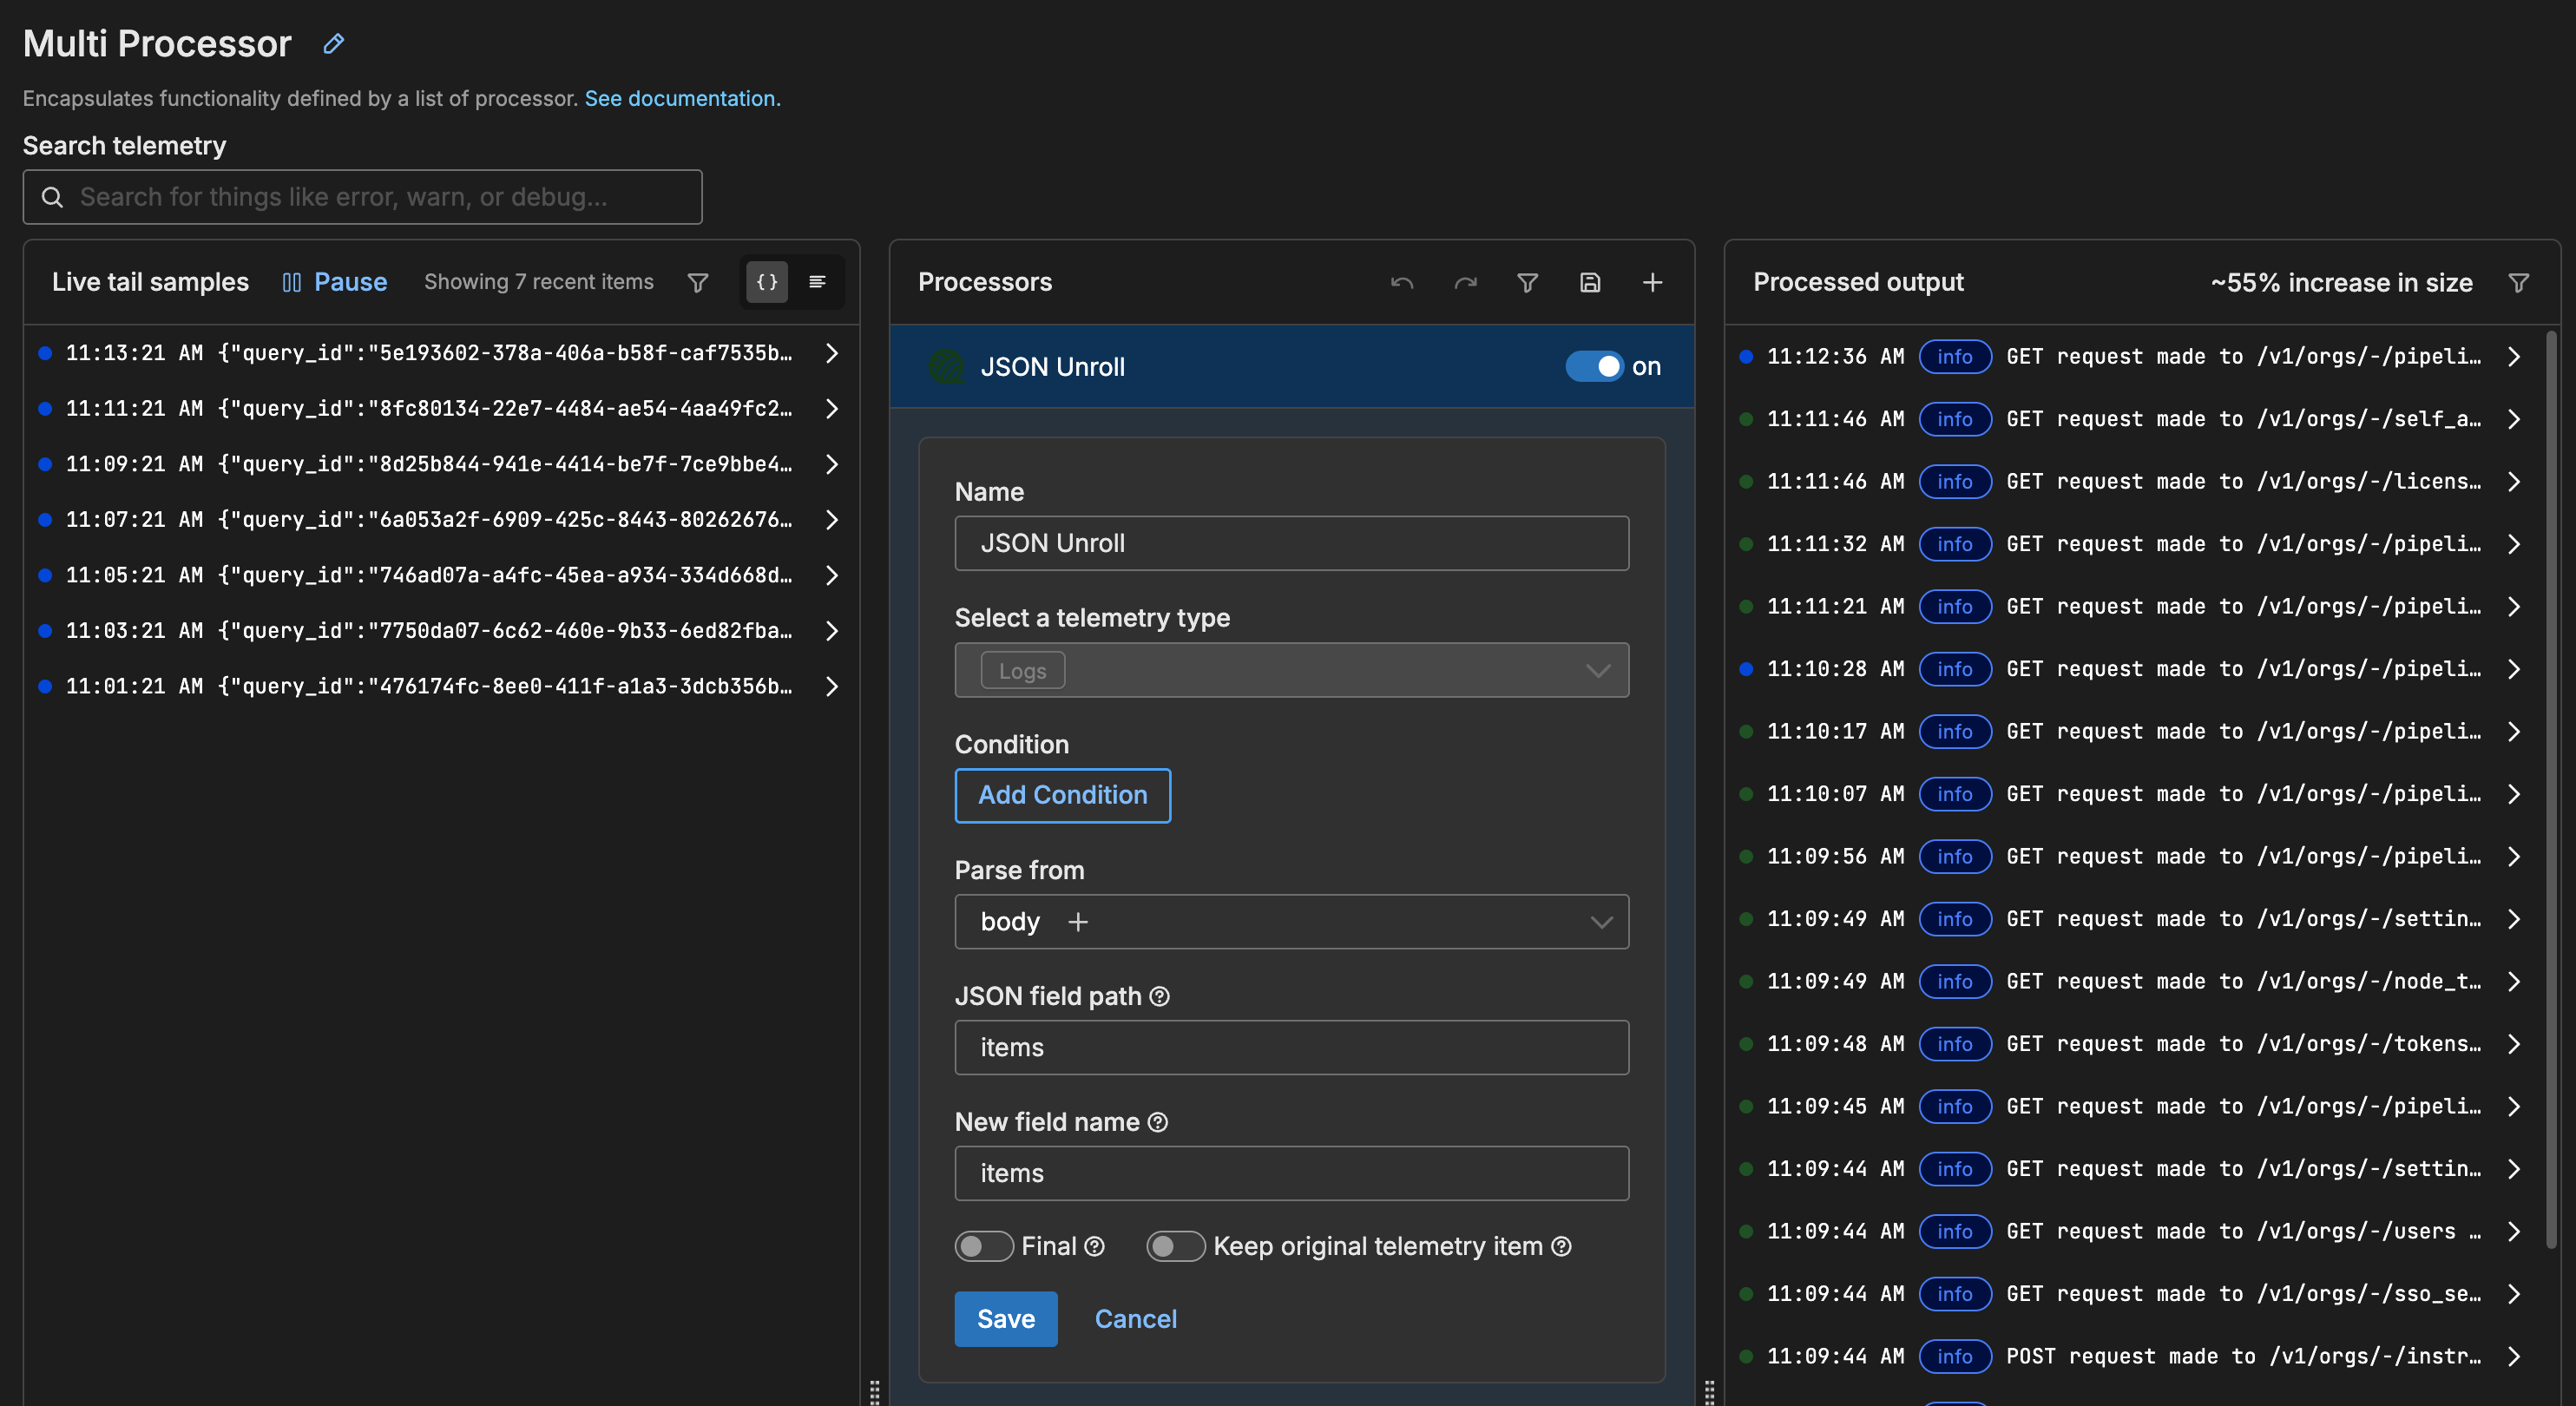
- type: json_unroll
  data_types:
  - log
  field_path: body
  new_field_name: items
  json_field_path: items
2. Parse JSON Transform
Parses each log entry and merges fields into attributes:
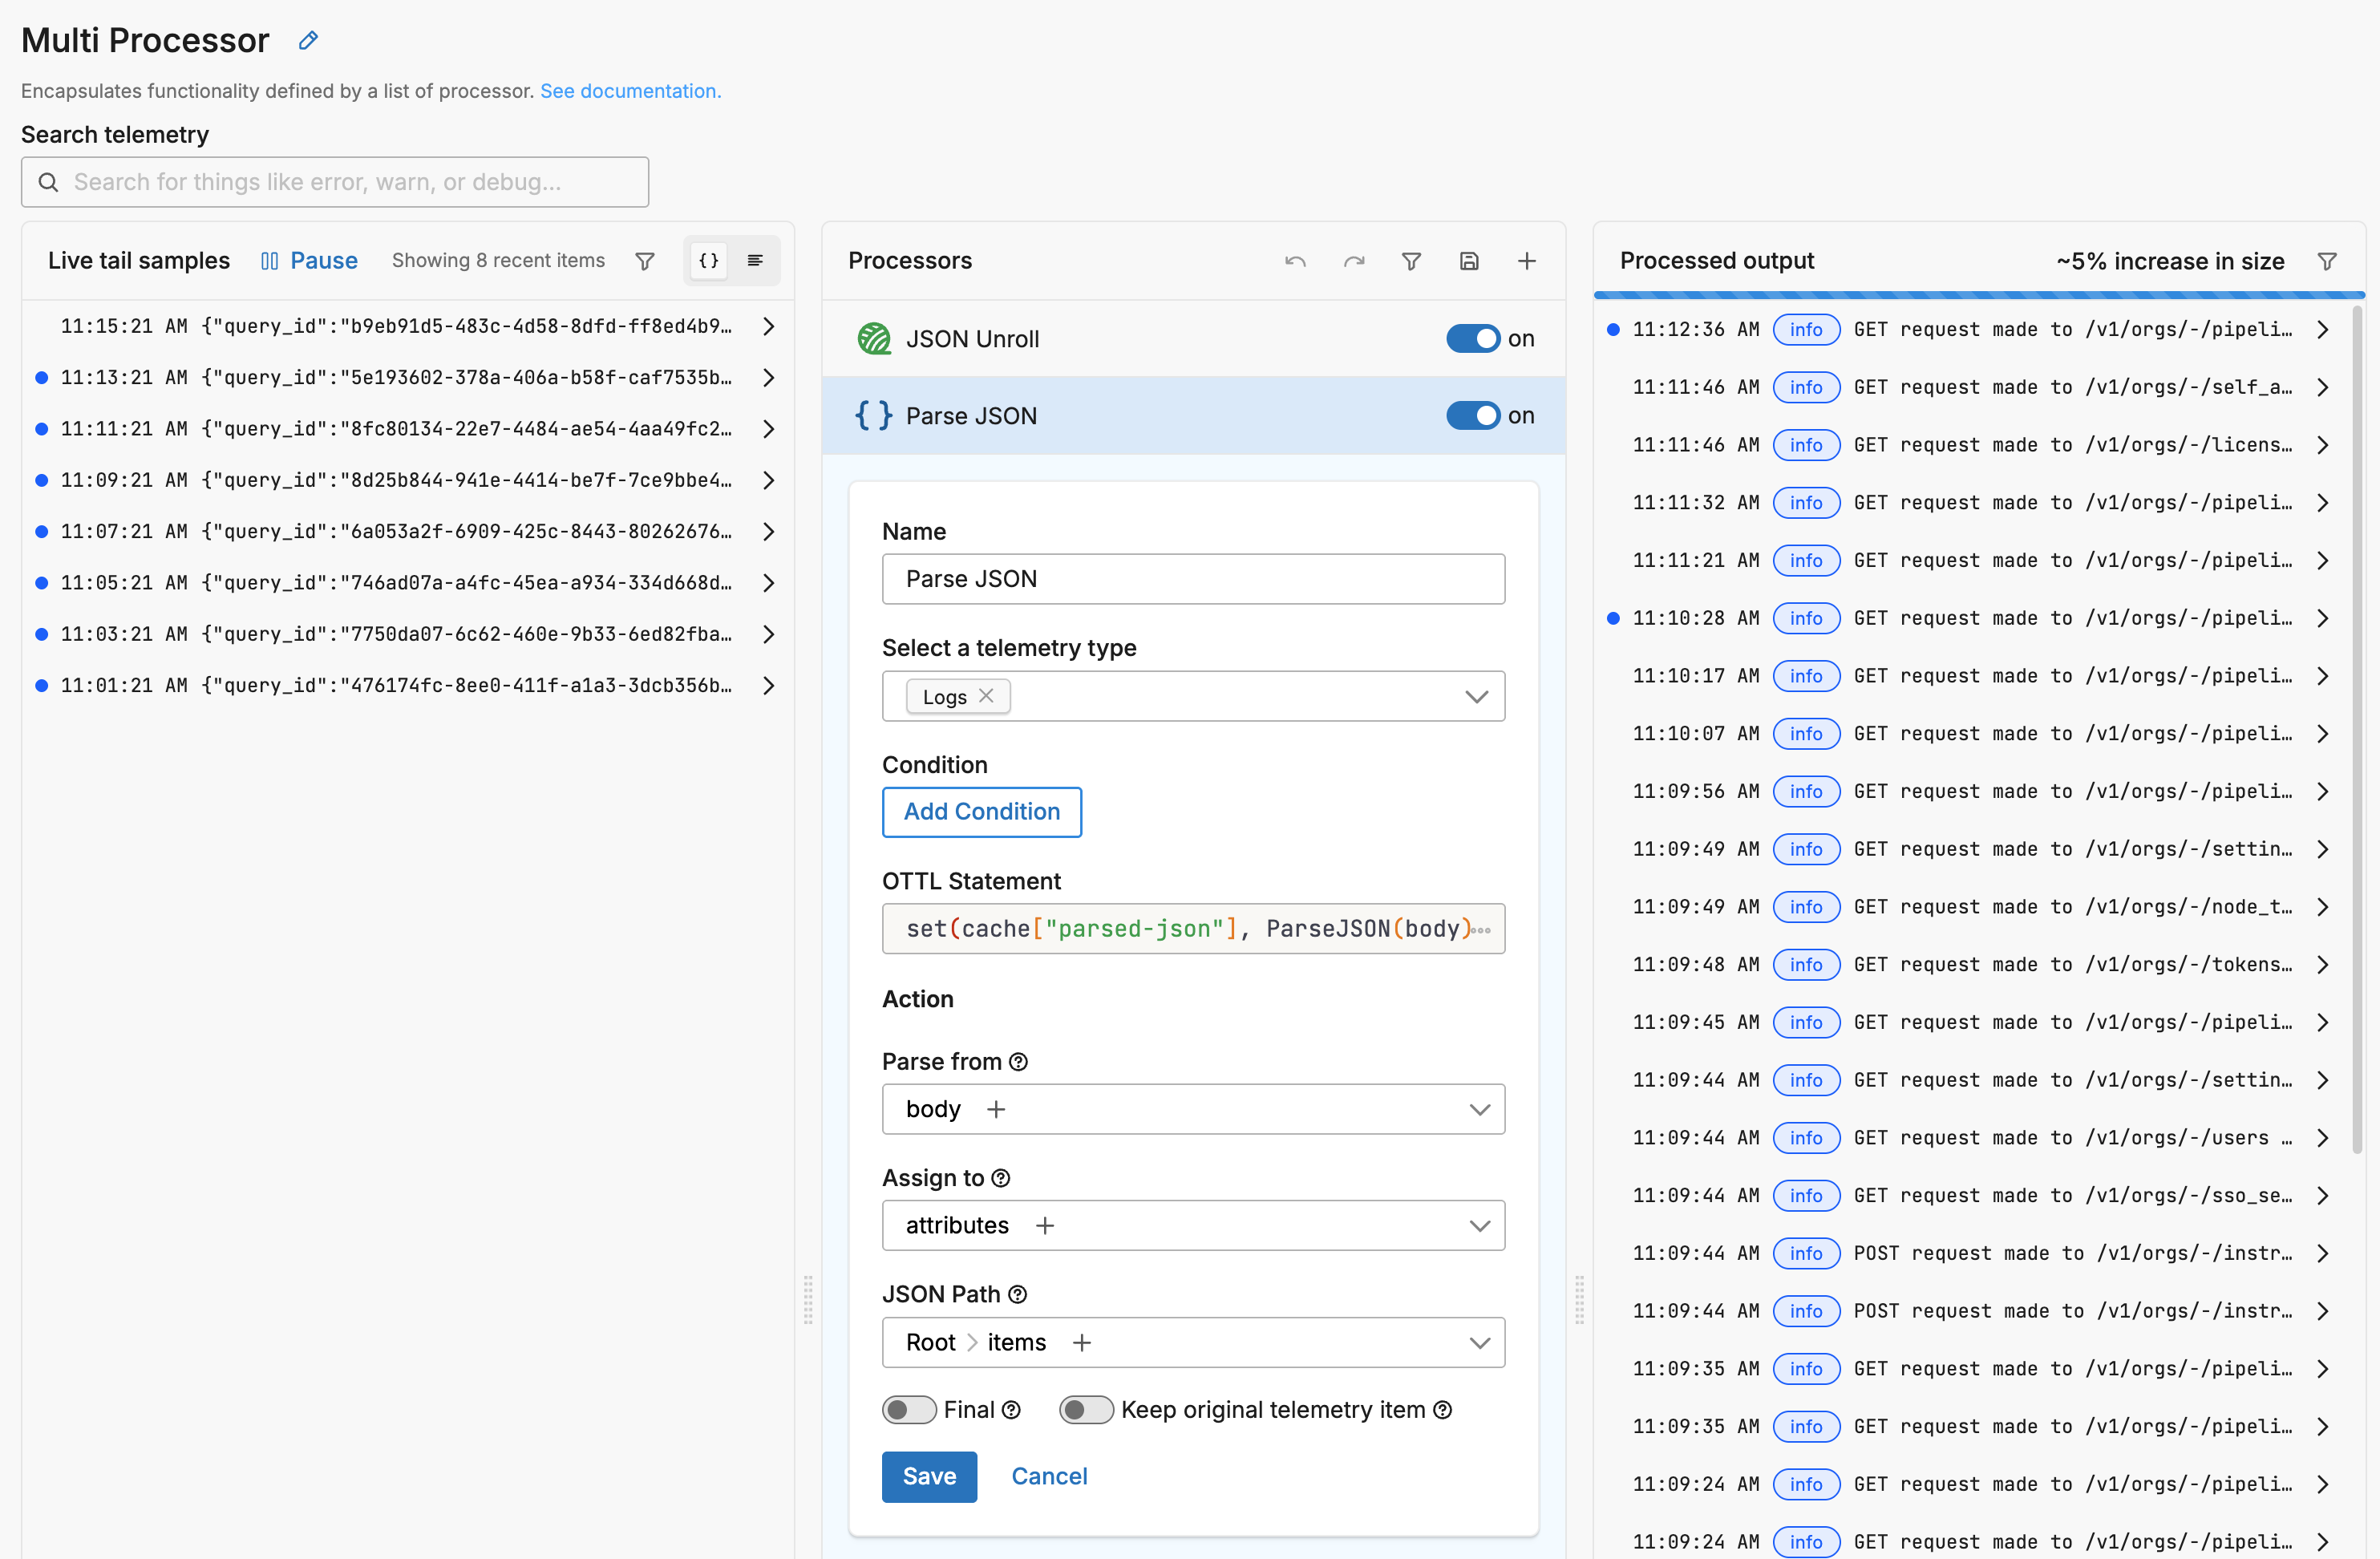
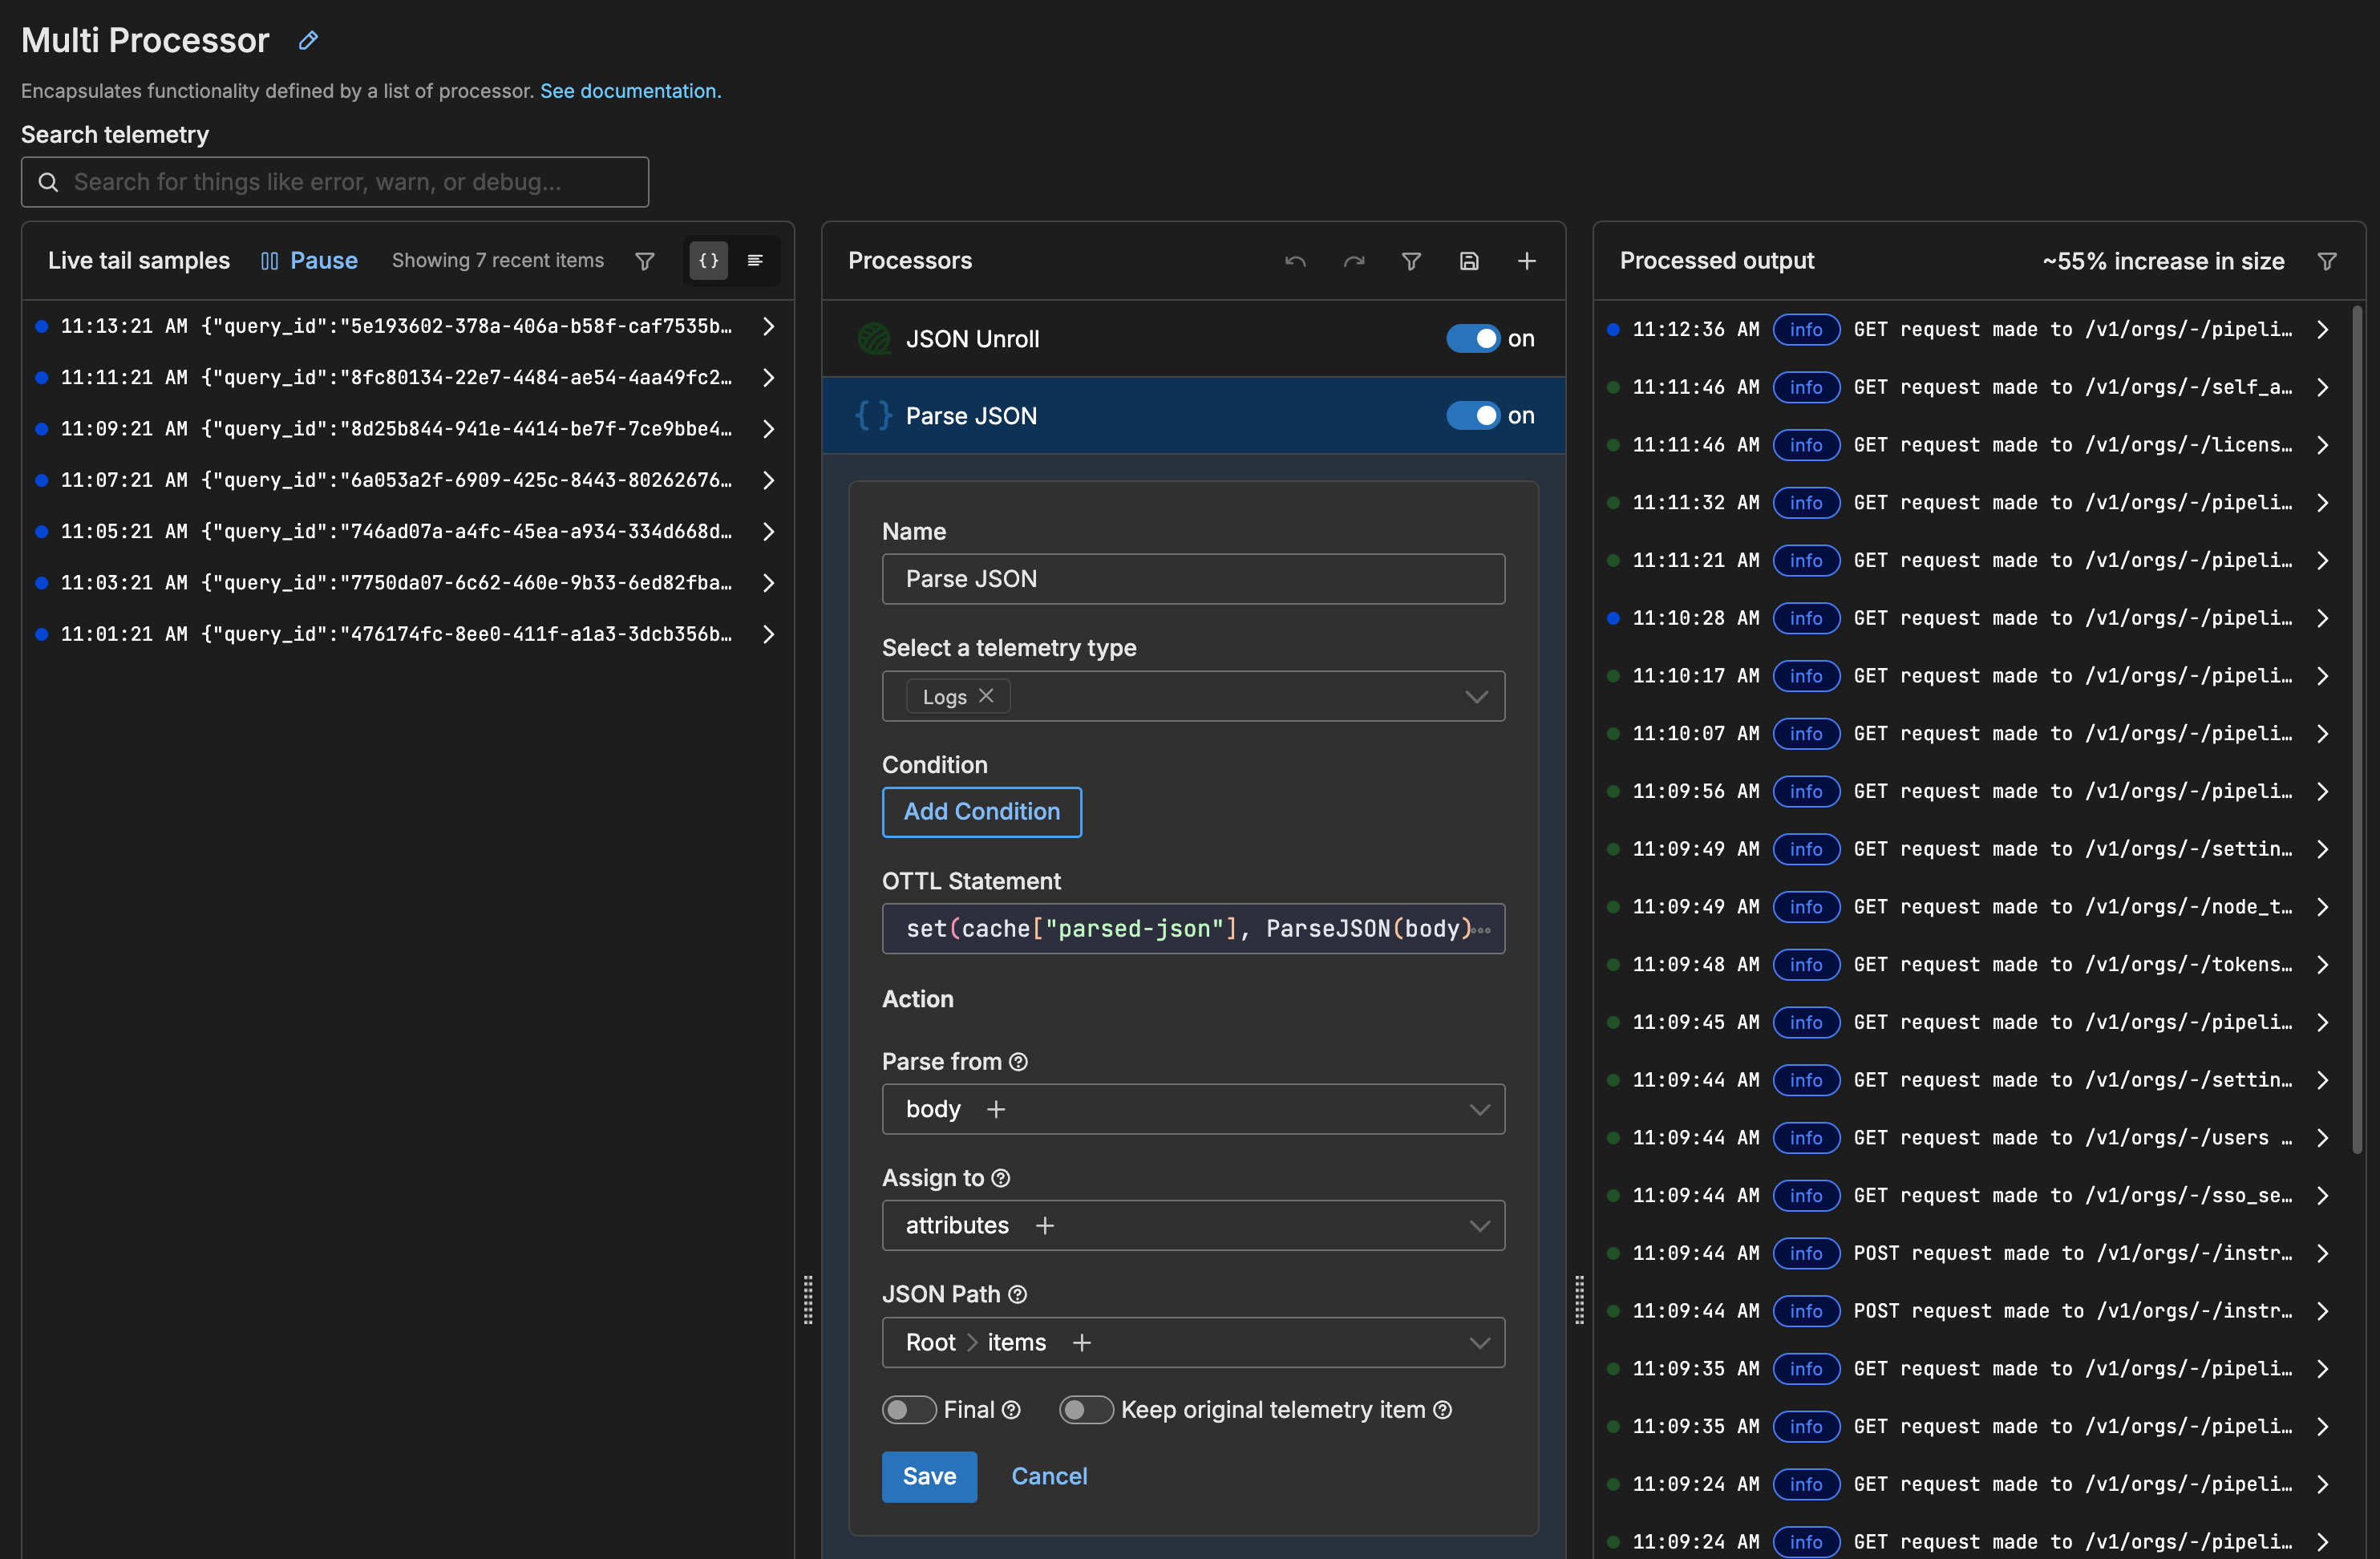
- type: ottl_transform
  data_types:
  - log
  statements: |-
    set(cache["parsed-json"], ParseJSON(body)["items"])
    merge_maps(attributes, cache["parsed-json"], "upsert") where IsMap(attributes) and IsMap(cache["parsed-json"])
    set(attributes, cache["parsed-json"]) where not (IsMap(attributes) and IsMap(cache["parsed-json"]))
3. Copy Fields Transform
Promotes important fields to the log record level:
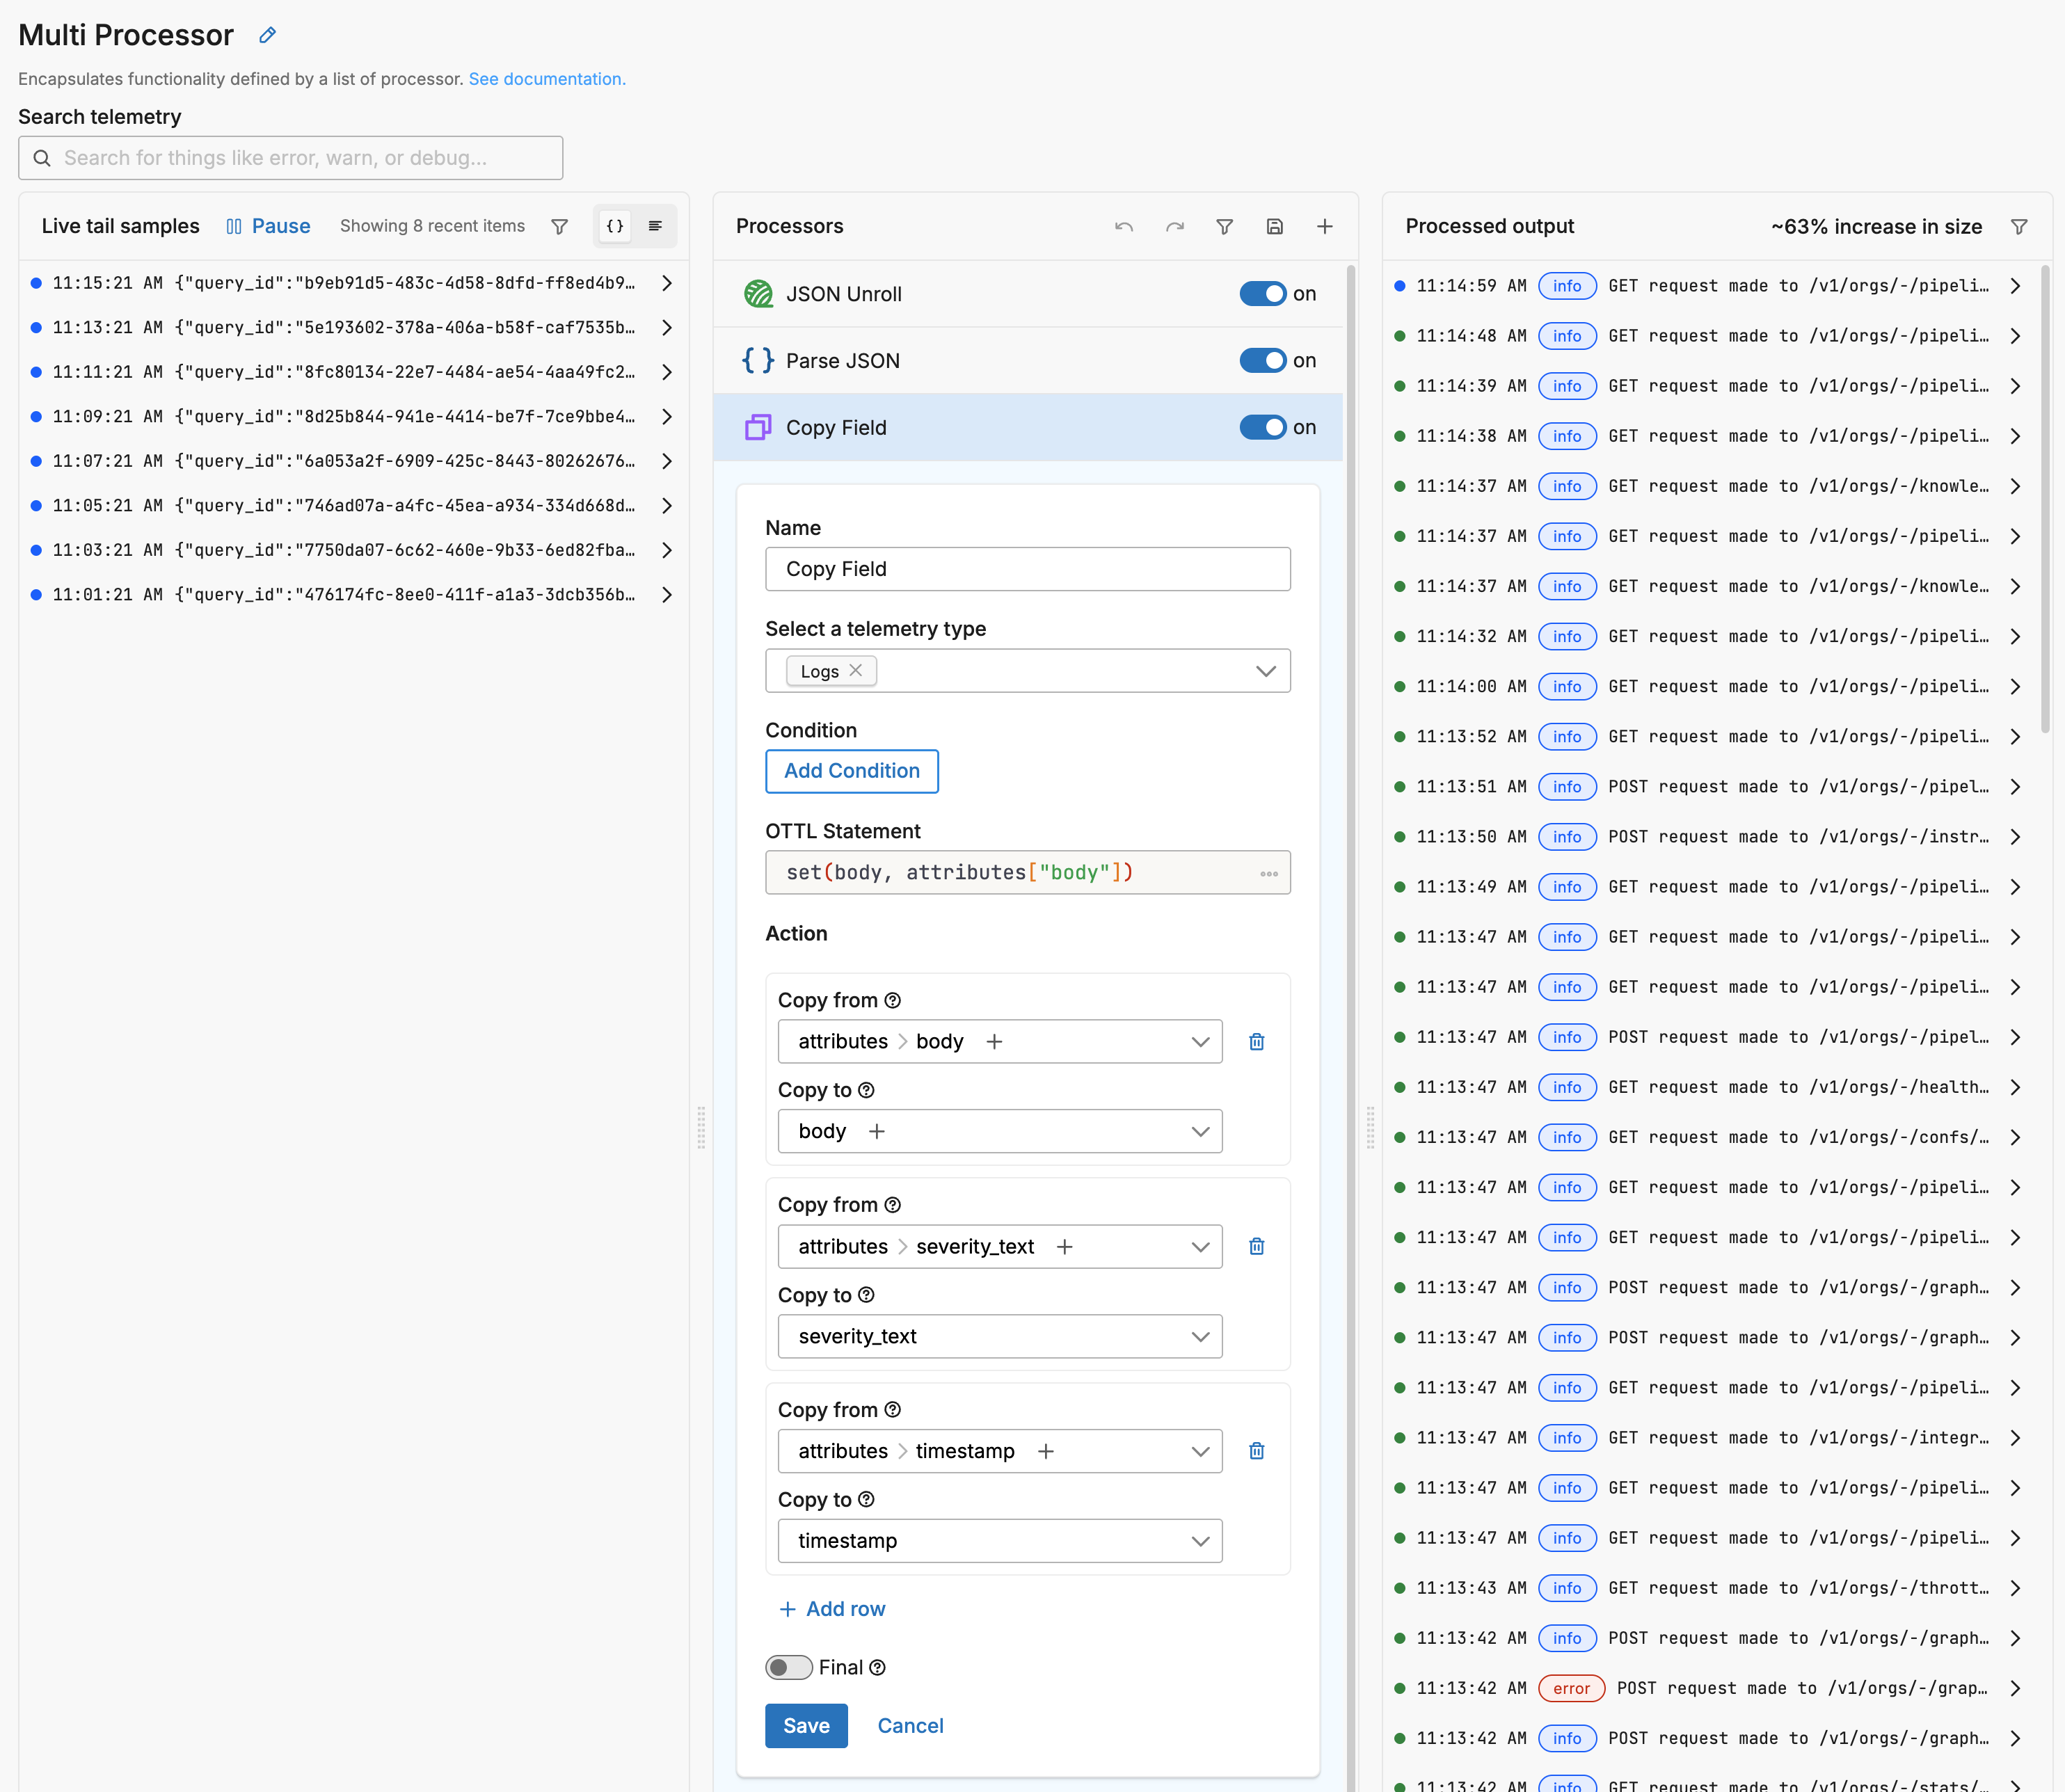
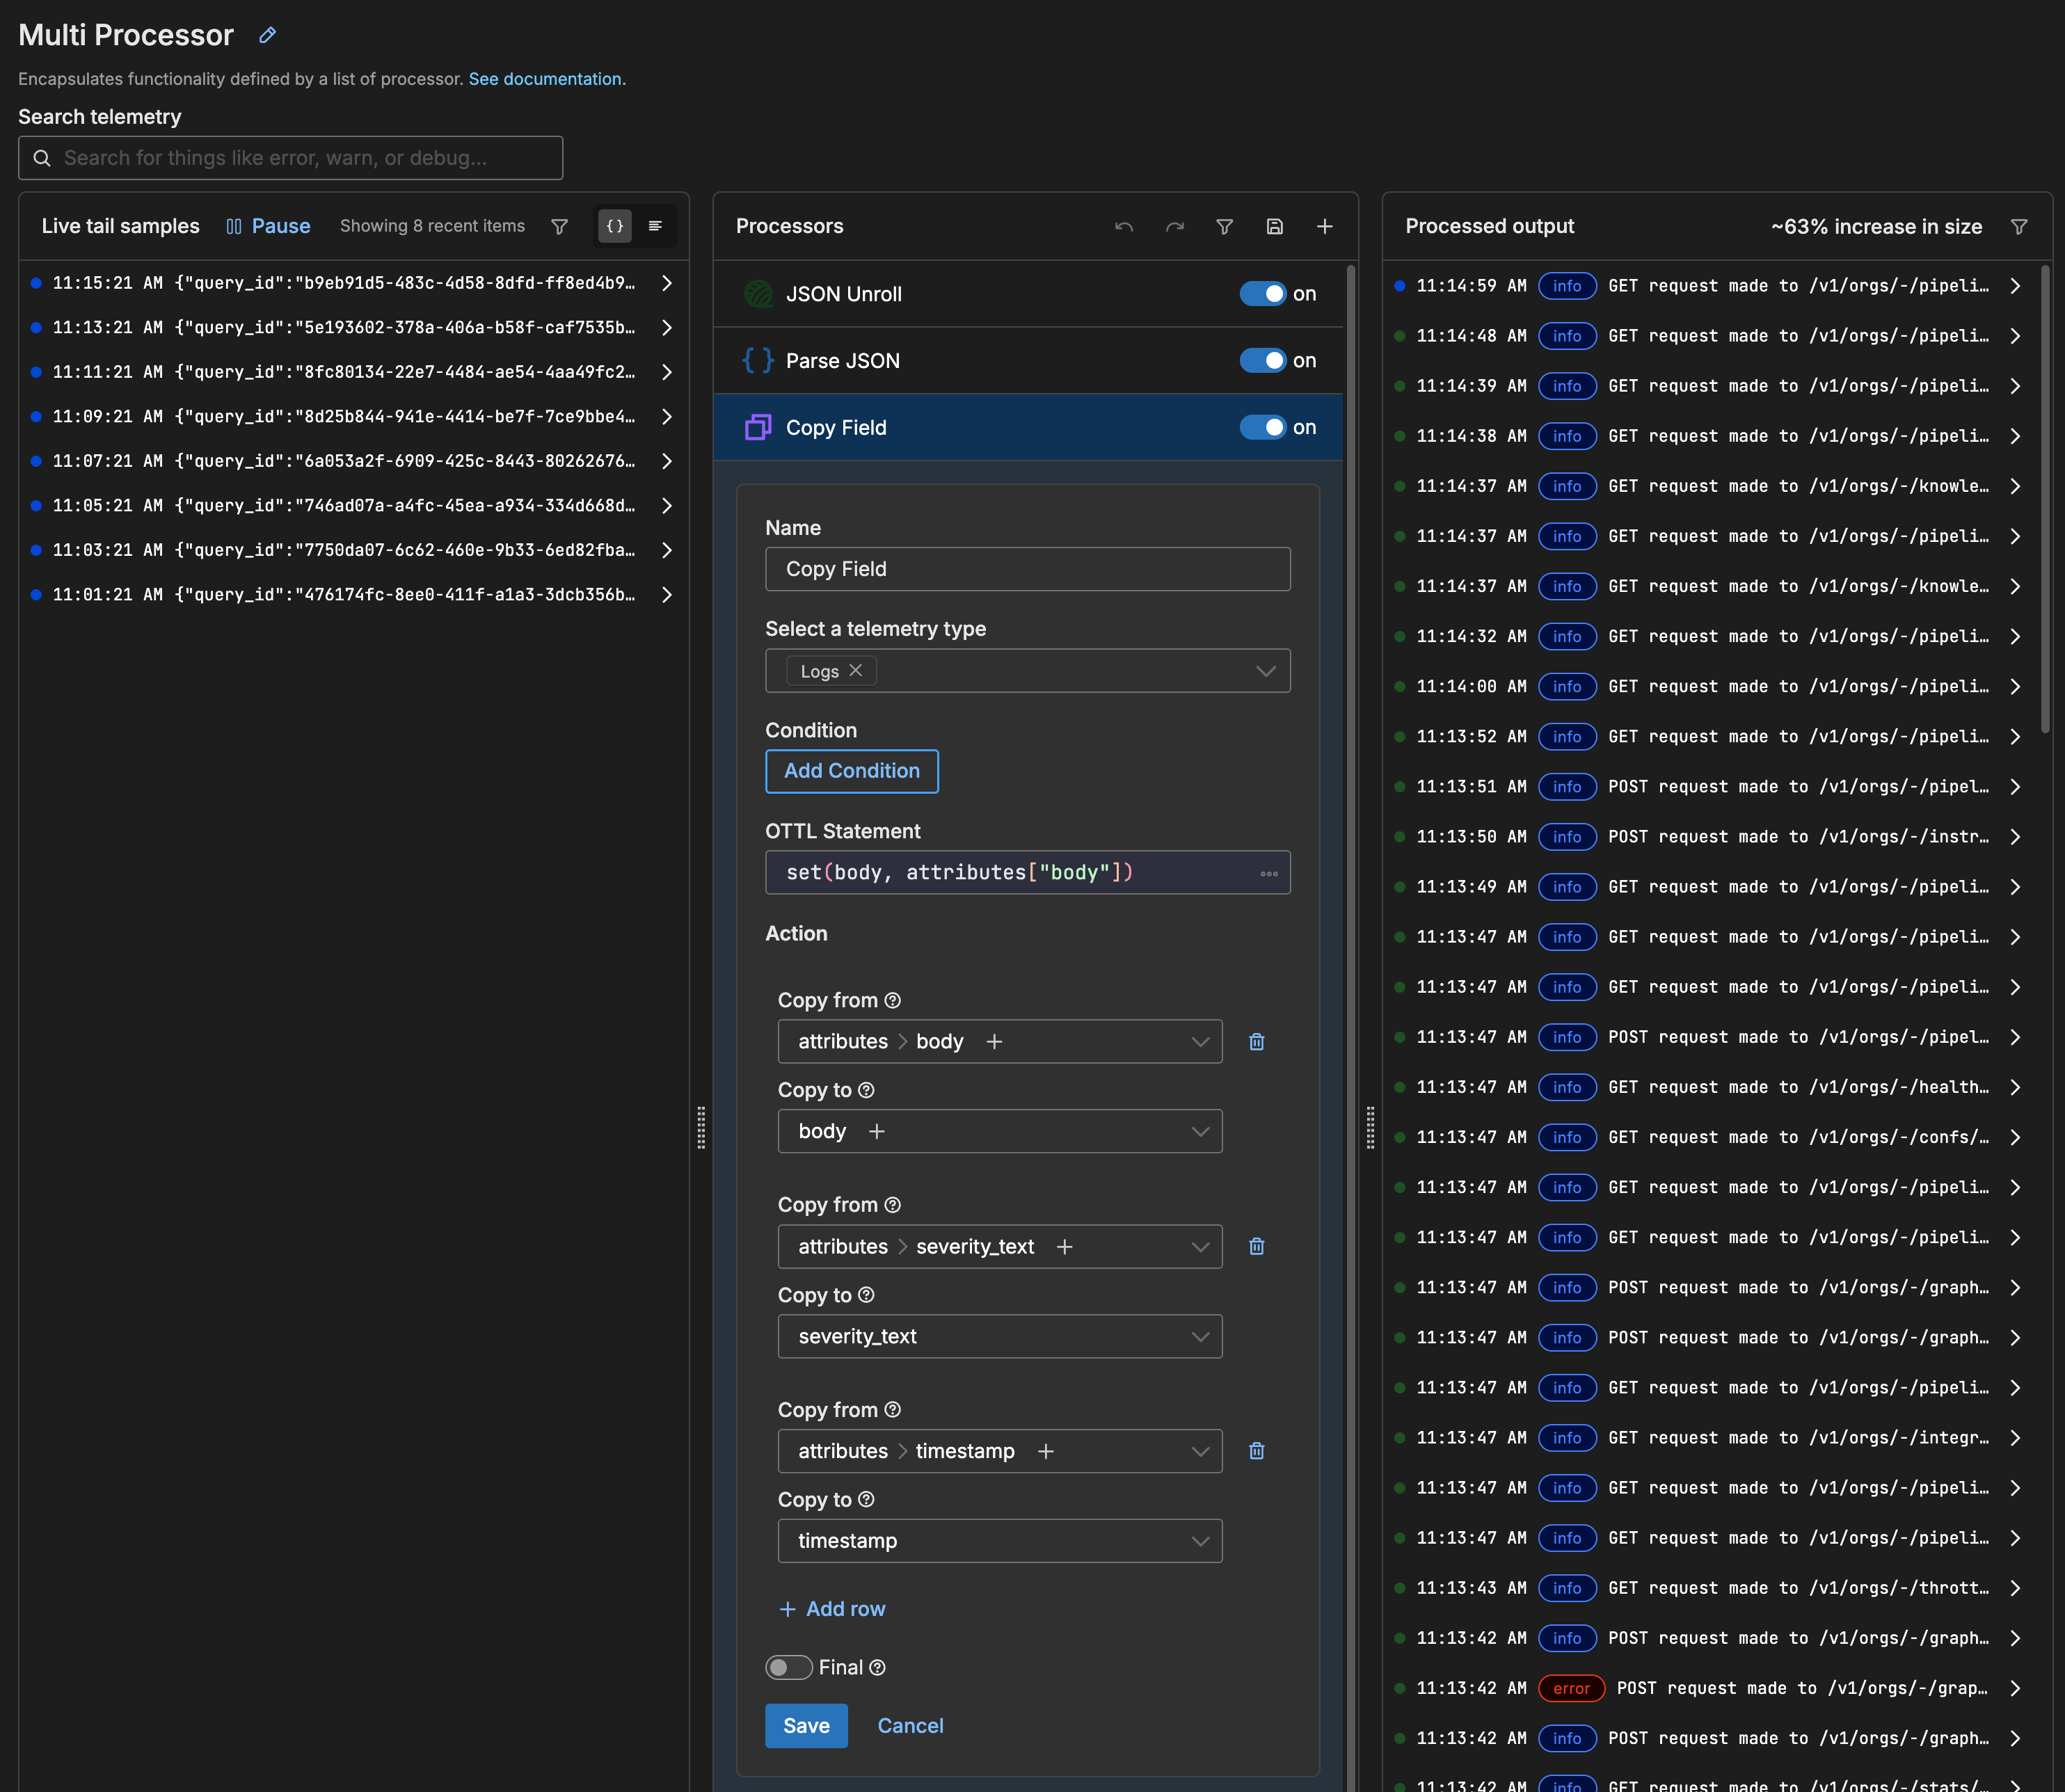
- type: ottl_transform
  data_types:
  - log
  statements: |-
    set(body, attributes["body"])
    set(severity_text, attributes["severity_text"])
    set(timestamp, attributes["timestamp"])
4. Cleanup Transform
Removes redundant fields:
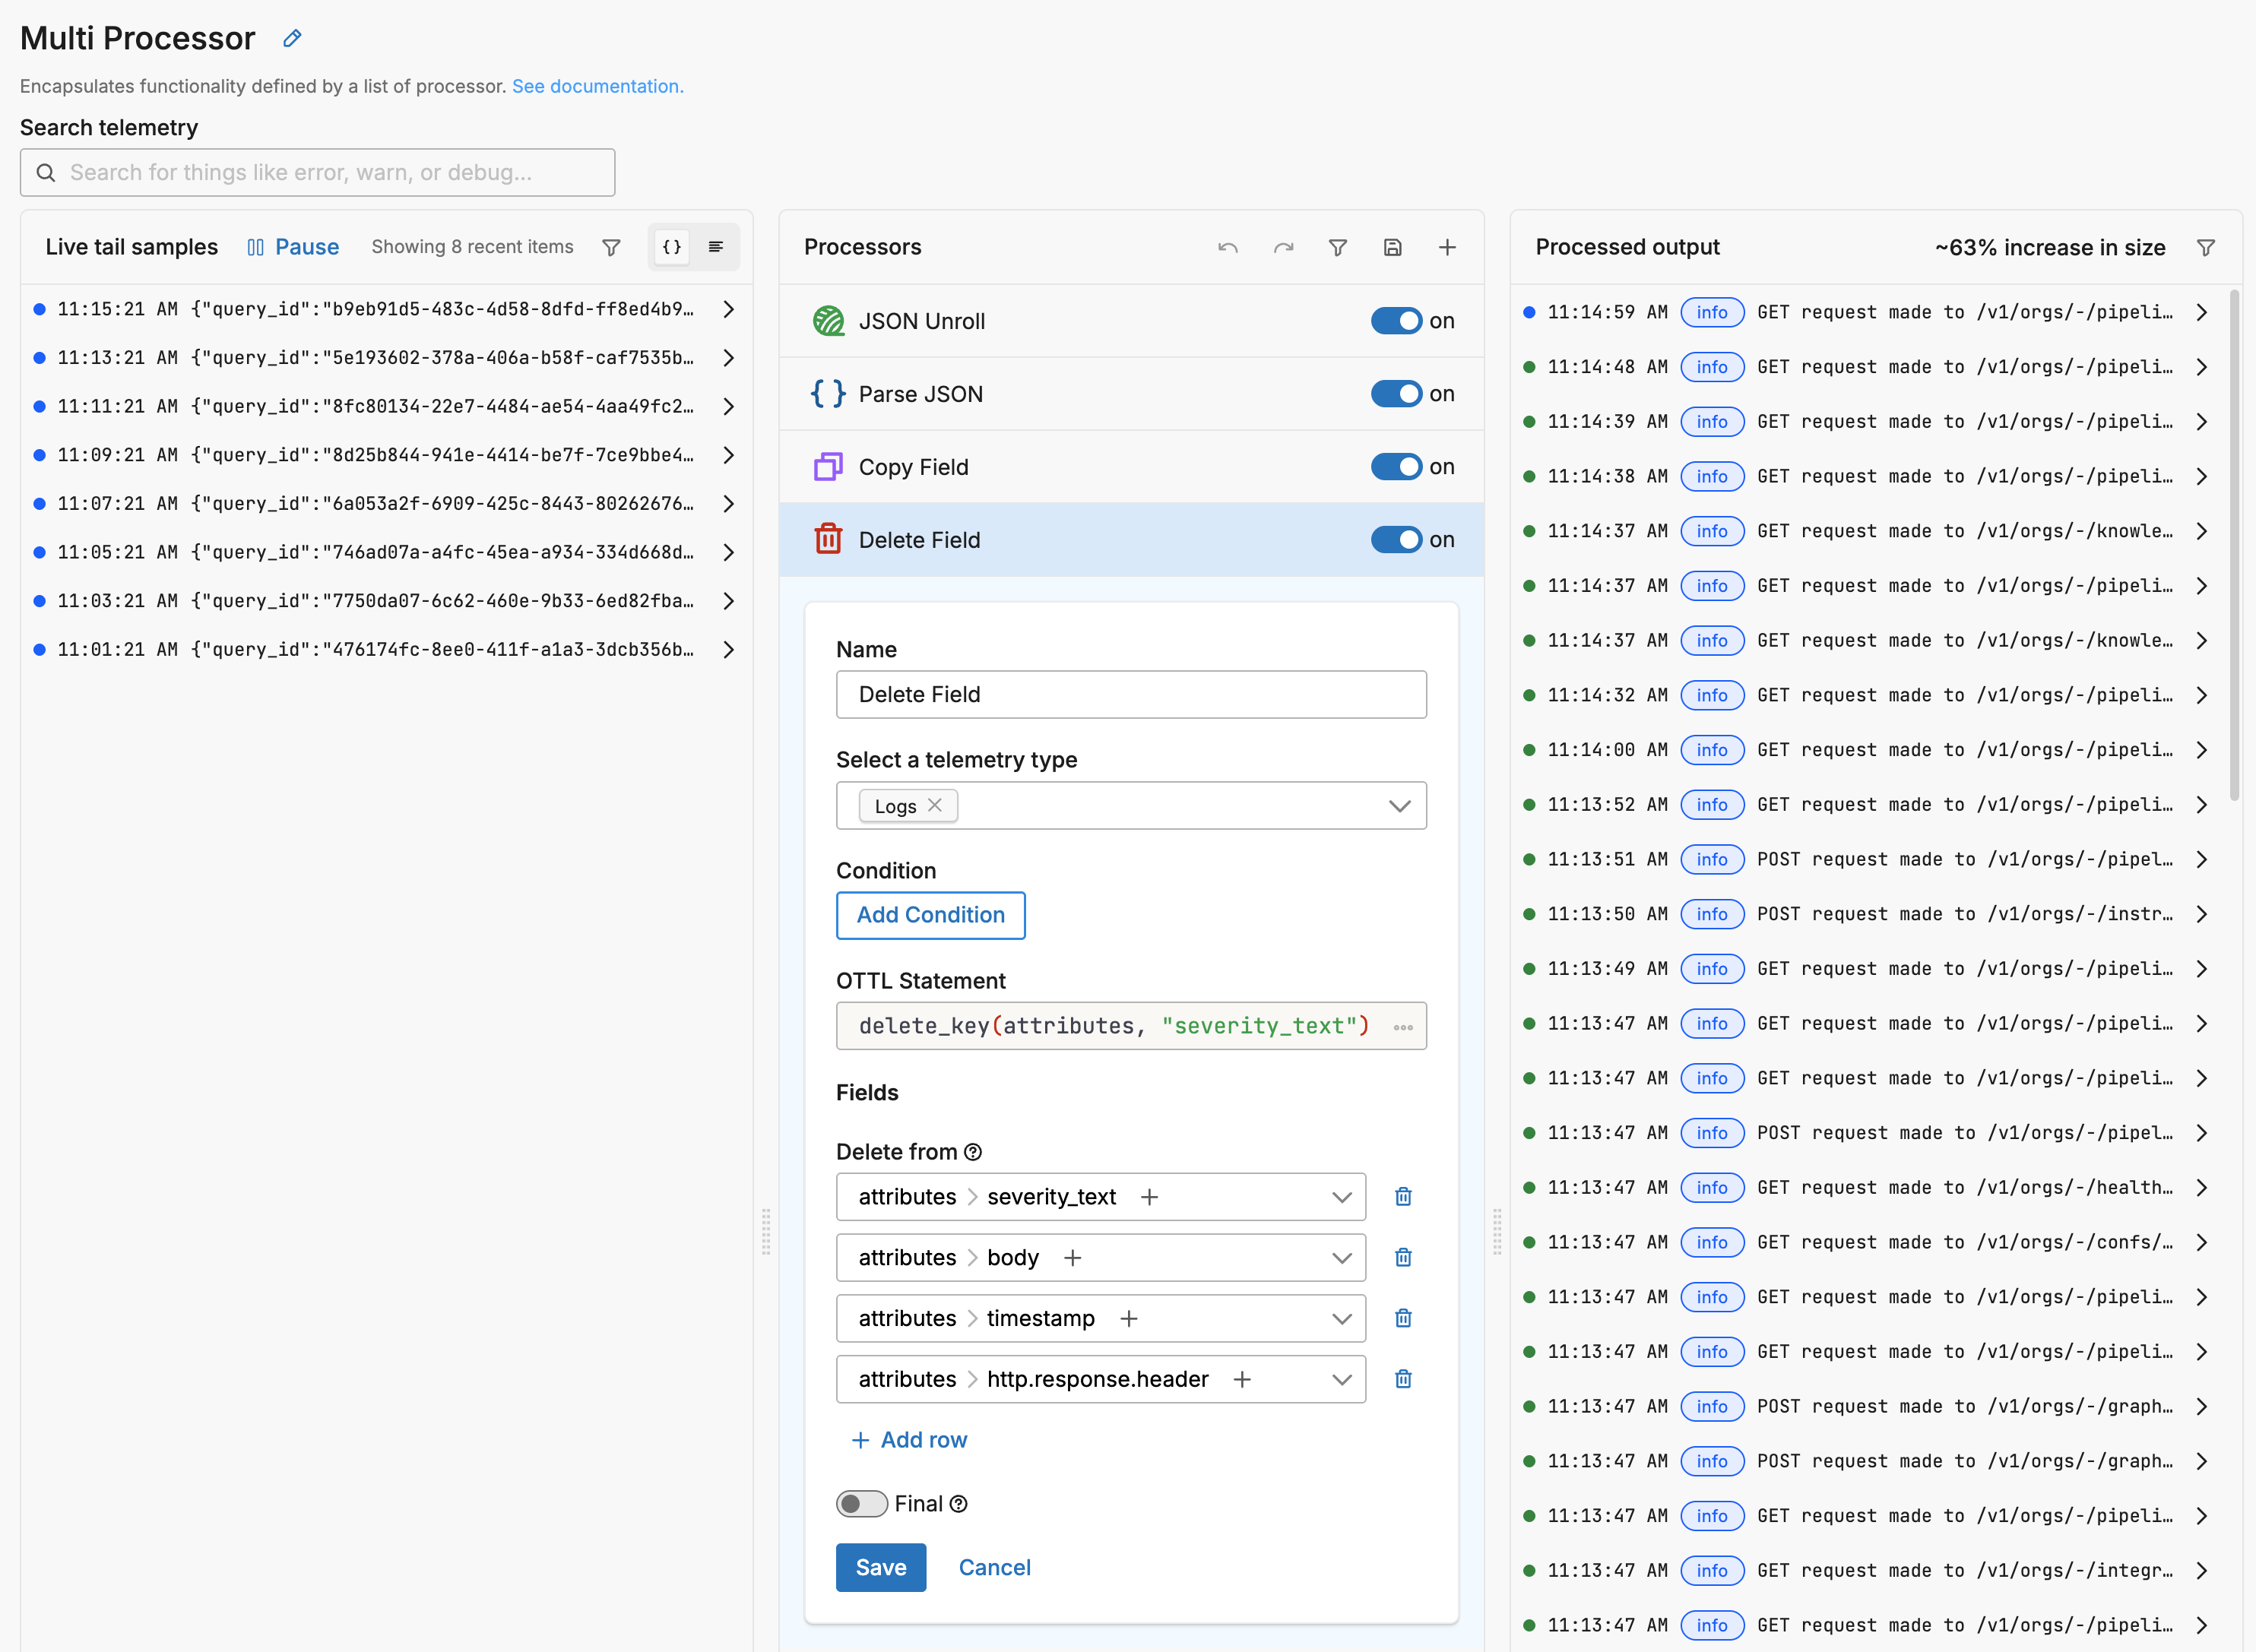
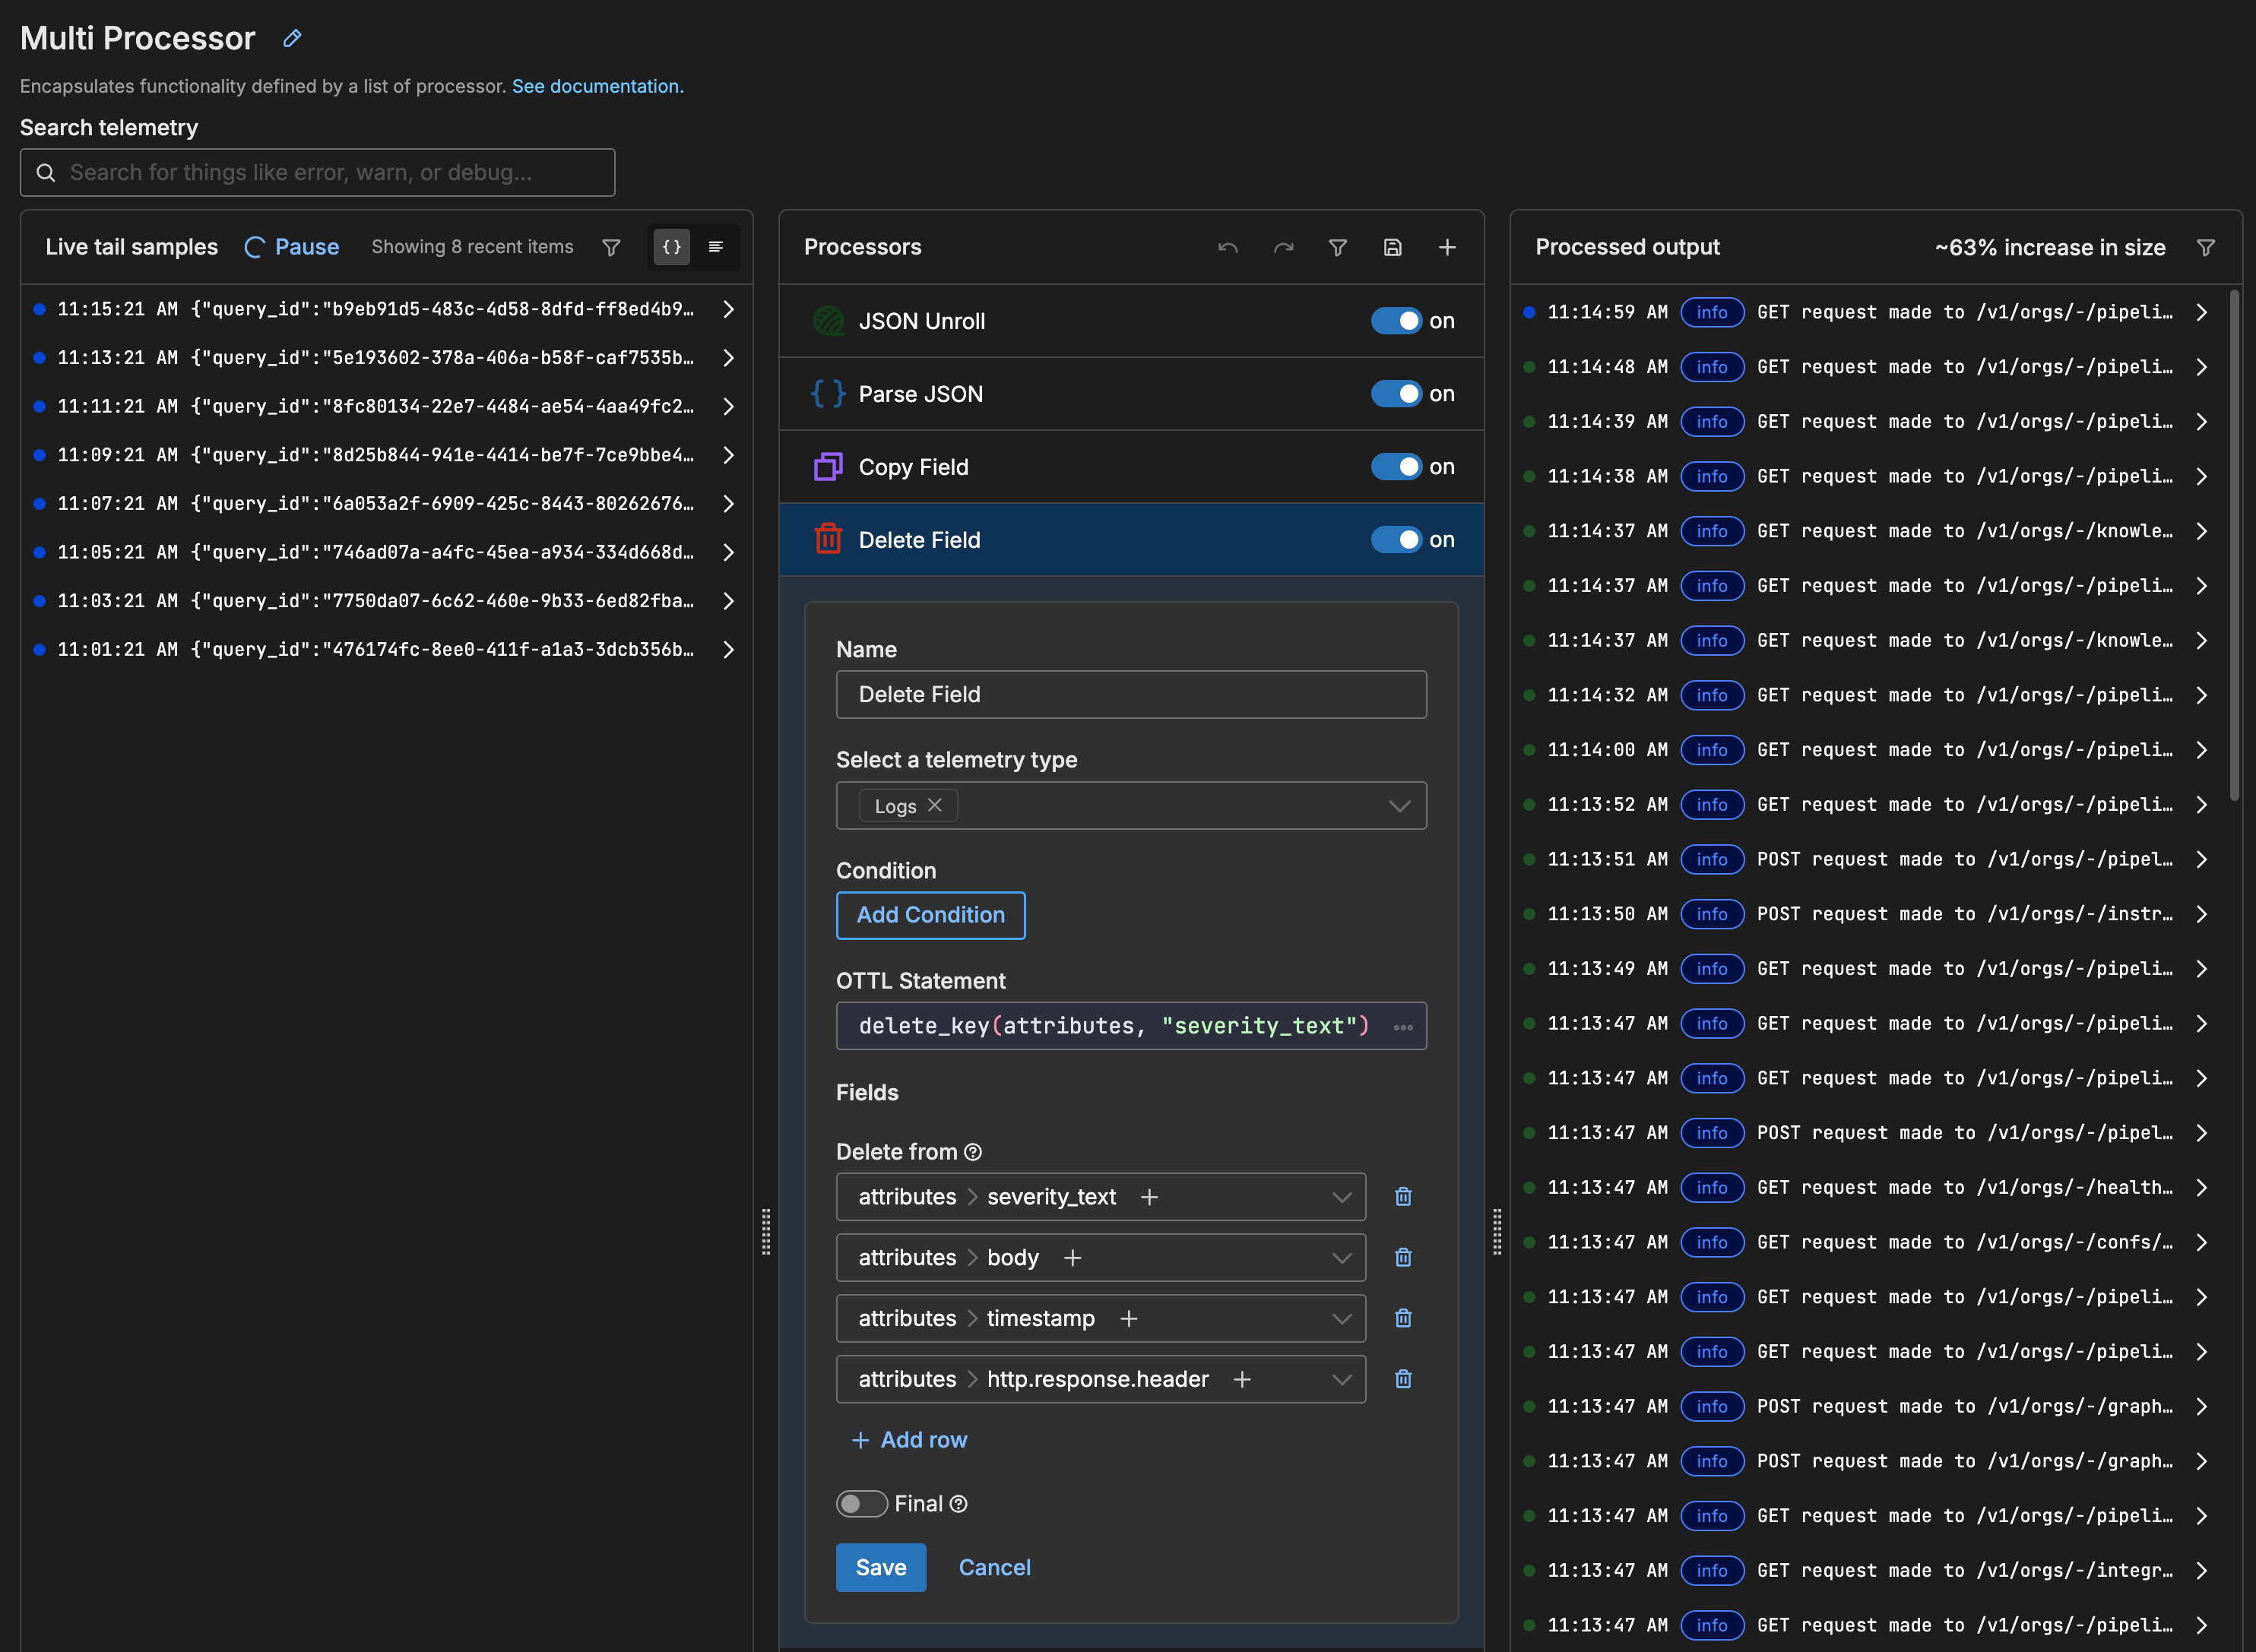
- type: ottl_transform
  data_types:
  - log
  statements: |-
    delete_key(attributes, "severity_text")
    delete_key(attributes, "body")
    delete_key(attributes, "timestamp")
    delete_key(attributes, "http.response.header")
Step 3.3: Add Destination(s)
Connect the processor output to one or more destination nodes:
Monitoring and Troubleshooting
Verify Data Flow
Check agent logs for HTTP pull activity:
kubectl logs -n edgedelta <pod-name> | grep "http_pull"Monitor the Edge Delta console for incoming audit logs in your destination.
Common Issues
| Issue | Cause | Solution |
|---|---|---|
| No data flowing | API token invalid or expired | Regenerate token with correct permissions |
| Missing logs | Lookback period too short | Increase lookback to match or exceed pull interval |
| Duplicate logs | Overlapping lookback periods | Ensure lookback matches pull interval exactly |
| Authentication errors | Wrong Organization ID | Verify Organization ID in Admin console |
| Rate limiting | Pull interval too frequent | Increase pull interval (minimum recommended: 1m) |
API Endpoint Details
The audit log ingestion uses the Edge Delta Search API endpoint:
GET https://api.edgedelta.com/v1/orgs/{org_id}/logs/log_search/search
You can test it manually.
Query Parameters:
| Parameter | Required | Description |
|---|---|---|
scope | Yes | Must be set to audit to retrieve audit logs |
lookback | Yes | Duration in Go format (e.g., 2m, 5m, 1h) |
limit | No | Maximum number of logs to return (default: 1000) |
order | No | Sort order: ASC or DESC (default: DESC) |
Headers:
| Header | Required | Description |
|---|---|---|
X-ED-API-Token | Yes | Your API token with Search read permissions |
Accept | Yes | Set to application/json |
For complete API documentation, see API Reference.
Security Best Practices
Use least privilege: Create dedicated API tokens for audit log ingestion with only the required Search read permissions.
Rotate tokens regularly: Implement a token rotation policy and update pipeline configurations accordingly.
Monitor token usage: Track API token usage in the Edge Delta Admin console to detect anomalies.
Encrypt in transit: The API endpoint uses HTTPS to ensure audit logs are encrypted during transmission.
Next Steps
- Configure monitors or pipeline triggers on audit log patterns to detect security events
- Set up dashboards to visualize audit activity
- Integrate with your SIEM platform for correlation with other security events
- Explore OTTL processors for advanced audit log transformation