Ingest Data from Elasticsearch Bulk API
7 minute read
Overview
The Elasticsearch API Input node enables Edge Delta to receive data from any tool that supports the Elasticsearch Bulk API protocol. This provides a seamless migration path from Elasticsearch-based collection pipelines and allows you to leverage existing Beats agents, Logstash pipelines, and other Elasticsearch-compatible data shippers without modification.
The node implements the Elasticsearch Bulk API (/_bulk endpoint) and responds with API version 8.3.2 compatibility, making it a drop-in replacement for data ingestion workflows.
Key Features
- Protocol Compatibility: Accepts Elasticsearch Bulk API requests in NDJSON format
- Zero Configuration Migration: Works with existing Filebeat, Logstash, and Vector configurations
- Kubernetes Native: Designed for containerized environments with service discovery
- Health Check Support: Built-in health endpoint for load balancer integration
- Metadata Preservation: Maintains source metadata including index names and document IDs
- High Performance: Configurable request limits and parallel processing
Common Use Cases
Use Case 1: Kubernetes Log Collection with Filebeat
This is the most common deployment pattern for collecting container logs in Kubernetes clusters using Filebeat DaemonSets.
Architecture Overview
Container Logs → Filebeat DaemonSet → Elasticsearch API Input → Edge Delta Pipeline → Destinations
In this pattern:
- Filebeat runs as a DaemonSet, collecting logs from all nodes
- Filebeat enriches logs with Kubernetes metadata
- Data is sent to Edge Delta via the Elasticsearch Bulk API
- Edge Delta processes and routes data to multiple destinations
Filebeat Configuration
Configure Filebeat to send logs to Edge Delta’s Elasticsearch API Input:
apiVersion: v1
kind: ConfigMap
metadata:
  name: filebeat-config
  namespace: monitoring
data:
  filebeat.yml: |-
    filebeat.inputs:
      - type: container
        paths:
          - /var/log/containers/*.log
        processors:
          - add_kubernetes_metadata:
              host: ${NODE_NAME}
              matchers:
                - logs_path:
                    logs_path: "/var/log/containers/"
          - add_cloud_metadata: ~
          - add_host_metadata: ~

    # Output to Edge Delta Elasticsearch API
    output.elasticsearch:
      hosts: ["edgedelta.edgedelta.svc.cluster.local:9200"]
      protocol: "http"

      # Index name pattern (preserved in metadata)
      index: "filebeat-%{+yyyy.MM.dd}"

      # Bulk settings for optimal performance
      bulk_max_size: 50
      worker: 1
      compression_level: 0

      # Connection settings
      timeout: 30
      max_retries: 3

    # Disable template management for non-Elasticsearch endpoints
    setup.template.enabled: false
    setup.ilm.enabled: false

    # Logging configuration
    logging.level: info
    logging.to_stderr: true
    logging.to_files: false

    # Add custom fields
    processors:
      - add_fields:
          target: ''
          fields:
            lab_name: production-cluster
            source_tool: filebeat
            deployment: kubernetes
Edge Delta Configuration
Add the Elasticsearch API Input node to your Edge Delta pipeline:
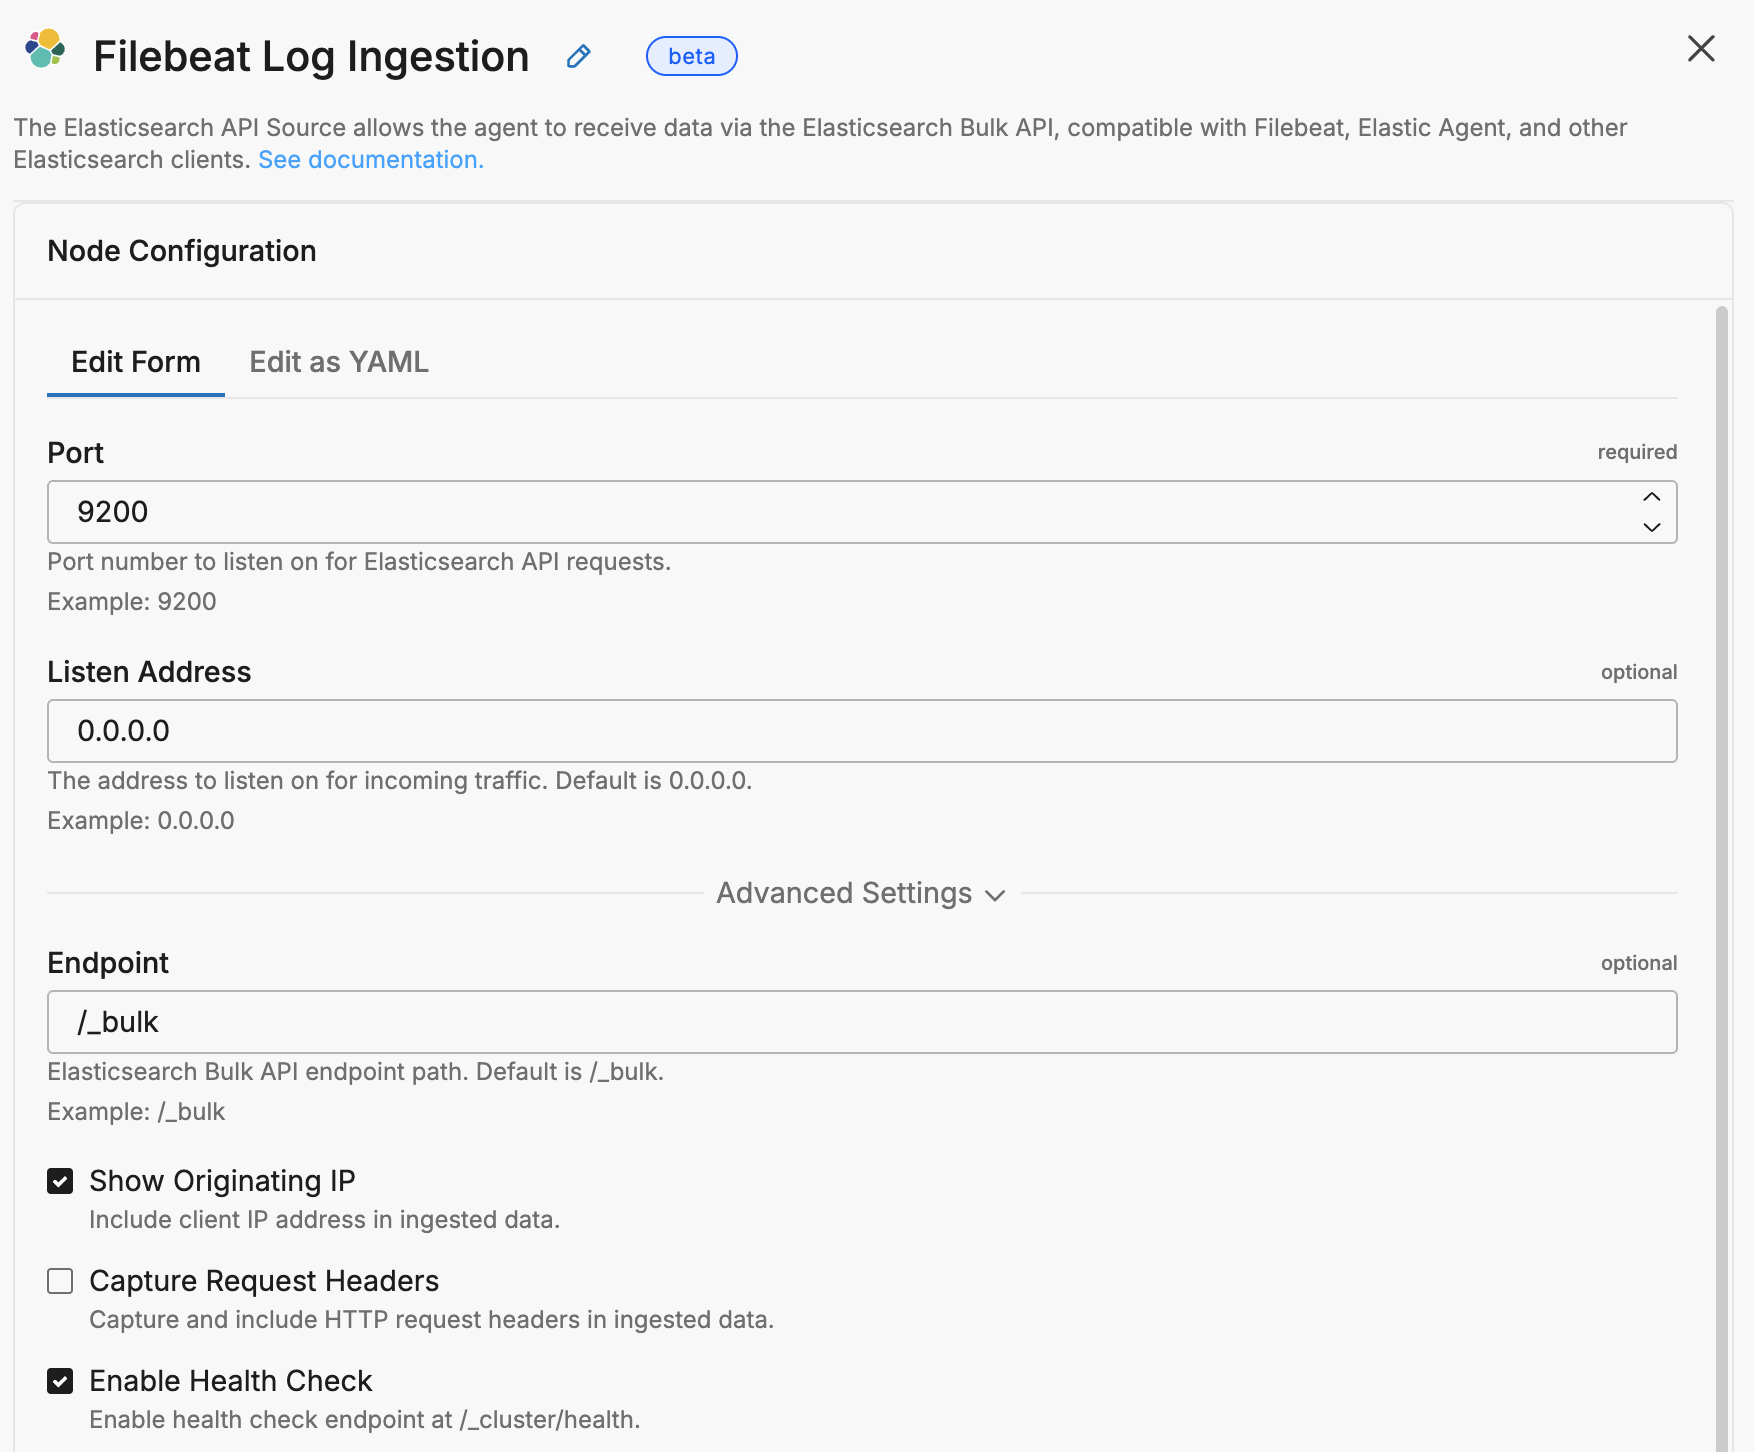
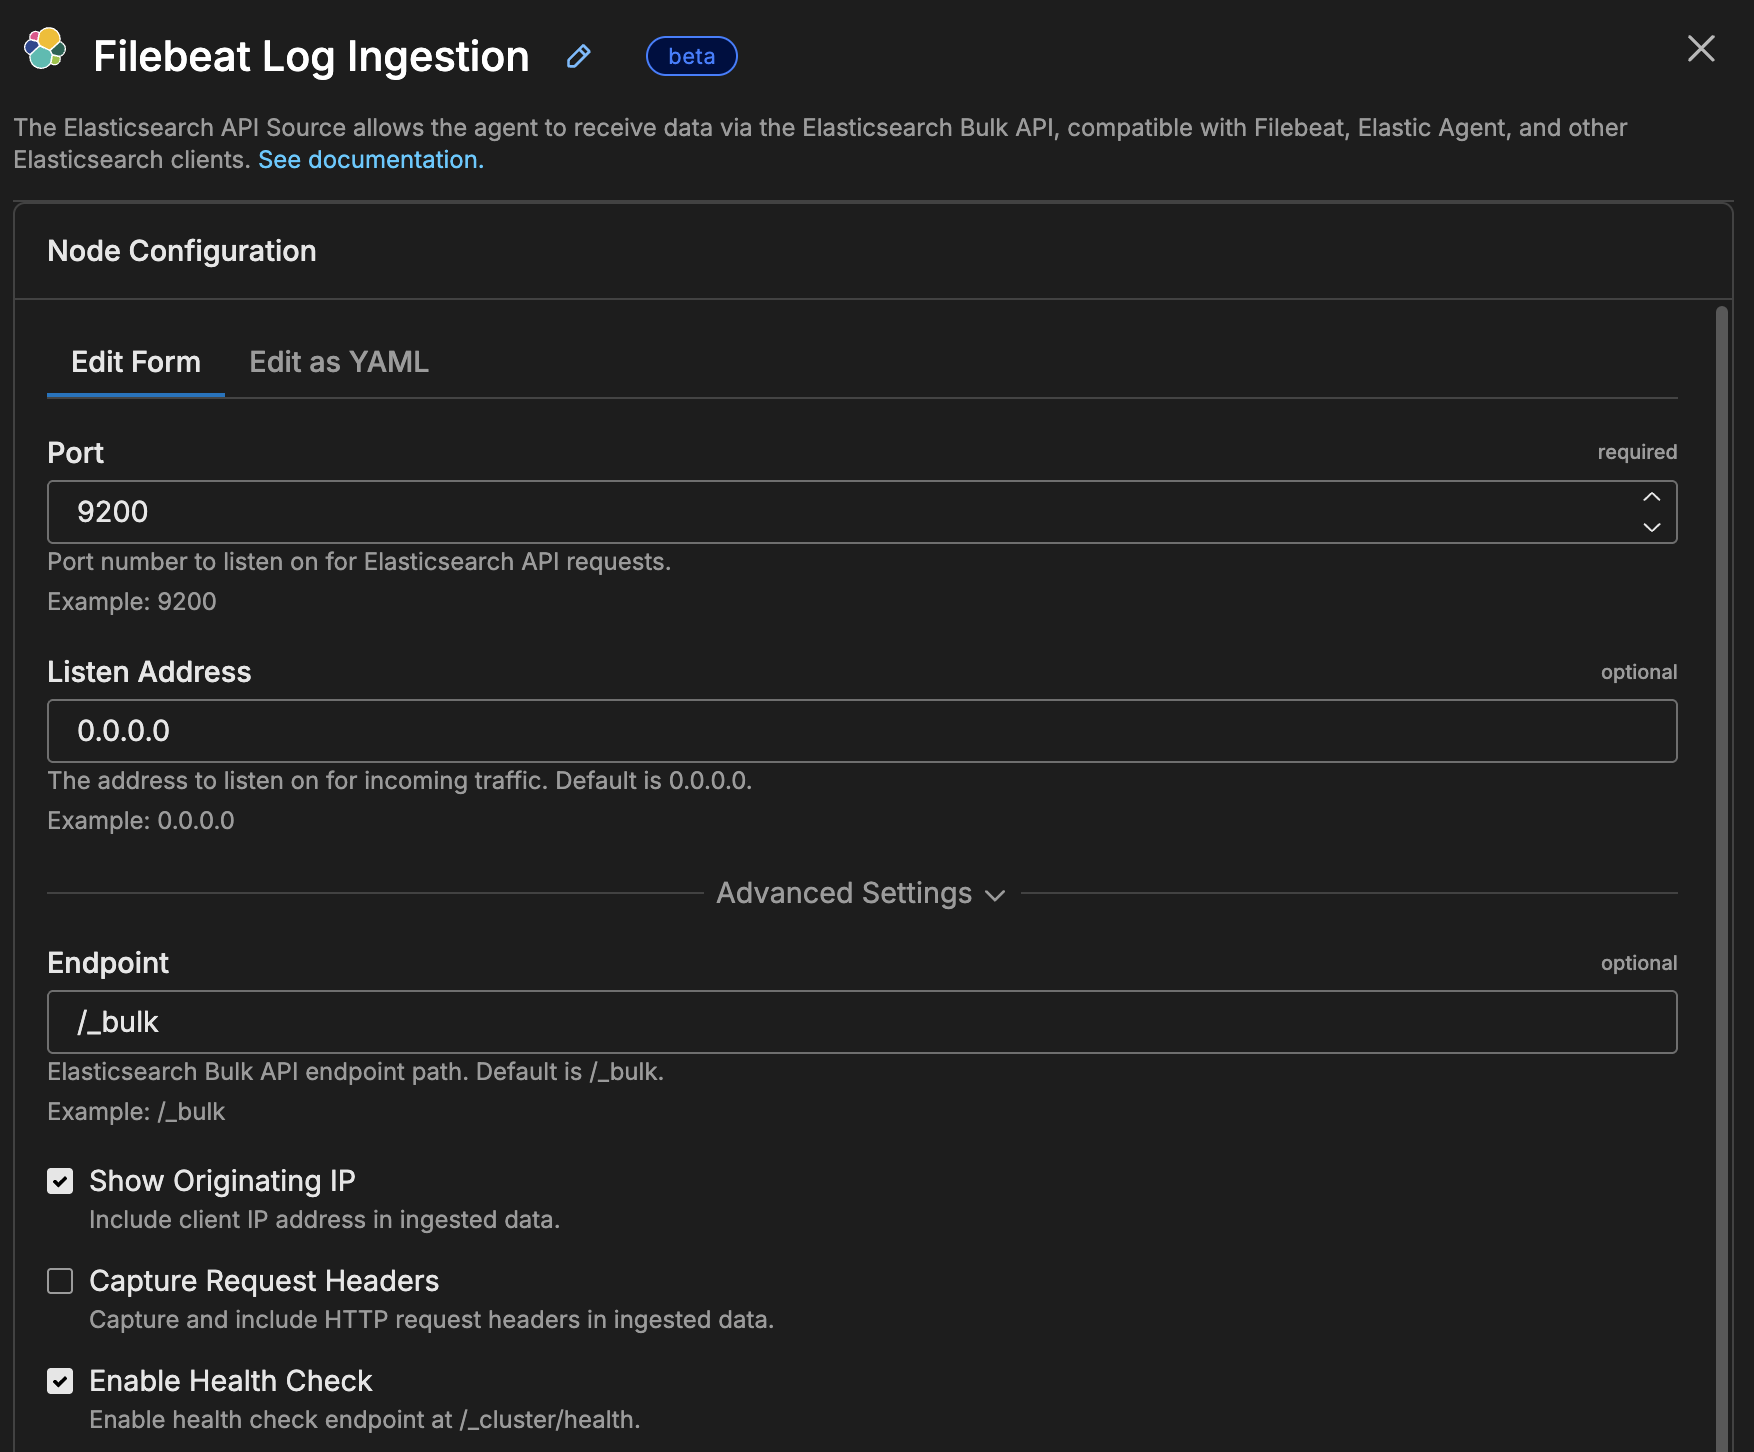
nodes:
  # Elasticsearch API Input
  - name: elasticsearch_api_input
    type: elastic_api_input
    user_description: "Filebeat Log Ingestion"
    port: 9200
    endpoint: "/_bulk"
    listen: "0.0.0.0"
    enable_health_check: true
    active_request_limit: 256
    api_version: "8.3.2"
Kubernetes Service Configuration
Create a Service to expose the Elasticsearch API Input:
apiVersion: v1
kind: Service
metadata:
  name: edgedelta
  namespace: edgedelta
  labels:
    app: edgedelta
spec:
  selector:
    app.kubernetes.io/name: edgedelta
    edgedelta/agent-type: processor
  ports:
  - name: elastic-api
    port: 9200
    targetPort: 9200
    protocol: TCP
  type: ClusterIP
Data Flow and Metadata
When logs flow through this pipeline, they maintain rich metadata:
Original Log:
{"timestamp":"2025-10-27T07:20:43Z","sequence":228,"level":"WARN","user_id":9201,"action":"view_page","service":"web-app"}
After Filebeat Enrichment:
{
  "message": "{\"timestamp\":\"2025-10-27T07:20:43Z\",\"sequence\":228,\"level\":\"WARN\"}",
  "agent": {
    "type": "filebeat",
    "version": "8.11.0",
    "hostname": "worker-node-1"
  },
  "kubernetes": {
    "pod": {
      "name": "app-pod-xyz",
      "namespace": "production"
    },
    "container": {
      "name": "app-container"
    },
    "labels": {
      "app": "web-service",
      "version": "v2.1.0"
    }
  },
  "host": "worker-node-1",
  "lab_name": "production-cluster",
  "source_tool": "filebeat"
}
After Edge Delta Processing (Resource Attributes):
{
  "ed.source.name": "elasticsearch_api_input",
  "ed.source.type": "elastic_api_input",
  "elastic.action": "create",
  "elastic.index": "filebeat-2025.10.27",
  "host.ip": "10.244.1.16",
  "host.name": "worker-node-1",
  "service.name": "elastic-api-9200"
}
Use Case 2: Multi-Source Log Aggregation with Logstash
Logstash can aggregate logs from multiple sources and forward them to Edge Delta for centralized processing.
Logstash Configuration
input {
  # Collect from multiple sources
  syslog {
    port => 5514
  }
  tcp {
    port => 5000
    codec => json
  }
}

filter {
  # Add custom metadata
  mutate {
    add_field => {
      "pipeline_source" => "logstash"
      "environment" => "production"
    }
  }
}

output {
  elasticsearch {
    hosts => ["http://edgedelta.edgedelta.svc.cluster.local:9200"]
    index => "logstash-%{+yyyy.MM.dd}"

    # Disable template and ILM for Edge Delta compatibility
    manage_template => false
    ilm_enabled => false
  }
}
Use Case 3: Vector as a Universal Data Collector
Vector can collect from various sources and forward to Edge Delta using the Elasticsearch sink.
Vector Configuration
[sources.kubernetes_logs]
type = "kubernetes_logs"

[sources.host_metrics]
type = "host_metrics"

[transforms.parse_logs]
type = "remap"
inputs = ["kubernetes_logs"]
source = '''
  .application = "web-app"
  .processed_by = "vector"
'''

[sinks.edgedelta]
type = "elasticsearch"
inputs = ["parse_logs", "host_metrics"]
endpoint = "http://edgedelta.edgedelta.svc.cluster.local:9200"
mode = "bulk"

# Batch settings
batch.max_bytes = 10485760
batch.timeout_secs = 5

# Disable template management
bulk.index = "vector-%Y.%m.%d"
api_version = "v8"

[sinks.edgedelta.request]
# Connection settings
timeout_secs = 30
Prerequisites
Before implementing the Elasticsearch API Input integration:
- Edge Delta Agent Version: v2.7.0 or higher
- Network Connectivity: Ensure data shippers can reach Edge Delta agents on port 9200
- Kubernetes Service (for K8s deployments): Create a Service to expose the Elasticsearch API endpoint
- Tool Configuration: Disable Elasticsearch template management in your data shippers
Verification and Testing
Test Connectivity
Test the health endpoint from within your cluster:
# Using curl
curl http://edgedelta.edgedelta.svc.cluster.local:9200/

# Expected response:
{
  "cluster_name": "edgedelta",
  "version": {
    "number": "8.3.2",
    "build_flavor": "default",
    "build_type": "docker"
  }
}
Send a Test Bulk Request
curl -X POST http://edgedelta.edgedelta.svc.cluster.local:9200/_bulk \
  -H "Content-Type: application/x-ndjson" \
  --data-binary $'{"index":{"_index":"test"}}\n{"message":"test log entry","timestamp":"2025-10-27T10:00:00Z"}\n'
Monitor Data Flow
Check Edge Delta logs to verify data reception:
kubectl logs -n edgedelta daemonset/edgedelta | grep elastic_api

# Expected output:
# elastic_api_input started HTTP server on 0.0.0.0:9200
# elastic_api_input received bulk request with X documents
Monitor your destination to confirm data delivery:
# Check your configured output destination
kubectl logs -n your-namespace deployment/your-destination
Troubleshooting
Common Issues and Solutions
Issue: “405 Method Not Allowed” on Template Operations
Symptoms: Filebeat or Logstash fails with template-related errors
Solution: The Elasticsearch API Input only implements the Bulk API, not the full Elasticsearch management API. Disable template management:
Filebeat:
setup.template.enabled: false
setup.ilm.enabled: false
Logstash:
output {
  elasticsearch {
    manage_template => false
    ilm_enabled => false
  }
}
Issue: “Connection Refused” or DNS Resolution Failures
Symptoms:
lookup edgedelta.edgedelta.svc.cluster.local: no such host
Solution: Ensure the Kubernetes Service is created to expose port 9200:
# Check if Service exists
kubectl get service edgedelta -n edgedelta

# Verify Service endpoints are populated
kubectl get endpoints edgedelta -n edgedelta

# Should show agent pod IPs on port 9200
If the Service doesn’t exist, create it with the correct selector matching your agent pods.
Issue: No Data Flowing Through Pipeline
Checklist:
Verify agent is listening:
kubectl logs -n edgedelta daemonset/edgedelta | grep "started HTTP server"Check Service DNS resolution:
kubectl run test --image=busybox --rm -it --restart=Never -- \
  nslookup edgedelta.edgedelta.svc.cluster.local
Test connectivity:
kubectl run test --image=curlimages/curl --rm -it --restart=Never -- \
  curl -v http://edgedelta.edgedelta.svc.cluster.local:9200/
Verify Filebeat configuration:
kubectl logs -n <filebeat-namespace> daemonset/filebeat | grep -i connectionCheck Edge Delta pipeline links: Ensure
elastic_api_inputis linked to a processor and output in your pipeline configuration
Issue: High Memory Usage on Edge Delta Agents
Symptoms: Agents consuming excessive memory with high log volume
Solution: Tune the active_request_limit parameter:
- name: elasticsearch_api_input
  type: elastic_api_input
  active_request_limit: 128  # Reduce from default 256
Also optimize Filebeat batch sizes:
output.elasticsearch:
  bulk_max_size: 25  # Reduce from 50
  worker: 1
Performance Tuning
Filebeat Optimization
For high-volume environments (>10,000 events/second per node):
output.elasticsearch:
  # Increase batch size for better throughput
  bulk_max_size: 100

  # Add more workers
  worker: 2

  # Enable compression
  compression_level: 3

  # Adjust queue settings
queue.mem:
  events: 8192
  flush.min_events: 512
  flush.timeout: 1s
Edge Delta Configuration
For handling high request rates:
- name: elasticsearch_api_input
  type: elastic_api_input
  active_request_limit: 512  # Increase for high throughput
  port: 9200
  channel_size: 2000         # Increase internal buffer (default 1000)
Security Considerations
Authentication
To enable authentication on the Elasticsearch API Input:
- name: elasticsearch_api_input
  type: elastic_api_input
  port: 9200
  authentication:
    type: basic
    username: filebeat
    password: ${FILEBEAT_PASSWORD}
Then configure Filebeat:
output.elasticsearch:
  hosts: ["edgedelta.edgedelta.svc.cluster.local:9200"]
  username: "filebeat"
  password: "${FILEBEAT_PASSWORD}"
TLS Encryption
For secure transmission:
- name: elasticsearch_api_input
  type: elastic_api_input
  port: 9200
  tls:
    enabled: true
    cert_file: /etc/certs/tls.crt
    key_file: /etc/certs/tls.key
Update Filebeat configuration:
output.elasticsearch:
  hosts: ["edgedelta.edgedelta.svc.cluster.local:9200"]
  protocol: "https"
  ssl.verification_mode: "certificate"
  ssl.certificate_authorities: ["/etc/certs/ca.crt"]
Next Steps
- Review the Filebeat source reference for all configuration parameters
- Explore AI Team Filebeat connector for streamlined setup
- Learn about sequence processors to build processing chains
- Configure output destinations for your processed data