JournalD Connector
Configure the JournalD connector to collect systemd journal logs from Linux systems for analysis of system events, service logs, and kernel messages.
13 minute read
Overview
The JournalD connector collects and streams logs from the systemd journal on Linux systems. Systemd journal provides centralized storage of system logs, service messages, kernel events, and audit records in structured binary format with rich metadata. Content streams into Edge Delta Pipelines for analysis by AI teammates through the Edge Delta MCP connector.
The connector reads journal entries directly using journalctl with flexible filtering based on systemd units, journal fields, priority levels, and boot sessions. It supports real-time streaming and historical log access.
When you add this streaming connector, it appears as a JournalD source in your selected pipeline. AI teammates access this data by querying the Edge Delta backend with the Edge Delta MCP connector.
Platform: Linux only (requires systemd)
Add the JournalD Connector
To add the JournalD connector, you configure filtering options and deploy to Linux systems running Edge Delta agents with systemd.
Prerequisites
Before configuring the connector, ensure you have:
- Linux system with systemd and systemd-journald service running
- Edge Delta agent installed with read access to journal files
- Appropriate permissions (systemd-journal group membership or root access)
- Read access to
/var/log/journal/(persistent) or/run/log/journal/(volatile) - Identified systemd units or journal fields to monitor
Configuration Steps
- Navigate to AI Team > Connectors in the Edge Delta application
- Find the JournalD connector in Streaming Connectors
- Click the connector card
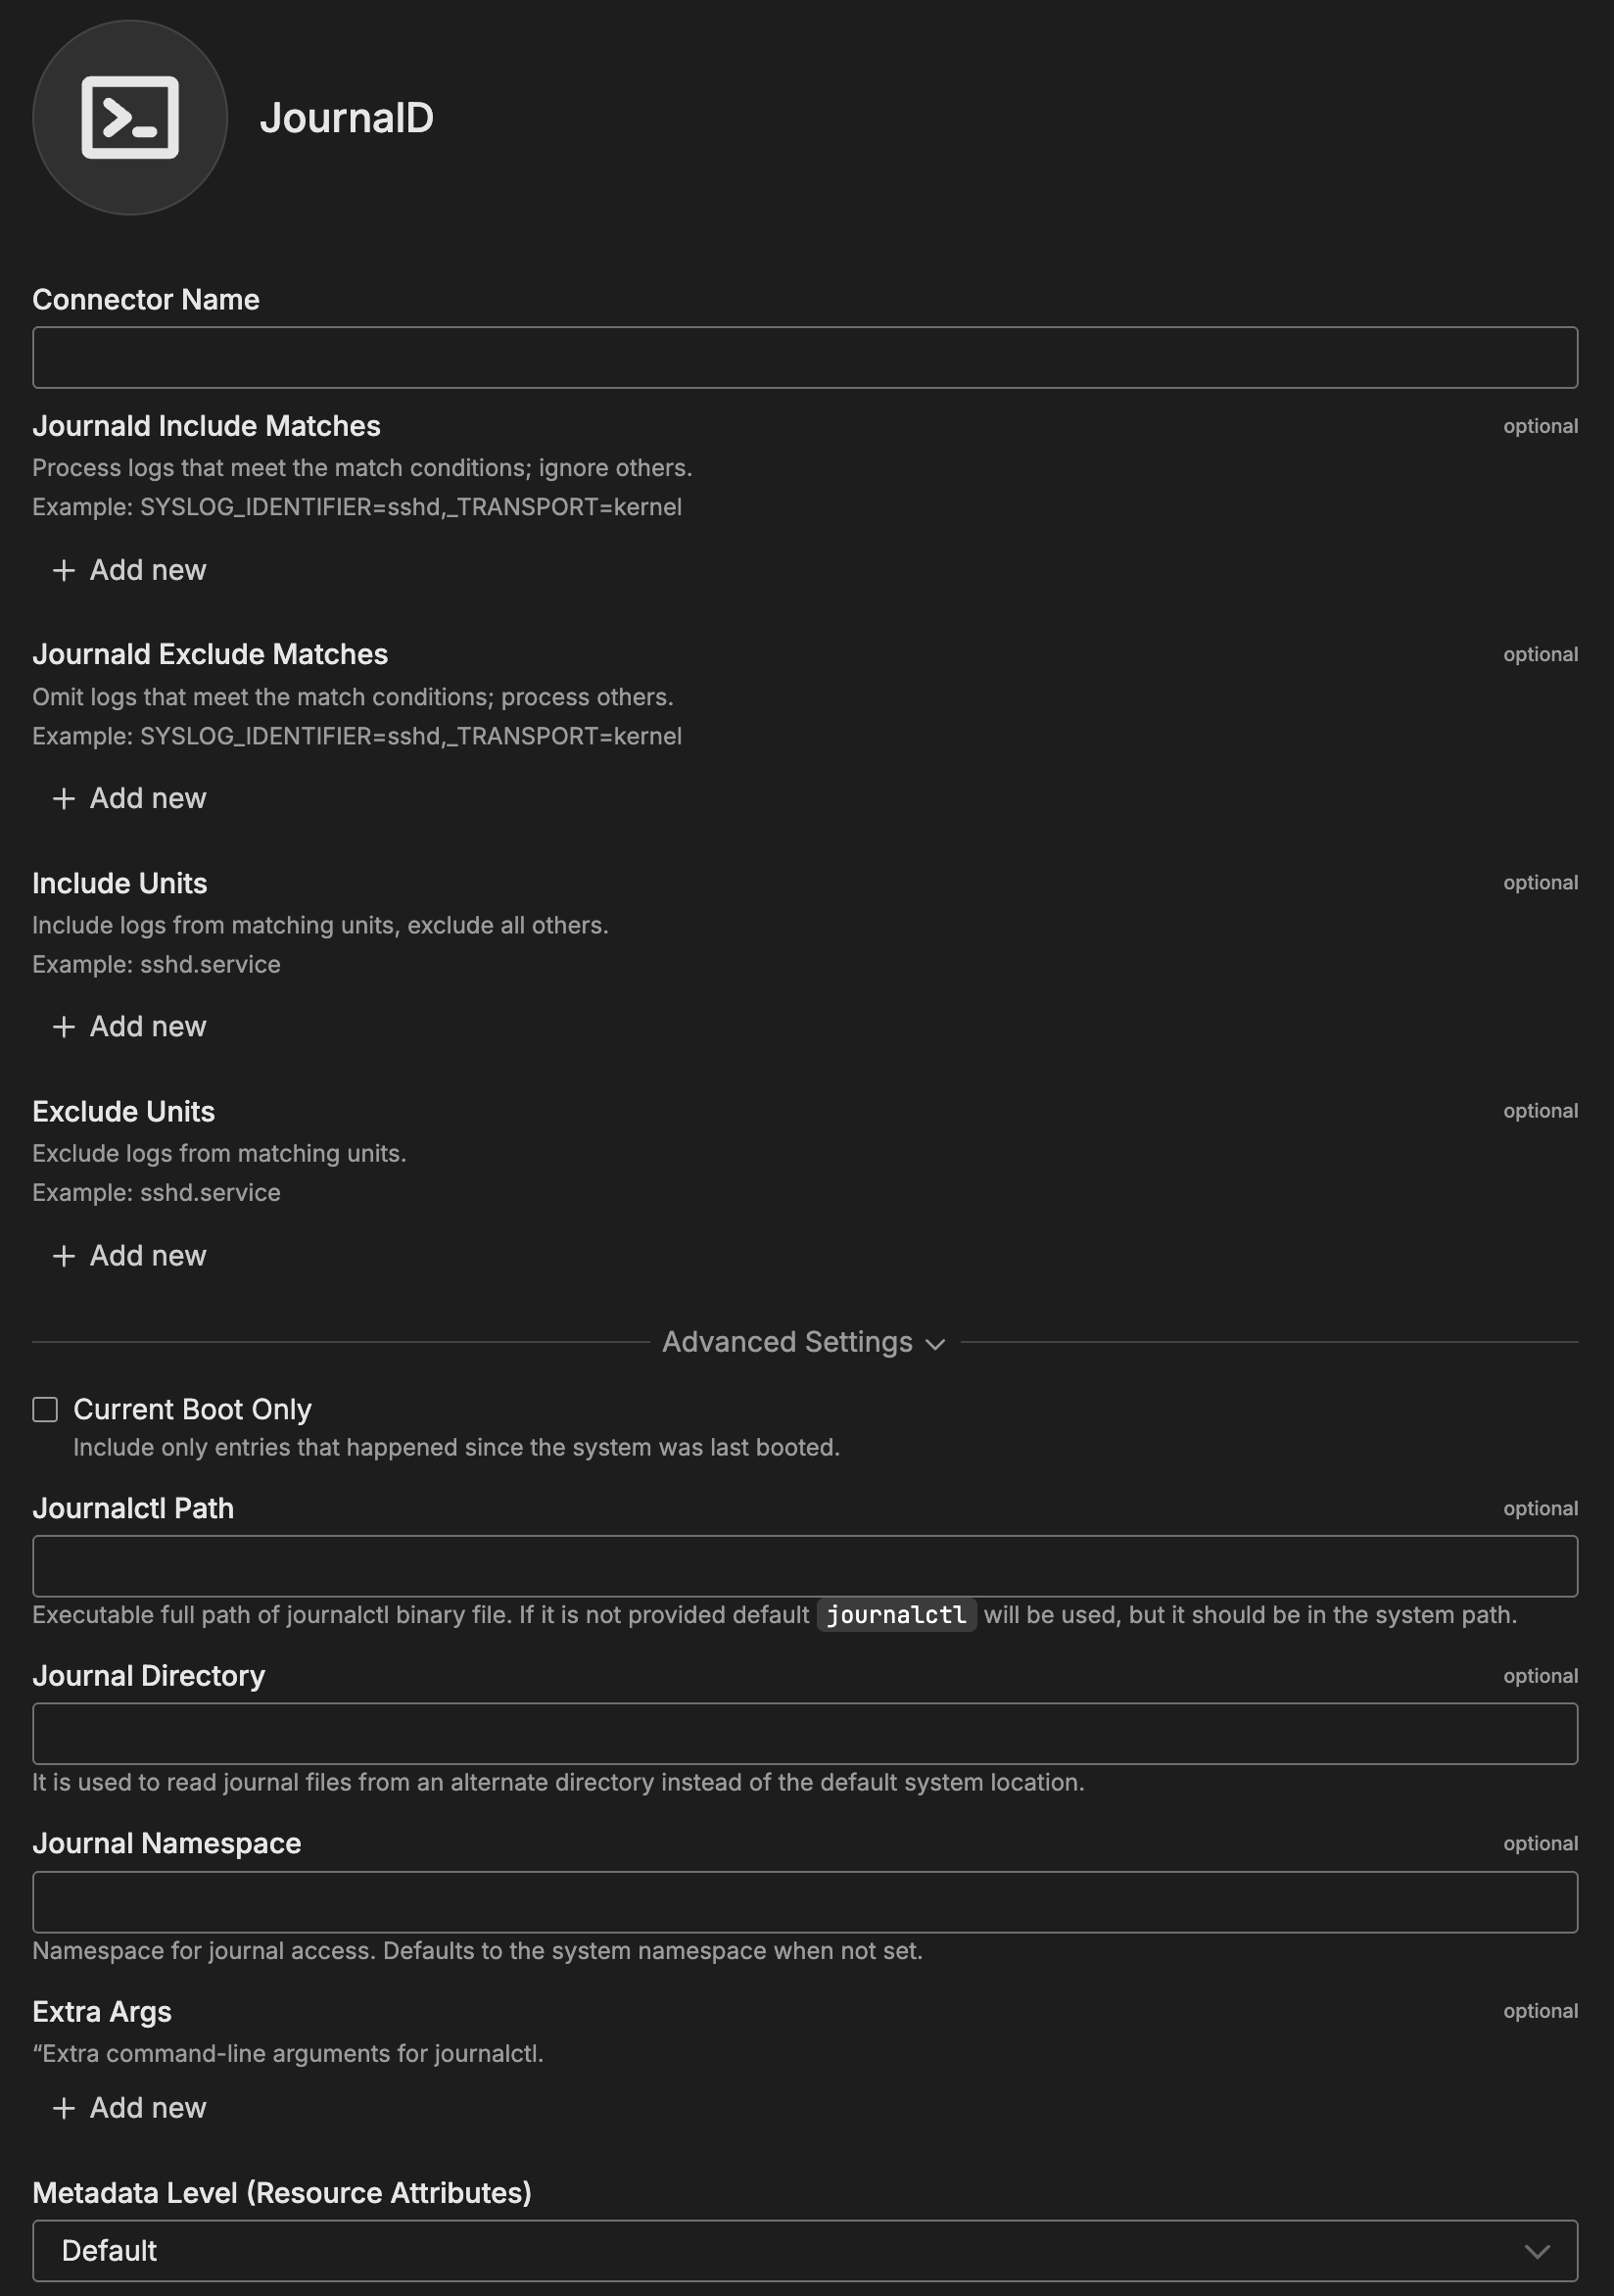
- Configure filtering options:
- Journald Include Matches - Journal fields to include
- Journald Exclude Matches - Journal fields to exclude
- Include Units - Systemd units to include
- Exclude Units - Systemd units to exclude
- Optionally configure Advanced Settings
- Select a target environment (Linux only)
- Click Save
The connector deploys to Linux agents and begins collecting journal logs.
Configuration Options
Connector Name
Name to identify this JournalD connector instance.
Journald Include Matches
Process only logs that meet specified match conditions; ignore all others. Filter by journal field using format FIELD=value with multiple fields comma-separated.
Format: FIELD=value,FIELD2=value2
Examples:
SYSLOG_IDENTIFIER=sshd- SSH service logs only_TRANSPORT=kernel- Kernel messages onlyPRIORITY=3- Error priority onlyCONTAINER_NAME=webapp- Specific container logs
Common Journal Fields:
SYSLOG_IDENTIFIER- Service or program name_TRANSPORT- Log transport (kernel, syslog, journal)PRIORITY- Syslog priority (0-7)_SYSTEMD_UNIT- Systemd unit nameCONTAINER_NAME- Container name
Journald Exclude Matches
Omit logs that meet specified match conditions; process all others. Same format as Include Matches.
Examples:
PRIORITY=6,PRIORITY=7- Exclude info and debug messages_TRANSPORT=audit- Exclude audit subsystem logsSYSLOG_IDENTIFIER=systemd-resolved- Exclude DNS resolver logs
Include Units
Include logs from matching systemd units; exclude all others. Convenient way to focus on specific services.
Format: Comma-separated list of systemd unit names, supports wildcards
Examples:
sshd.service- Monitor SSH service onlynginx.service,postgresql.service- Web and database servicesdocker.service- Docker daemonuser@*.service- All user services
Exclude Units
Exclude logs from matching systemd units; include all others. Useful for filtering out noisy services.
Examples:
systemd-resolved.service- Exclude DNS resolver logscron.service,systemd-timesyncd.service- Exclude cron and time sync
Advanced Settings
Current Boot Only
Include only entries from the current boot session. Useful for real-time monitoring vs. historical analysis.
Default: Disabled (collect all historical logs)
When to Enable:
- Real-time service monitoring
- Focus on current system state
- Reduce data volume
When to Disable:
- Historical troubleshooting
- Forensic analysis
- Investigating issues across boots
Journalctl Path
Full executable path to journalctl binary if not in standard system PATH.
Default: System journalctl from PATH (/usr/bin/journalctl or /bin/journalctl)
Examples:
/usr/bin/journalctl- Standard location/opt/custom/bin/journalctl- Custom installation
Journal Directory
Read journal files from alternate directory instead of default system location.
Default: /var/log/journal/ (persistent) or /run/log/journal/ (volatile)
Examples:
/mnt/archive/journal- Archived journal location/mnt/remote/system-journal- Remotely mounted journal/var/log/custom-journal- Custom journal directory
Use Cases:
- Analyzing archived journals
- Reading from mounted remote systems
- Accessing namespace-specific journals
Journal Namespace
Namespace for journal access. Systemd supports namespaces to isolate logs from different applications or containers.
Default: System namespace
Examples:
container- Container-specific namespacemyapp- Custom application namespace
Extra Args
Additional command-line arguments passed directly to journalctl for advanced filtering.
Format: Space-separated journalctl arguments
Examples:
-k- Kernel messages only (equivalent to--dmesg)-f- Follow mode for real-time streaming--no-pager --no-tail- Full output without truncation-o json-pretty- Pretty-printed JSON output--since "2024-10-01 00:00:00"- Logs since specific timestamp
Metadata Level
This option is used to define which detected resources and attributes to add to each data item as it is ingested by Edge Delta. You can select:
- Required Only: This option includes the minimum required resources and attributes for Edge Delta to operate.
- Default: This option includes the required resources and attributes plus those selected by Edge Delta
- High: This option includes the required resources and attributes along with a larger selection of common optional fields.
- Custom: With this option selected, you can choose which attributes and resources to include. The required fields are selected by default and can’t be unchecked.
Based on your selection in the GUI, the source_metadata YAML is populated as two dictionaries (resource_attributes and attributes) with Boolean values.
See Choose Data Item Metadata for more information on selecting metadata.
JournalD-specific metadata included:
host.id- Host identifierservice.namespace- Service namespacesystemd.transport- Transport typeprocess.name- Process name
Rate Limit
The rate_limit parameter enables you to control data ingestion based on system resource usage. This advanced setting helps prevent source nodes from overwhelming the agent by automatically throttling or stopping data collection when CPU or memory thresholds are exceeded.
Use rate limiting to prevent runaway log collection from overwhelming the agent in high-volume sources, protect agent stability in resource-constrained environments with limited CPU/memory, automatically throttle during bursty traffic patterns, and ensure fair resource allocation across source nodes in multi-tenant deployments.
When rate limiting triggers, pull-based sources (File, S3, HTTP Pull) stop fetching new data, push-based sources (HTTP, TCP, UDP, OTLP) reject incoming data, and stream-based sources (Kafka, Pub/Sub) pause consumption. Rate limiting operates at the source node level, where each source with rate limiting enabled independently monitors and enforces its own thresholds.
Rate limiting vs backpressure: Rate limiting and backpressure are different mechanisms. Rate limiting controls data ingestion at the source based on CPU or memory thresholds. Backpressure controls data output at the destination when in-memory queues fill up. Backpressure logs such as
backpressure: dataCh at 92% capacitydo not appear when rate limiting triggers, and rate limiting logs do not appear during backpressure events.
Observability: When rate limiting is active in enforce mode, the agent does not produce INFO, WARN, or ERROR level logs. To confirm that rate limiting is triggering, check the source node’s Bytes I/O metrics in the Edge Delta app for gaps or drops that coincide with expected throttling periods.
Configuration Steps:
- Click Add New in the Rate Limit section
- Click Add New for Evaluation Policy
- Select Policy Type:
- CPU Usage: Monitors CPU consumption and rate limits when usage exceeds defined thresholds. Use for CPU-intensive sources like file parsing or complex transformations.
- Memory Usage: Monitors memory consumption and rate limits when usage exceeds defined thresholds. Use for memory-intensive sources like large message buffers or caching.
- AND (composite): Combines multiple sub-policies with AND logic. All sub-policies must be true simultaneously to trigger rate limiting. Use when you want conservative rate limiting (both CPU and memory must be high).
- OR (composite): Combines multiple sub-policies with OR logic. Any sub-policy can trigger rate limiting. Use when you want aggressive rate limiting (either CPU or memory being high triggers).
- Select Evaluation Mode. Choose how the policy behaves when thresholds are exceeded:
- Enforce (default): Actively applies rate limiting when thresholds are met. Pull-based sources (File, S3, HTTP Pull) stop fetching new data, push-based sources (HTTP, TCP, UDP, OTLP) reject incoming data, and stream-based sources (Kafka, Pub/Sub) pause consumption. Use in production to protect agent resources.
- Monitor: Logs when rate limiting would occur without actually limiting data flow. Use for testing thresholds before enforcing them in production.
- Passthrough: Disables rate limiting entirely while keeping the configuration in place. Use to temporarily disable rate limiting without removing configuration.
- Set Absolute Limits and Relative Limits (for CPU Usage and Memory Usage policies)
Note: If you specify both absolute and relative limits, the system evaluates both conditions and rate limiting triggers when either condition is met (OR logic). For example, if you set absolute limit to
1.0CPU cores and relative limit to50%, rate limiting triggers when the source uses either 1 full core OR 50% of available CPU, whichever happens first.
For CPU Absolute Limits: Enter value in full core units:
0.1= one-tenth of a CPU core0.5= half a CPU core1.0= one full CPU core2.0= two full CPU cores
For CPU Relative Limits: Enter percentage of total available CPU (0-100):
50= 50% of available CPU75= 75% of available CPU85= 85% of available CPU
For Memory Absolute Limits: Enter value in bytes
104857600= 100Mi (100 × 1024 × 1024)536870912= 512Mi (512 × 1024 × 1024)1073741824= 1Gi (1 × 1024 × 1024 × 1024)
For Memory Relative Limits: Enter percentage of total available memory (0-100)
60= 60% of available memory75= 75% of available memory80= 80% of available memory
- Set Refresh Interval (for CPU Usage and Memory Usage policies). Specify how frequently the system checks resource usage:
- Recommended Values:
10sto30sfor most use cases5sto10sfor high-volume sources requiring quick response1mor higher for stable, low-volume sources
The system fetches current CPU/memory usage at the specified refresh interval and uses that value for evaluation until the next refresh. Shorter intervals provide more responsive rate limiting but incur slightly higher overhead, while longer intervals are more efficient but slower to react to sudden resource spikes.
The GUI generates YAML as follows:
# Simple CPU-based rate limiting
nodes:
  - name: <node name>
    type: <node type>
    rate_limit:
      evaluation_policy:
        policy_type: cpu_usage
        evaluation_mode: enforce
        absolute_limit: 0.5  # Limit to half a CPU core
        refresh_interval: 10s
# Simple memory-based rate limiting
nodes:
  - name: <node name>
    type: <node type>
    rate_limit:
      evaluation_policy:
        policy_type: memory_usage
        evaluation_mode: enforce
        absolute_limit: 536870912  # 512Mi in bytes
        refresh_interval: 30s
Composite Policies (AND / OR)
When using AND or OR policy types, you define sub-policies instead of limits. Sub-policies must be siblings (at the same level)—do not nest sub-policies within other sub-policies. Each sub-policy is independently evaluated, and the parent policy’s evaluation mode applies to the composite result.
- AND Logic: All sub-policies must evaluate to true at the same time to trigger rate limiting. Use when you want conservative rate limiting (limit only when CPU AND memory are both high).
- OR Logic: Any sub-policy evaluating to true triggers rate limiting. Use when you want aggressive protection (limit when either CPU OR memory is high).
Configuration Steps:
- Select AND (composite) or OR (composite) as the Policy Type
- Choose the Evaluation Mode (typically Enforce)
- Click Add New under Sub-Policies to add the first condition
- Configure the first sub-policy by selecting policy type (CPU Usage or Memory Usage), selecting evaluation mode, setting absolute and/or relative limits, and setting refresh interval
- In the parent policy (not within the child), click Add New again to add a sibling sub-policy
- Configure additional sub-policies following the same pattern
The GUI generates YAML as follows:
# AND composite policy - both CPU AND memory must exceed limits
nodes:
  - name: <node name>
    type: <node type>
    rate_limit:
      evaluation_policy:
        policy_type: and
        evaluation_mode: enforce
        sub_policies:
          # First sub-policy (sibling)
          - policy_type: cpu_usage
            evaluation_mode: enforce
            absolute_limit: 0.75  # Limit to 75% of one core
            refresh_interval: 15s
          # Second sub-policy (sibling)
          - policy_type: memory_usage
            evaluation_mode: enforce
            absolute_limit: 1073741824  # 1Gi in bytes
            refresh_interval: 15s
# OR composite policy - either CPU OR memory can trigger
nodes:
  - name: <node name>
    type: <node type>
    rate_limit:
      evaluation_policy:
        policy_type: or
        evaluation_mode: enforce
        sub_policies:
          - policy_type: cpu_usage
            evaluation_mode: enforce
            relative_limit: 85  # 85% of available CPU
            refresh_interval: 20s
          - policy_type: memory_usage
            evaluation_mode: enforce
            relative_limit: 80  # 80% of available memory
            refresh_interval: 20s
# Monitor mode for testing thresholds
nodes:
  - name: <node name>
    type: <node type>
    rate_limit:
      evaluation_policy:
        policy_type: memory_usage
        evaluation_mode: monitor  # Only logs, doesn't limit
        relative_limit: 70  # Test at 70% before enforcing
        refresh_interval: 30s
Target Environments
Select the Edge Delta pipeline (environment) where you want to deploy this connector. Linux systems only - the connector will only deploy to Linux agents with systemd.
How to Use the JournalD Connector
The JournalD connector integrates seamlessly with AI Team, enabling analysis of systemd journal logs from Linux infrastructure. AI teammates automatically leverage the ingested data based on the queries they receive and the context of the conversation.
Use Case: Service Error Monitoring
Monitor systemd service errors and warnings to catch failures before they impact users. Configure the connector to include only error and warning priority levels (3 and 4) for real-time detection. AI teammates detect patterns, correlate failures across services, and provide actionable recommendations. When combined with PagerDuty alerts, teammates automatically query recent service errors during incident investigation to identify which services failed and in what sequence.
Configuration: Include Matches: PRIORITY=3,PRIORITY=4, Current Boot Only: Enabled
Use Case: SSH Authentication Monitoring
Track SSH authentication activity to detect brute force attacks, unauthorized access attempts, and security breaches. Filter for sshd service logs to capture all authentication events. AI teammates identify attack patterns, suspicious source IPs, and targeted user accounts. This is valuable when investigating security incidents—teammates can correlate failed login attempts with successful breaches and identify compromised accounts.
Configuration: Include Matches: SYSLOG_IDENTIFIER=sshd, Current Boot Only: Disabled for audit trail
Use Case: Kernel Event Analysis
Monitor kernel-level events to detect hardware failures, driver issues, and system-level problems before outages. Filter for kernel transport messages to focus on system events. AI teammates identify critical hardware events, out-of-memory conditions, and network interface issues. When combined with Jira integration, teammates can automatically document hardware problems by querying kernel logs and creating tickets with diagnostic details.
Configuration: Include Matches: _TRANSPORT=kernel, Current Boot Only: Enabled
Troubleshooting
Failed to open journal errors: Add Edge Delta user to systemd-journal group (sudo usermod -a -G systemd-journal edgedelta). Restart Edge Delta service. Verify with groups edgedelta.
No journal logs appearing: Verify systemd-journald is running (systemctl status systemd-journald). Test with journalctl -n 10. Check filters aren’t too restrictive. Review Edge Delta agent logs for errors.
Permission denied on audit logs: Audit logs require elevated privileges. Either grant appropriate Linux capabilities, use audit group membership, or exclude audit logs with Exclude Matches: _TRANSPORT=audit.
Journal directory not found: Check if persistent journal enabled (ls /var/log/journal/). If volatile mode, update Journal Directory to /run/log/journal/. Enable persistent with sudo mkdir -p /var/log/journal/ and restart systemd-journald.
High memory usage: Limit collection with unit or identifier filters. Use priority filtering (PRIORITY=3,PRIORITY=4). Enable Current Boot Only. Configure rate limiting. Exclude noisy services.
Filters not working: Journal fields are case-sensitive. Test with journalctl first (journalctl SYSLOG_IDENTIFIER=sshd -n 10). Multiple Include Matches fields are OR’ed, not AND’ed. List available fields with journalctl -o json | jq 'keys'.
Duplicate logs (journal + syslog): Choose one logging source. Use JournalD connector for systemd systems to get structured metadata. Use Syslog connector for non-systemd systems. If running both, implement careful filtering to separate collection scope.
Large journal disk usage: Configure limits in /etc/systemd/journald.conf: SystemMaxUse (500M-1GB), SystemMaxFileSize (100M-200M), MaxRetentionSec (7day-30day). Restart systemd-journald. Vacuum old files with journalctl --vacuum-time=7d.
Next Steps
- Learn about creating custom teammates that can use journal data
- Explore the Edge Delta MCP connector for querying systemd logs
For additional help, visit AI Team Support.