Kafka Connector
Configure the Kafka connector to collect streaming telemetry data, application logs, and event streams from Apache Kafka topics for AI-powered analysis.
13 minute read
Overview
The Kafka connector collects and streams data from Apache Kafka topics in real-time. Apache Kafka is a distributed event streaming platform handling trillions of events per day. Edge Delta acts as a Kafka consumer, ingesting telemetry data, application logs, events, and metrics. Content streams into Edge Delta Pipelines for analysis by AI teammates through the Edge Delta MCP connector.
The connector supports Apache Kafka 0.10+, Confluent Cloud, AWS MSK, and managed Kafka services. It handles consumer group management, offset tracking, and reliable message consumption.
When you add this streaming connector, it appears as a Kafka source in your selected pipeline. AI teammates access this data by querying the Edge Delta backend with the Edge Delta MCP connector.
Add the Kafka Connector
To add the Kafka connector, you configure Edge Delta as a Kafka consumer with broker addresses, topic names, and authentication credentials.
Prerequisites
Before configuring the connector, ensure you have:
- Access to Apache Kafka cluster (self-hosted, Confluent Cloud, AWS MSK, or managed service)
- Kafka broker addresses and port numbers (typically 9092 for plaintext or 9093 for SSL/TLS)
- Authentication credentials if cluster requires SASL or SSL/TLS
- Identified Kafka topics containing logs, metrics, or events to analyze
Configuration Steps
- Navigate to AI Team > Connectors in the Edge Delta application
- Find the Kafka connector in Streaming Connectors
- Click the connector card
- Configure the Endpoint with broker addresses (comma-separated)
- Specify the Topic to consume from
- Optionally configure Advanced Settings for Group ID, batch size, TLS, or SASL
- Select a target environment
- Click Save
The connector deploys and begins consuming messages from specified Kafka topics.
Configuration Options
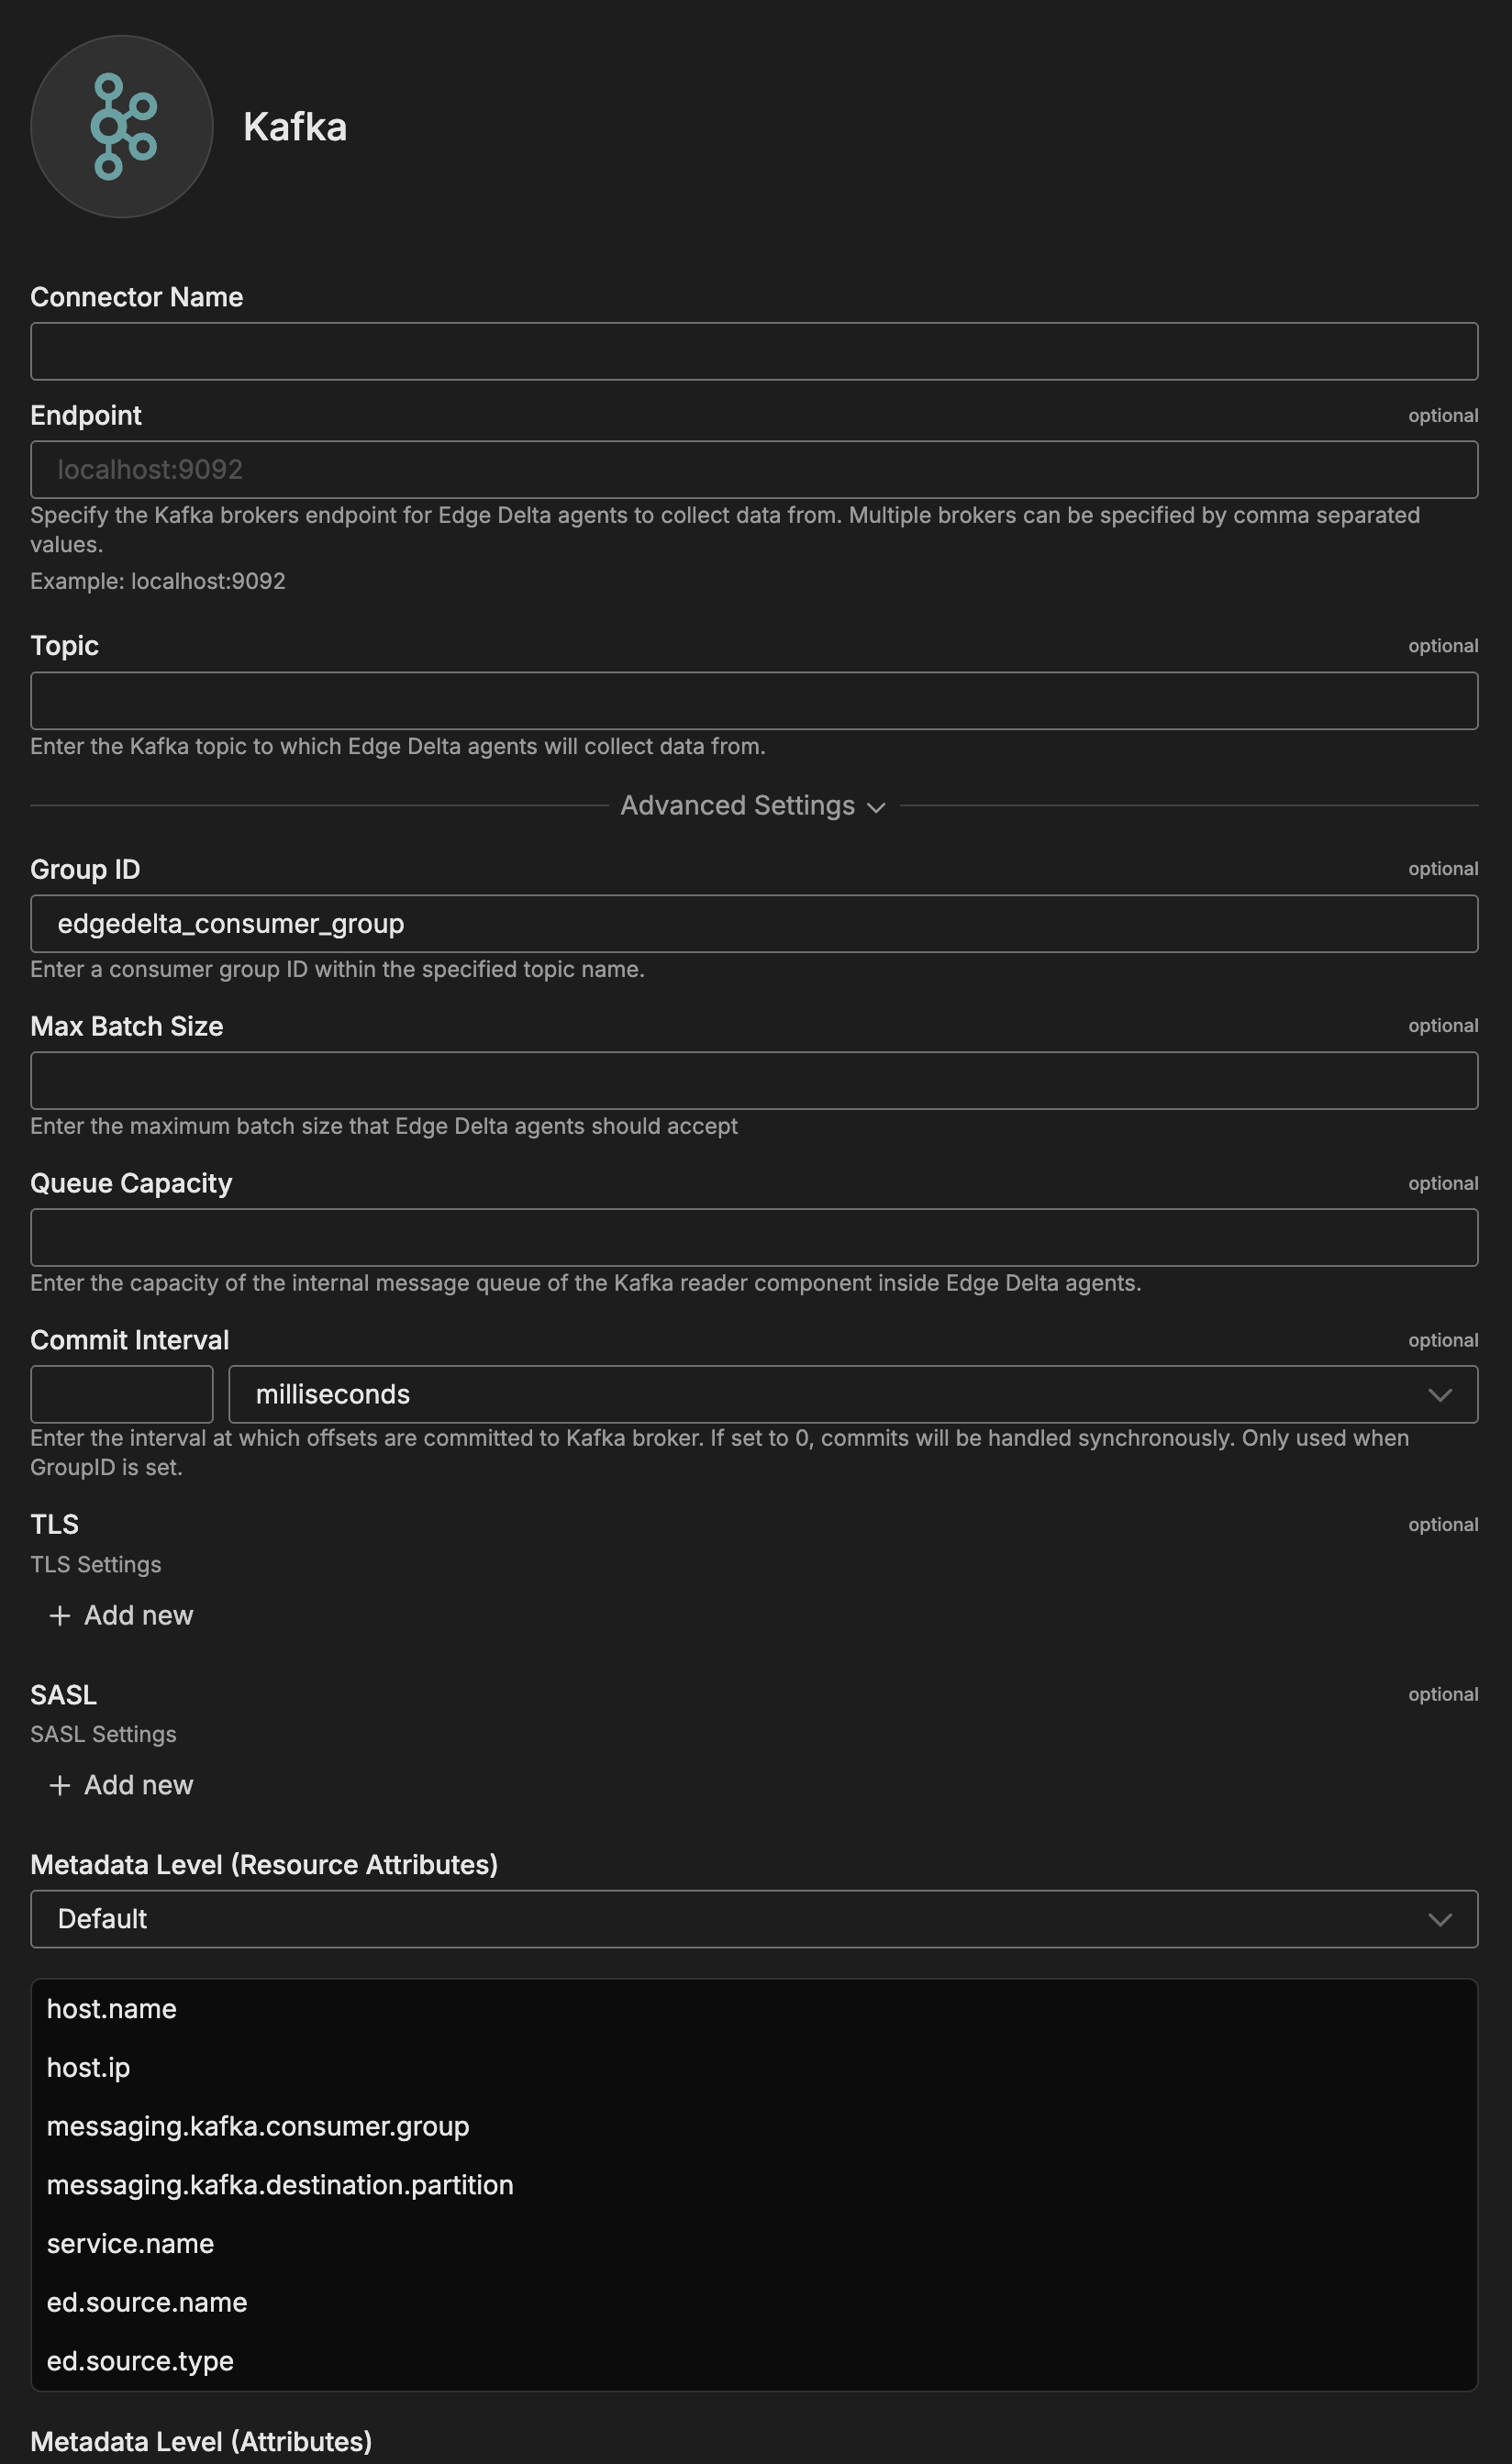
Connector Name
Name to identify this Kafka connector instance.
Endpoint
Kafka brokers endpoint for collecting data. Multiple brokers can be specified comma-separated.
Format: host1:port1,host2:port2,host3:port3
Examples:
localhost:9092- Single brokerkafka-broker-1:9092,kafka-broker-2:9092,kafka-broker-3:9092- Multiple brokerspkc-abc123.us-east-1.aws.confluent.cloud:9092- Confluent Cloudb-1.mycluster.xyz.kafka.us-east-1.amazonaws.com:9092- AWS MSK
Port Notes:
9092- Plaintext connections9093- SSL/TLS encrypted connections
Topic
Kafka topic to collect data from. Specify topic name to subscribe to.
Format: Topic name string
Examples:
application-logs- Single topicsystem-metrics- Metrics topicuser-events- Events topic
Advanced Settings
Group ID
Consumer group ID within the specified topic name. Kafka uses this to coordinate partition assignment and track consumption offsets.
Default: edgedelta_consumer_group
Examples:
edgedelta-production- Production consumer groupedgedelta-logs-consumer- Logs-specific groupedgedelta-event-correlation- Event processing group
Note: All agents with same Group ID share partition consumption. Use different Group IDs for independent consumption.
Max Batch Size
Maximum batch size that agents should accept.
Use Cases:
- Control memory usage
- Limit processing batch size
- Tune performance for message size
Queue Capacity
Capacity of the internal message queue of the Kafka reader component.
Use Cases:
- Buffer messages during processing
- Handle burst traffic
- Manage backpressure
Commit Interval
Interval at which offsets are committed to Kafka broker. If set to 0, commits handled synchronously. Only used when Group ID is set.
Format: Duration in milliseconds
Examples:
5000- Commit every 5 seconds10000- Commit every 10 seconds0- Synchronous commits (every message)
Trade-offs:
- Lower values: More frequent commits, less data loss on failure, higher overhead
- Higher values: Less overhead, potential duplicate processing on restart
TLS
Optional TLS/SSL configuration for encrypted connections.
Configuration Options:
- Ignore Certificate Check: Disables SSL/TLS certificate verification. Use with caution in testing environments only.
- CA File: Absolute file path to the CA certificate for SSL/TLS connections
- CA Path: Absolute path where CA certificate files are located
- CRT File: Absolute path to the SSL/TLS certificate file
- Key File: Absolute path to the private key file
- Key Password: Optional password for the key file
- Client Auth Type: Client authentication type. Default is noclientcert.
- Minimum Version: Minimum TLS version. Default is TLSv1_2.
- Maximum Version: Maximum TLS version allowed for connections
When to Enable:
- Production deployments
- Public Kafka clusters
- Confluent Cloud
- AWS MSK with encryption
SASL
SASL authentication settings for secure broker connections.
Configuration Options:
- Username: Username for SASL authentication
- For Confluent Cloud: API key
- For self-hosted: Configured username
- Password: Password for SASL authentication
- For Confluent Cloud: API secret
- For self-hosted: User password
- Mechanism: SASL mechanism for authentication
- Options: PLAIN, SCRAM-SHA-256, SCRAM-SHA-512, AWS_MSK_IAM
Mechanism Selection:
- PLAIN: Username/password over TLS (Confluent Cloud)
- SCRAM-SHA-256: Secure challenge-response (recommended)
- SCRAM-SHA-512: Higher security SCRAM variant
- AWS_MSK_IAM: IAM-based auth for AWS MSK
Security Note: Always use SASL with TLS for production. PLAIN mechanism requires TLS to protect credentials.
Metadata Level
This option is used to define which detected resources and attributes to add to each data item as it is ingested by Edge Delta. You can select:
- Required Only: This option includes the minimum required resources and attributes for Edge Delta to operate.
- Default: This option includes the required resources and attributes plus those selected by Edge Delta
- High: This option includes the required resources and attributes along with a larger selection of common optional fields.
- Custom: With this option selected, you can choose which attributes and resources to include. The required fields are selected by default and can’t be unchecked.
Based on your selection in the GUI, the source_metadata YAML is populated as two dictionaries (resource_attributes and attributes) with Boolean values.
See Choose Data Item Metadata for more information on selecting metadata.
Kafka-specific metadata included:
messaging.kafka.consumer.group- Consumer group IDmessaging.kafka.destination.partition- Partition number
Rate Limit
The rate_limit parameter enables you to control data ingestion based on system resource usage. This advanced setting helps prevent source nodes from overwhelming the agent by automatically throttling or stopping data collection when CPU or memory thresholds are exceeded.
Use rate limiting to prevent runaway log collection from overwhelming the agent in high-volume sources, protect agent stability in resource-constrained environments with limited CPU/memory, automatically throttle during bursty traffic patterns, and ensure fair resource allocation across source nodes in multi-tenant deployments.
When rate limiting triggers, pull-based sources (File, S3, HTTP Pull) stop fetching new data, push-based sources (HTTP, TCP, UDP, OTLP) reject incoming data, and stream-based sources (Kafka, Pub/Sub) pause consumption. Rate limiting operates at the source node level, where each source with rate limiting enabled independently monitors and enforces its own thresholds.
Rate limiting vs backpressure: Rate limiting and backpressure are different mechanisms. Rate limiting controls data ingestion at the source based on CPU or memory thresholds. Backpressure controls data output at the destination when in-memory queues fill up. Backpressure logs such as
backpressure: dataCh at 92% capacitydo not appear when rate limiting triggers, and rate limiting logs do not appear during backpressure events.
Observability: When rate limiting is active in enforce mode, the agent does not produce INFO, WARN, or ERROR level logs. To confirm that rate limiting is triggering, check the source node’s Bytes I/O metrics in the Edge Delta app for gaps or drops that coincide with expected throttling periods.
Configuration Steps:
- Click Add New in the Rate Limit section
- Click Add New for Evaluation Policy
- Select Policy Type:
- CPU Usage: Monitors CPU consumption and rate limits when usage exceeds defined thresholds. Use for CPU-intensive sources like file parsing or complex transformations.
- Memory Usage: Monitors memory consumption and rate limits when usage exceeds defined thresholds. Use for memory-intensive sources like large message buffers or caching.
- AND (composite): Combines multiple sub-policies with AND logic. All sub-policies must be true simultaneously to trigger rate limiting. Use when you want conservative rate limiting (both CPU and memory must be high).
- OR (composite): Combines multiple sub-policies with OR logic. Any sub-policy can trigger rate limiting. Use when you want aggressive rate limiting (either CPU or memory being high triggers).
- Select Evaluation Mode. Choose how the policy behaves when thresholds are exceeded:
- Enforce (default): Actively applies rate limiting when thresholds are met. Pull-based sources (File, S3, HTTP Pull) stop fetching new data, push-based sources (HTTP, TCP, UDP, OTLP) reject incoming data, and stream-based sources (Kafka, Pub/Sub) pause consumption. Use in production to protect agent resources.
- Monitor: Logs when rate limiting would occur without actually limiting data flow. Use for testing thresholds before enforcing them in production.
- Passthrough: Disables rate limiting entirely while keeping the configuration in place. Use to temporarily disable rate limiting without removing configuration.
- Set Absolute Limits and Relative Limits (for CPU Usage and Memory Usage policies)
Note: If you specify both absolute and relative limits, the system evaluates both conditions and rate limiting triggers when either condition is met (OR logic). For example, if you set absolute limit to
1.0CPU cores and relative limit to50%, rate limiting triggers when the source uses either 1 full core OR 50% of available CPU, whichever happens first.
For CPU Absolute Limits: Enter value in full core units:
0.1= one-tenth of a CPU core0.5= half a CPU core1.0= one full CPU core2.0= two full CPU cores
For CPU Relative Limits: Enter percentage of total available CPU (0-100):
50= 50% of available CPU75= 75% of available CPU85= 85% of available CPU
For Memory Absolute Limits: Enter value in bytes
104857600= 100Mi (100 × 1024 × 1024)536870912= 512Mi (512 × 1024 × 1024)1073741824= 1Gi (1 × 1024 × 1024 × 1024)
For Memory Relative Limits: Enter percentage of total available memory (0-100)
60= 60% of available memory75= 75% of available memory80= 80% of available memory
- Set Refresh Interval (for CPU Usage and Memory Usage policies). Specify how frequently the system checks resource usage:
- Recommended Values:
10sto30sfor most use cases5sto10sfor high-volume sources requiring quick response1mor higher for stable, low-volume sources
The system fetches current CPU/memory usage at the specified refresh interval and uses that value for evaluation until the next refresh. Shorter intervals provide more responsive rate limiting but incur slightly higher overhead, while longer intervals are more efficient but slower to react to sudden resource spikes.
The GUI generates YAML as follows:
# Simple CPU-based rate limiting
nodes:
  - name: <node name>
    type: <node type>
    rate_limit:
      evaluation_policy:
        policy_type: cpu_usage
        evaluation_mode: enforce
        absolute_limit: 0.5  # Limit to half a CPU core
        refresh_interval: 10s
# Simple memory-based rate limiting
nodes:
  - name: <node name>
    type: <node type>
    rate_limit:
      evaluation_policy:
        policy_type: memory_usage
        evaluation_mode: enforce
        absolute_limit: 536870912  # 512Mi in bytes
        refresh_interval: 30s
Composite Policies (AND / OR)
When using AND or OR policy types, you define sub-policies instead of limits. Sub-policies must be siblings (at the same level)—do not nest sub-policies within other sub-policies. Each sub-policy is independently evaluated, and the parent policy’s evaluation mode applies to the composite result.
- AND Logic: All sub-policies must evaluate to true at the same time to trigger rate limiting. Use when you want conservative rate limiting (limit only when CPU AND memory are both high).
- OR Logic: Any sub-policy evaluating to true triggers rate limiting. Use when you want aggressive protection (limit when either CPU OR memory is high).
Configuration Steps:
- Select AND (composite) or OR (composite) as the Policy Type
- Choose the Evaluation Mode (typically Enforce)
- Click Add New under Sub-Policies to add the first condition
- Configure the first sub-policy by selecting policy type (CPU Usage or Memory Usage), selecting evaluation mode, setting absolute and/or relative limits, and setting refresh interval
- In the parent policy (not within the child), click Add New again to add a sibling sub-policy
- Configure additional sub-policies following the same pattern
The GUI generates YAML as follows:
# AND composite policy - both CPU AND memory must exceed limits
nodes:
  - name: <node name>
    type: <node type>
    rate_limit:
      evaluation_policy:
        policy_type: and
        evaluation_mode: enforce
        sub_policies:
          # First sub-policy (sibling)
          - policy_type: cpu_usage
            evaluation_mode: enforce
            absolute_limit: 0.75  # Limit to 75% of one core
            refresh_interval: 15s
          # Second sub-policy (sibling)
          - policy_type: memory_usage
            evaluation_mode: enforce
            absolute_limit: 1073741824  # 1Gi in bytes
            refresh_interval: 15s
# OR composite policy - either CPU OR memory can trigger
nodes:
  - name: <node name>
    type: <node type>
    rate_limit:
      evaluation_policy:
        policy_type: or
        evaluation_mode: enforce
        sub_policies:
          - policy_type: cpu_usage
            evaluation_mode: enforce
            relative_limit: 85  # 85% of available CPU
            refresh_interval: 20s
          - policy_type: memory_usage
            evaluation_mode: enforce
            relative_limit: 80  # 80% of available memory
            refresh_interval: 20s
# Monitor mode for testing thresholds
nodes:
  - name: <node name>
    type: <node type>
    rate_limit:
      evaluation_policy:
        policy_type: memory_usage
        evaluation_mode: monitor  # Only logs, doesn't limit
        relative_limit: 70  # Test at 70% before enforcing
        refresh_interval: 30s
Target Environments
Select the Edge Delta pipeline (environment) where you want to deploy this connector.
Consumer Group Behavior:
- Same Group ID across environments: Load-balanced consumption (messages split)
- Different Group IDs: Independent consumption (all messages to each)
How to Use the Kafka Connector
The Kafka connector integrates seamlessly with AI Team, enabling real-time analysis of streaming data from Kafka topics. AI teammates automatically leverage the ingested data based on the queries they receive and the context of the conversation.
Use Case: Real-Time Application Log Analysis
Collect application logs from microservices publishing to Kafka topics for immediate analysis. AI teammates identify error patterns, correlate with deployment events, and provide resolution recommendations within seconds. When combined with PagerDuty alerts, teammates automatically query Kafka-sourced logs during incident investigation to identify root causes across distributed services.
Configuration: Endpoint: kafka-prod:9092,kafka-prod-2:9092, Topic: app-logs-production, Group ID: edgedelta-prod-logs, SASL: SCRAM-SHA-256, TLS: Enabled
Use Case: Multi-Service Event Correlation
Correlate events across multiple Kafka topics to reconstruct user journeys and identify failure points in complex workflows. AI teammates trace sessions across services (auth, orders, payments), identify where transactions fail, and pinpoint root causes even when failures manifest in downstream services. This is valuable for troubleshooting e-commerce checkouts or multi-step business processes.
Configuration: Configure separate connectors for each topic (user-events, order-events, payment-events) with same Group ID, or use different Group IDs for independent consumption.
Use Case: System Metrics Anomaly Detection
Monitor metrics flowing through Kafka (API response times, connection pools, error rates) for anomalies indicating performance degradation. AI teammates analyze current values against baselines, identify deviations, and correlate anomalies across systems. When combined with Jira integration, teammates automatically document performance issues by querying metric trends and creating tickets with diagnostic details.
Configuration: Endpoint: confluent-cloud:9092, Topic: system-metrics, SASL: PLAIN (Confluent API key/secret), TLS: Enabled
Troubleshooting
Connection failures: Verify broker addresses reachable from agent network (telnet kafka-broker:9092). Confirm topics exist (kafka-topics --list --bootstrap-server <broker>). Check consumer group connecting (kafka-consumer-groups --describe --group <group> --bootstrap-server <broker>).
SASL authentication failed: Verify SASL mechanism matches cluster configuration. For Confluent Cloud, use PLAIN with API key as username and API secret as password. For AWS MSK IAM, ensure agent IAM role has Kafka cluster permissions. Check credentials for typos (case-sensitive).
SSL handshake failed: Verify brokers configured for TLS on specified port (typically 9093). Check certificate validity (openssl s_client -connect kafka-broker:9093 -showcerts). For self-signed certificates, disable Verify Certificate (testing only). For production, ensure Edge Delta trusts your CA.
High consumer lag: Increase Edge Delta agents to distribute partition consumption. Optimize processing pipeline (simplify regex, reduce aggregations). Increase topic partition count for greater parallelism. Monitor partition assignment (kafka-consumer-groups --describe).
Offset out of range: Committed offset points to deleted message (retention expired). Reset offset to Latest (skip gap) or Earliest (oldest available). Delete consumer group offsets to force new strategy (kafka-consumer-groups --delete --group <group> --bootstrap-server <broker>).
Messages malformed/unparsed: Verify message format matches expectations (kafka-console-consumer --topic <topic> --bootstrap-server <broker> --max-messages 5). Check messages are valid JSON without extra text. For non-JSON formats (Avro, Protobuf), add custom processing to deserialize.
Messages split between pipelines: Multiple deployments sharing same Group ID causes Kafka to distribute partitions (load balancing). For independent consumption, use different Group IDs per pipeline. For load balancing, use same Group ID with enough partitions for parallelism.
Next Steps
- Learn about Kafka input node for advanced configuration and offset management
- Explore Kafka output preparation for sending data to Kafka
- Learn about creating custom teammates that can use Kafka streaming data
For additional help, visit AI Team Support.