Kubernetes Events Connector
Configure the Kubernetes Events connector to monitor cluster events for AI-powered analysis of pod lifecycle changes, resource issues, and cluster operations.
11 minute read
Overview
Note: This connector is also included when you create the bundled Kubernetes connector, which provisions Logs, Metrics, Traces, Service Map, and Events sources together.
The Kubernetes Events connector monitors and collects Kubernetes cluster events in real-time. Kubernetes events document state changes and operational activities including pod lifecycle changes, resource allocation decisions, scheduling operations, configuration issues, and node health conditions. Content streams into Edge Delta Pipelines for analysis by AI teammates through the Edge Delta MCP connector.
The connector watches the Kubernetes API continuously, capturing events that Kubernetes discards after one hour. This enables long-term historical analysis, anomaly detection, and compliance auditing.
When you add this streaming connector, it appears as a Kubernetes Events source in your selected pipeline. AI teammates access this data by querying the Edge Delta backend with the Edge Delta MCP connector.
Platform: Kubernetes only (requires in-cluster deployment)
Add the Kubernetes Events Connector
To add the Kubernetes Events connector, you configure it in AI Team and deploy to an Edge Delta pipeline running in your Kubernetes cluster.
Prerequisites
Before configuring the connector, ensure you have:
- Edge Delta agent deployed in Kubernetes cluster with API access
- Service account configured with event read permissions (get, list, watch)
- RBAC configured with ClusterRole or Role
Required RBAC Configuration:
apiVersion: rbac.authorization.k8s.io/v1
kind: ClusterRole
metadata:
  name: edgedelta-events-reader
rules:
- apiGroups: [""]
  resources: ["events"]
  verbs: ["get", "list", "watch"]
---
apiVersion: rbac.authorization.k8s.io/v1
kind: ClusterRoleBinding
metadata:
  name: edgedelta-events-reader-binding
subjects:
- kind: ServiceAccount
  name: edgedelta
  namespace: edgedelta
roleRef:
  kind: ClusterRole
  name: edgedelta-events-reader
  apiGroup: rbac.authorization.k8s.io
Configuration Steps
- Navigate to AI Team > Connectors in the Edge Delta application
- Find the Kubernetes Events connector in Streaming Connectors
- Click the connector card
- Optionally configure Advanced Settings for Report Interval
- Select a target environment (Kubernetes deployment)
- Click Save
The connector deploys to agents and begins watching the Kubernetes API for events.
Configuration Options
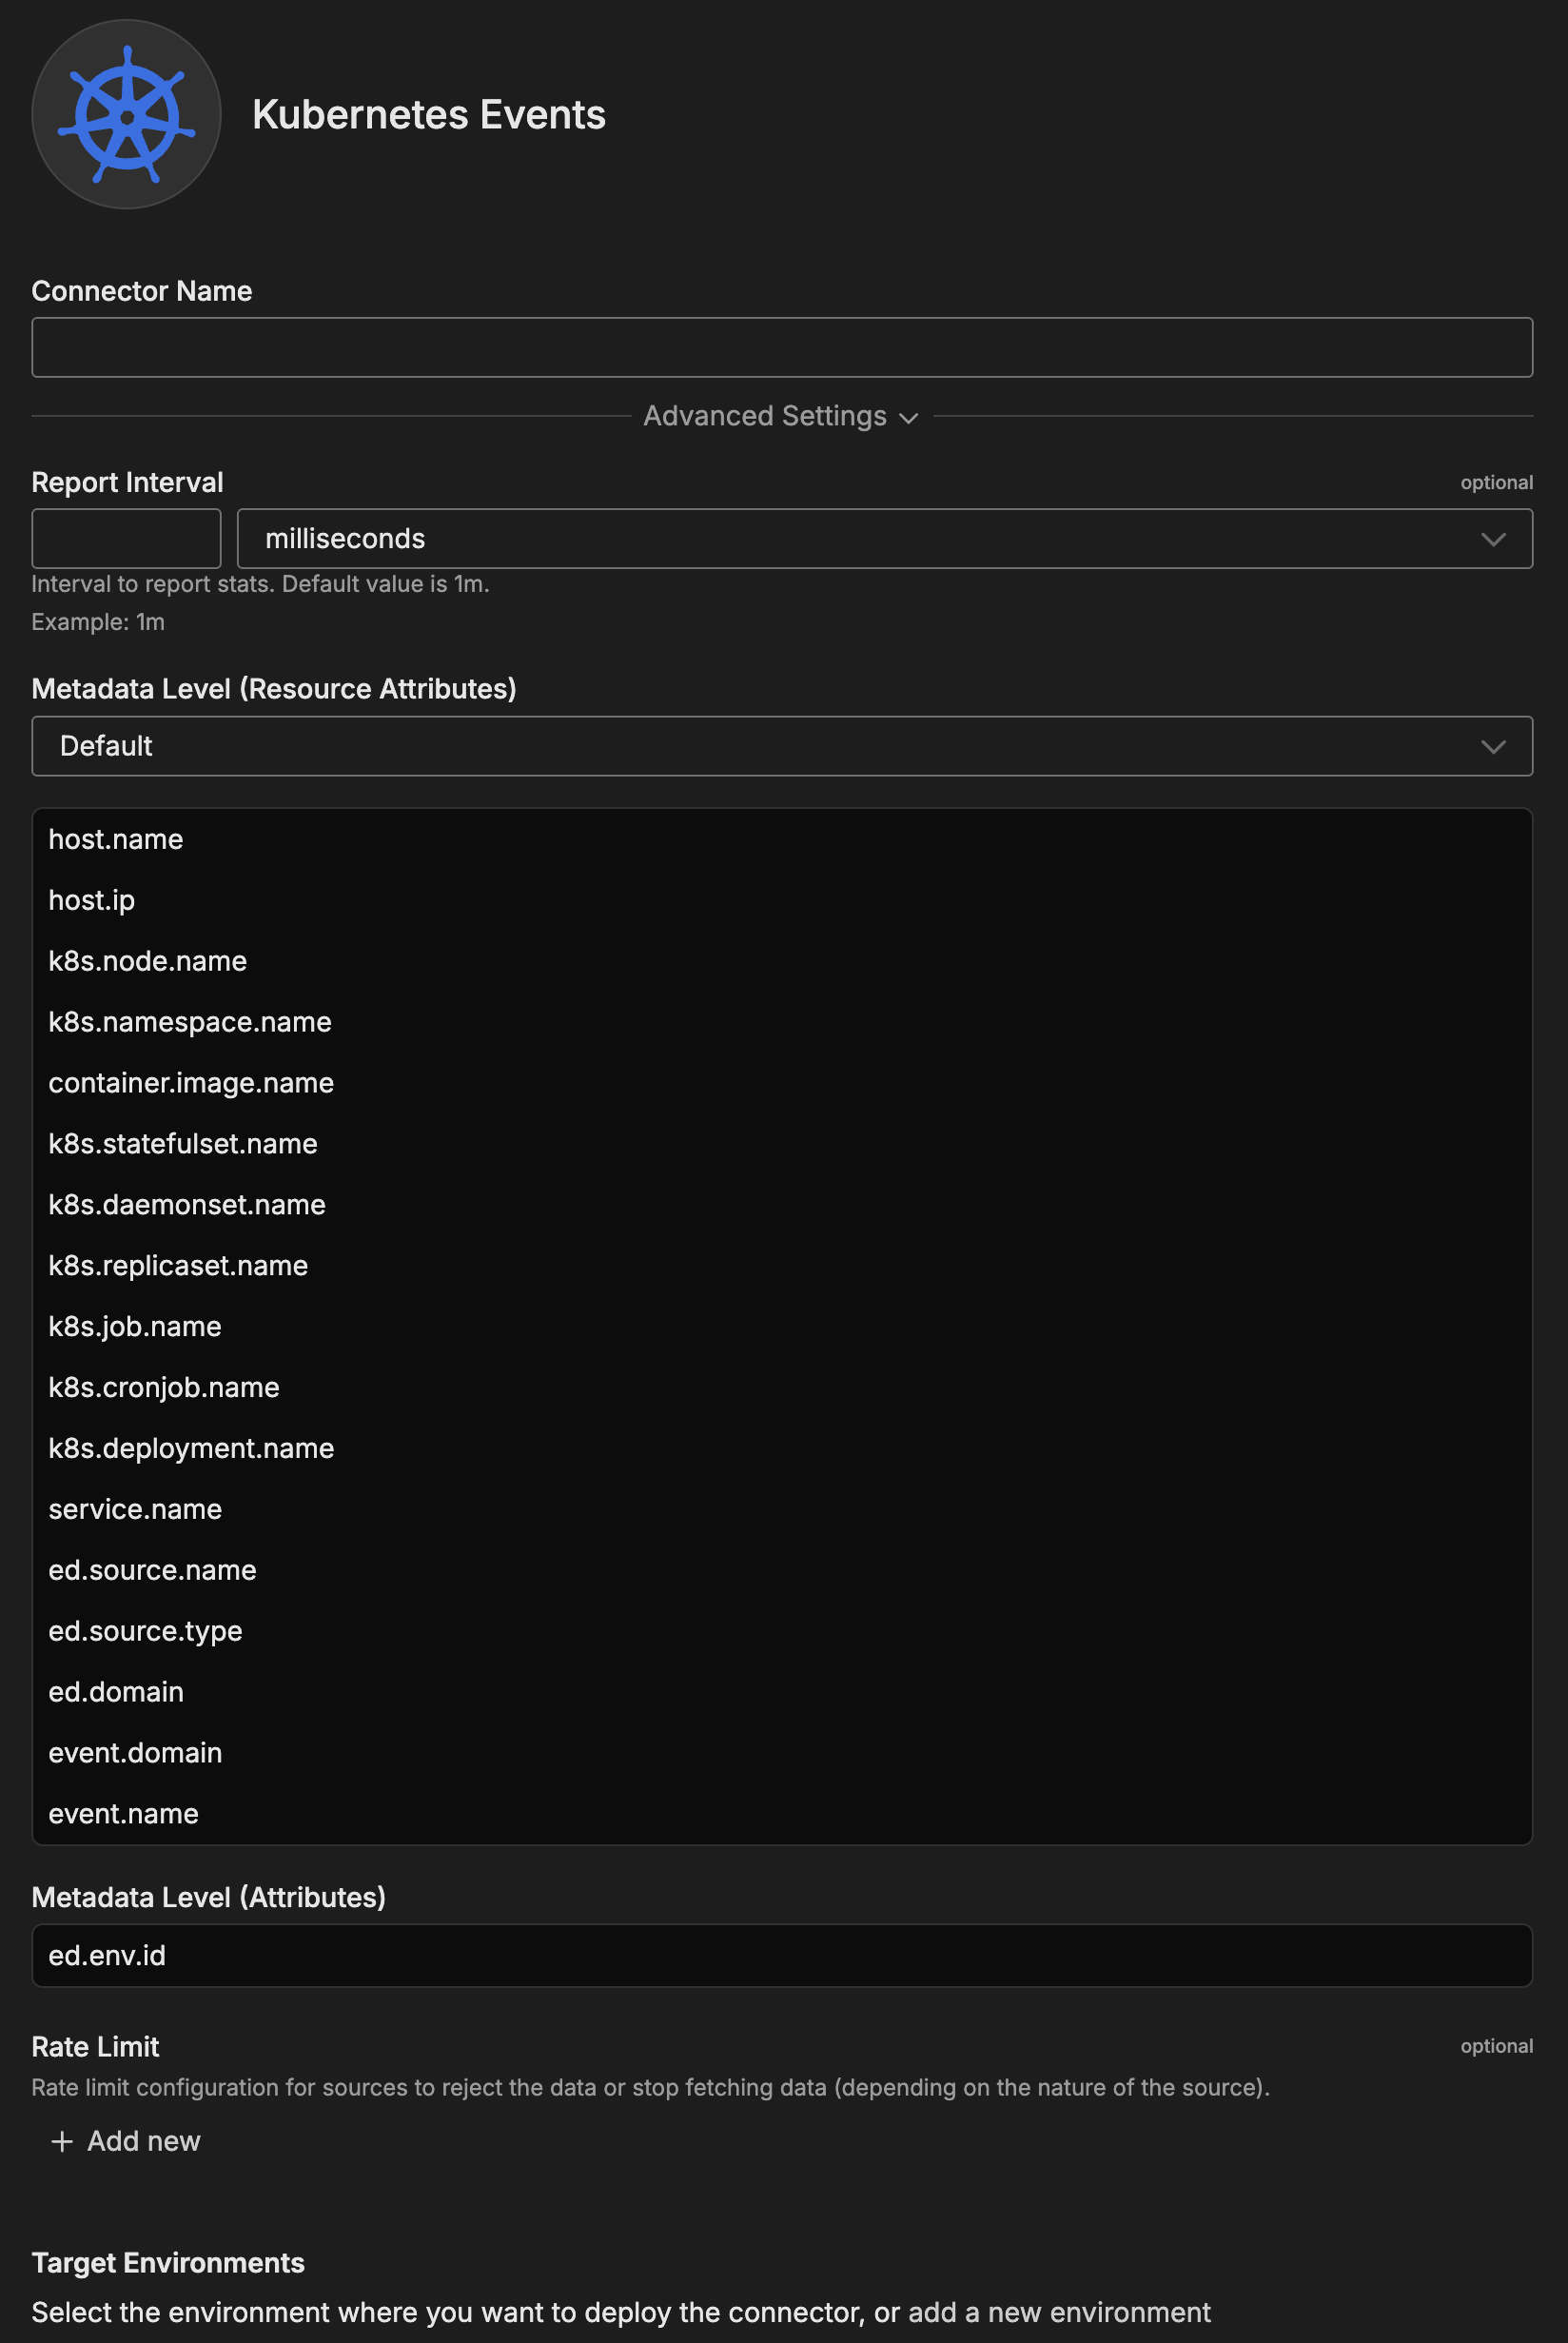
Connector Name
Name to identify this Kubernetes Events connector instance.
Advanced Settings
Report Interval
Interval to report stats. Controls how frequently event statistics and metrics are generated.
Format: Duration in milliseconds
Default: 1 minute (60000ms)
Examples:
60000- 1 minute (default)30000- 30 seconds (higher frequency)300000- 5 minutes (lower frequency)
Use Cases:
- Lower intervals: Real-time monitoring, critical clusters
- Higher intervals: Reduce overhead, less critical environments
Metadata Level
This option is used to define which detected resources and attributes to add to each data item as it is ingested by Edge Delta. You can select:
- Required Only: This option includes the minimum required resources and attributes for Edge Delta to operate.
- Default: This option includes the required resources and attributes plus those selected by Edge Delta
- High: This option includes the required resources and attributes along with a larger selection of common optional fields.
- Custom: With this option selected, you can choose which attributes and resources to include. The required fields are selected by default and can’t be unchecked.
Based on your selection in the GUI, the source_metadata YAML is populated as two dictionaries (resource_attributes and attributes) with Boolean values.
See Choose Data Item Metadata for more information on selecting metadata.
Kubernetes Events-specific metadata included:
k8s.node.name- Node name where event occurredk8s.namespace.name- Namespace of resourcecontainer.image.name- Container image namek8s.statefulset.name- StatefulSet name (if applicable)k8s.daemonset.name- DaemonSet name (if applicable)k8s.replicaset.name- ReplicaSet name (if applicable)k8s.job.name- Job name (if applicable)k8s.cronjob.name- CronJob name (if applicable)k8s.deployment.name- Deployment name (if applicable)ed.domain- Edge Delta domainevent.domain- Event domainevent.name- Event name
Kubernetes event fields automatically included:
- Event type (Normal, Warning)
- Event reason
- Event message
- Involved object (kind, name, namespace)
- Source component
- Timestamps (first and last occurrence)
- Event count
Rate Limit
The rate_limit parameter enables you to control data ingestion based on system resource usage. This advanced setting helps prevent source nodes from overwhelming the agent by automatically throttling or stopping data collection when CPU or memory thresholds are exceeded.
Use rate limiting to prevent runaway log collection from overwhelming the agent in high-volume sources, protect agent stability in resource-constrained environments with limited CPU/memory, automatically throttle during bursty traffic patterns, and ensure fair resource allocation across source nodes in multi-tenant deployments.
When rate limiting triggers, pull-based sources (File, S3, HTTP Pull) stop fetching new data, push-based sources (HTTP, TCP, UDP, OTLP) reject incoming data, and stream-based sources (Kafka, Pub/Sub) pause consumption. Rate limiting operates at the source node level, where each source with rate limiting enabled independently monitors and enforces its own thresholds.
Rate limiting vs backpressure: Rate limiting and backpressure are different mechanisms. Rate limiting controls data ingestion at the source based on CPU or memory thresholds. Backpressure controls data output at the destination when in-memory queues fill up. Backpressure logs such as
backpressure: dataCh at 92% capacitydo not appear when rate limiting triggers, and rate limiting logs do not appear during backpressure events.
Observability: When rate limiting is active in enforce mode, the agent does not produce INFO, WARN, or ERROR level logs. To confirm that rate limiting is triggering, check the source node’s Bytes I/O metrics in the Edge Delta app for gaps or drops that coincide with expected throttling periods.
Configuration Steps:
- Click Add New in the Rate Limit section
- Click Add New for Evaluation Policy
- Select Policy Type:
- CPU Usage: Monitors CPU consumption and rate limits when usage exceeds defined thresholds. Use for CPU-intensive sources like file parsing or complex transformations.
- Memory Usage: Monitors memory consumption and rate limits when usage exceeds defined thresholds. Use for memory-intensive sources like large message buffers or caching.
- AND (composite): Combines multiple sub-policies with AND logic. All sub-policies must be true simultaneously to trigger rate limiting. Use when you want conservative rate limiting (both CPU and memory must be high).
- OR (composite): Combines multiple sub-policies with OR logic. Any sub-policy can trigger rate limiting. Use when you want aggressive rate limiting (either CPU or memory being high triggers).
- Select Evaluation Mode. Choose how the policy behaves when thresholds are exceeded:
- Enforce (default): Actively applies rate limiting when thresholds are met. Pull-based sources (File, S3, HTTP Pull) stop fetching new data, push-based sources (HTTP, TCP, UDP, OTLP) reject incoming data, and stream-based sources (Kafka, Pub/Sub) pause consumption. Use in production to protect agent resources.
- Monitor: Logs when rate limiting would occur without actually limiting data flow. Use for testing thresholds before enforcing them in production.
- Passthrough: Disables rate limiting entirely while keeping the configuration in place. Use to temporarily disable rate limiting without removing configuration.
- Set Absolute Limits and Relative Limits (for CPU Usage and Memory Usage policies)
Note: If you specify both absolute and relative limits, the system evaluates both conditions and rate limiting triggers when either condition is met (OR logic). For example, if you set absolute limit to
1.0CPU cores and relative limit to50%, rate limiting triggers when the source uses either 1 full core OR 50% of available CPU, whichever happens first.
For CPU Absolute Limits: Enter value in full core units:
0.1= one-tenth of a CPU core0.5= half a CPU core1.0= one full CPU core2.0= two full CPU cores
For CPU Relative Limits: Enter percentage of total available CPU (0-100):
50= 50% of available CPU75= 75% of available CPU85= 85% of available CPU
For Memory Absolute Limits: Enter value in bytes
104857600= 100Mi (100 × 1024 × 1024)536870912= 512Mi (512 × 1024 × 1024)1073741824= 1Gi (1 × 1024 × 1024 × 1024)
For Memory Relative Limits: Enter percentage of total available memory (0-100)
60= 60% of available memory75= 75% of available memory80= 80% of available memory
- Set Refresh Interval (for CPU Usage and Memory Usage policies). Specify how frequently the system checks resource usage:
- Recommended Values:
10sto30sfor most use cases5sto10sfor high-volume sources requiring quick response1mor higher for stable, low-volume sources
The system fetches current CPU/memory usage at the specified refresh interval and uses that value for evaluation until the next refresh. Shorter intervals provide more responsive rate limiting but incur slightly higher overhead, while longer intervals are more efficient but slower to react to sudden resource spikes.
The GUI generates YAML as follows:
# Simple CPU-based rate limiting
nodes:
  - name: <node name>
    type: <node type>
    rate_limit:
      evaluation_policy:
        policy_type: cpu_usage
        evaluation_mode: enforce
        absolute_limit: 0.5  # Limit to half a CPU core
        refresh_interval: 10s
# Simple memory-based rate limiting
nodes:
  - name: <node name>
    type: <node type>
    rate_limit:
      evaluation_policy:
        policy_type: memory_usage
        evaluation_mode: enforce
        absolute_limit: 536870912  # 512Mi in bytes
        refresh_interval: 30s
Composite Policies (AND / OR)
When using AND or OR policy types, you define sub-policies instead of limits. Sub-policies must be siblings (at the same level)—do not nest sub-policies within other sub-policies. Each sub-policy is independently evaluated, and the parent policy’s evaluation mode applies to the composite result.
- AND Logic: All sub-policies must evaluate to true at the same time to trigger rate limiting. Use when you want conservative rate limiting (limit only when CPU AND memory are both high).
- OR Logic: Any sub-policy evaluating to true triggers rate limiting. Use when you want aggressive protection (limit when either CPU OR memory is high).
Configuration Steps:
- Select AND (composite) or OR (composite) as the Policy Type
- Choose the Evaluation Mode (typically Enforce)
- Click Add New under Sub-Policies to add the first condition
- Configure the first sub-policy by selecting policy type (CPU Usage or Memory Usage), selecting evaluation mode, setting absolute and/or relative limits, and setting refresh interval
- In the parent policy (not within the child), click Add New again to add a sibling sub-policy
- Configure additional sub-policies following the same pattern
The GUI generates YAML as follows:
# AND composite policy - both CPU AND memory must exceed limits
nodes:
  - name: <node name>
    type: <node type>
    rate_limit:
      evaluation_policy:
        policy_type: and
        evaluation_mode: enforce
        sub_policies:
          # First sub-policy (sibling)
          - policy_type: cpu_usage
            evaluation_mode: enforce
            absolute_limit: 0.75  # Limit to 75% of one core
            refresh_interval: 15s
          # Second sub-policy (sibling)
          - policy_type: memory_usage
            evaluation_mode: enforce
            absolute_limit: 1073741824  # 1Gi in bytes
            refresh_interval: 15s
# OR composite policy - either CPU OR memory can trigger
nodes:
  - name: <node name>
    type: <node type>
    rate_limit:
      evaluation_policy:
        policy_type: or
        evaluation_mode: enforce
        sub_policies:
          - policy_type: cpu_usage
            evaluation_mode: enforce
            relative_limit: 85  # 85% of available CPU
            refresh_interval: 20s
          - policy_type: memory_usage
            evaluation_mode: enforce
            relative_limit: 80  # 80% of available memory
            refresh_interval: 20s
# Monitor mode for testing thresholds
nodes:
  - name: <node name>
    type: <node type>
    rate_limit:
      evaluation_policy:
        policy_type: memory_usage
        evaluation_mode: monitor  # Only logs, doesn't limit
        relative_limit: 70  # Test at 70% before enforcing
        refresh_interval: 30s
Target Environments
Select the Edge Delta pipeline (environment) where you want to deploy this connector. Must be a Kubernetes environment - the connector requires in-cluster API access.
How to Use the Kubernetes Events Connector
The Kubernetes Events connector integrates seamlessly with AI Team, enabling AI-powered analysis of cluster operations. AI teammates automatically leverage event data to troubleshoot pod failures, analyze deployments, and investigate resource issues.
Use Case: Diagnosing Pod CrashLoopBackOff Issues
Identify why pods repeatedly crash by analyzing Kubernetes events capturing failure conditions. AI teammates use event data to reveal root causes (image pull failures, configuration errors, resource limits) and provide targeted remediation steps. When combined with PagerDuty alerts, teammates automatically query recent pod events during incident investigation to identify which pods are failing and why.
Configuration: Deploy to production Kubernetes environment with metadata enabled to capture pod lifecycle events.
Use Case: Detecting Node Resource Pressure
Proactively identify infrastructure problems through node resource pressure events (memory, disk, CPU). AI teammates detect patterns indicating capacity issues before they cause pod evictions. This is valuable for platform teams—teammates can correlate pressure events with pod scheduling failures and recommend capacity adjustments.
Configuration: Deploy to cluster monitoring environment to capture cluster-wide infrastructure health signals.
Use Case: Analyzing Deployment Scaling Operations
Understand application scaling behavior through deployment and replica set events. AI teammates analyze scaling patterns, identify capacity constraints, and troubleshoot failed scale operations. When integrated with Jira, teammates automatically document scaling issues by querying deployment events and creating tickets with diagnostic details.
Configuration: Deploy to deployment monitoring environment with event metadata to track scaling operations across workloads.
Troubleshooting
No events appearing: Verify RBAC permissions with kubectl auth can-i list events --as=system:serviceaccount:edgedelta:edgedelta. Confirm service account exists (kubectl get sa edgedelta -n edgedelta). Check ClusterRoleBinding (kubectl get clusterrolebinding | grep edgedelta). Review agent logs for permission errors.
Permission denied errors: Verify ClusterRole includes events resource with get, list, watch verbs (kubectl describe clusterrole edgedelta-events-reader). Check ClusterRoleBinding references correct service account. Confirm service account mounted in pod (kubectl get pod <pod-name> -n edgedelta -o yaml).
Missing metadata fields: Verify metadata level configuration includes Kubernetes fields. Check event structure in your API version (kubectl get events -o yaml | head -50). Ensure Edge Delta agent version supports full event metadata. Review processor configuration for metadata filtering.
High event volume: Apply namespace filtering for critical namespaces only. Filter by event type (Warning, Error) to exclude routine Normal events. Use resource type filtering (Pod, Node) for specific monitoring goals. Implement deduplication in processors. Configure rate limits to prevent event storms.
API server impact concerns: Kubernetes watch API is efficient with minimal impact. Monitor API server metrics during deployment. Consider namespace-specific filtering to distribute load. Recommended agent resources: 256Mi-512Mi memory, 100m-500m CPU.
Events from some namespaces only: Check namespace filter configuration for typos (case-sensitive). Verify namespaces exist (kubectl get namespaces). Confirm RBAC uses ClusterRole not namespace-specific Role. For cluster-wide monitoring, use ClusterRole and ClusterRoleBinding.
Next Steps
- Learn about Kubernetes event source node for advanced configuration
- Learn about creating custom teammates that can use Kubernetes events
For additional help, visit AI Team Support.