Kubernetes Logs Connector
Configure the Kubernetes Logs connector to collect container logs from Kubernetes pods for AI-powered analysis of application behavior and cluster operations.
13 minute read
Overview
Note: This connector is also included when you create the bundled Kubernetes connector, which provisions Logs, Metrics, Traces, Service Map, and Events sources together.
The Kubernetes Logs connector collects container logs from Kubernetes pods. Kubernetes generates logs from every container, capturing application output, errors, and operational events essential for troubleshooting distributed applications. Content streams into Edge Delta Pipelines for analysis by AI teammates through the Edge Delta MCP connector.
The connector provides flexible filtering based on namespaces, pod names, and container names. It automatically enriches logs with Kubernetes metadata (deployments, nodes, resource attributes) and supports both plain text and JSON log parsing.
When you add this streaming connector, it appears as a Kubernetes Logs source in your selected pipeline. AI teammates access this data by querying the Edge Delta backend with the Edge Delta MCP connector.
Platform: Kubernetes only (requires in-cluster deployment)
Add the Kubernetes Logs Connector
To add the Kubernetes Logs connector, you configure include/exclude filters to specify which pods and namespaces to monitor.
Prerequisites
Before configuring the connector, ensure you have:
- Edge Delta agent deployed to Kubernetes cluster as DaemonSet with log read permissions
- RBAC permissions to read pod logs from target namespaces
- Identified namespaces, pods, or containers to monitor
Configuration Steps
- Navigate to AI Team > Connectors in the Edge Delta application
- Find the Kubernetes Logs connector in Streaming Connectors
- Click the connector card
- Configure Kubernetes Include with resource filters
- Optionally add Kubernetes Exclude to filter out specific resources
- Optionally configure Advanced Settings for metadata, parsing, or rate limiting
- Select a target environment (Kubernetes deployment)
- Click Save
The connector deploys to agents and begins collecting logs from matching pods.
Configuration Options
Connector Name
Name to identify this Kubernetes Logs connector instance.
Kubernetes Include
Kubernetes namespace, pod, or container name that agents should monitor. Wildcards supported.
Format: k8s.<attribute>=<regex_pattern>
Examples:
k8s.namespace.name=.*- All pods in all namespacesk8s.namespace.name=production- Production namespace onlyk8s.pod.name=^api-.*$- Pods starting with “api-”k8s.namespace.name=staging,k8s.container.name=app- “app” container in staging namespace
Available Attributes:
k8s.namespace.name- Namespace namek8s.pod.name- Pod namek8s.container.name- Container namek8s.deployment.name- Deployment namek8s.statefulset.name- StatefulSet namek8s.daemonset.name- DaemonSet name
Kubernetes Exclude
Kubernetes namespace, pod, or container name to exclude from monitoring. Use to exclude specific resources from include filter.
Format: Same as Kubernetes Include - k8s.<attribute>=<regex_pattern>
Examples:
k8s.namespace.name=^kube-system$- Exclude kube-system namespacek8s.pod.name=.*test.*- Exclude pods with “test” in namek8s.container.name=sidecar- Exclude sidecar containers
Common Patterns:
- Exclude system namespaces:
k8s.namespace.name=^kube-.*$ - Exclude test pods:
k8s.pod.name=.*-test$ - Exclude monitoring sidecars:
k8s.container.name=(prometheus|fluentd)
Advanced Settings
Resource Fields
Metadata fields to include additionally for given input. Custom labels and annotations to enrich logs.
Examples:
app.version- Application versionteam.name- Team ownershipcost.center- Cost allocation
Pod Labels
List of regexes for selecting pod label keys to include.
Format: Regex patterns matching label keys
Examples:
app.*- All labels starting with “app”version- Version label only(team|owner|environment)- Specific labels
Pod Annotations
List of regexes for selecting pod annotation keys to include.
Format: Regex patterns matching annotation keys
Examples:
prometheus.io/.*- Prometheus annotationsdeployment.*- Deployment-related annotations
Node Labels
List of regexes for selecting node label keys to include.
Format: Regex patterns matching node label keys
Examples:
node-role.kubernetes.io/.*- Node role labelstopology.kubernetes.io/zone- Availability zone
Namespace Labels
List of regexes for selecting namespace label keys to include.
Format: Regex patterns matching namespace label keys
Examples:
environment- Environment labelproject.*- Project-related labels
Discovery
Override logic for file discovery while looking for files of Kubernetes pods in mounted filesystem. Useful for retaining Kubernetes metadata with context.
Format: File path patterns
Default: Edge Delta auto-discovery
Use Cases:
- Custom log paths
- Non-standard container runtimes
- Specialized file locations
Log Parsing Mode
Log parsing mode to use for input. Basic will not parse log as JSON, Full will parse log as JSON if valid.
Values: Basic, Full
Default: Basic
When to Use:
- Basic: Plain text logs, simple formats
- Full: JSON-formatted application logs, structured logging
Example: Set to Full for logs like {"level":"error","message":"connection failed"}
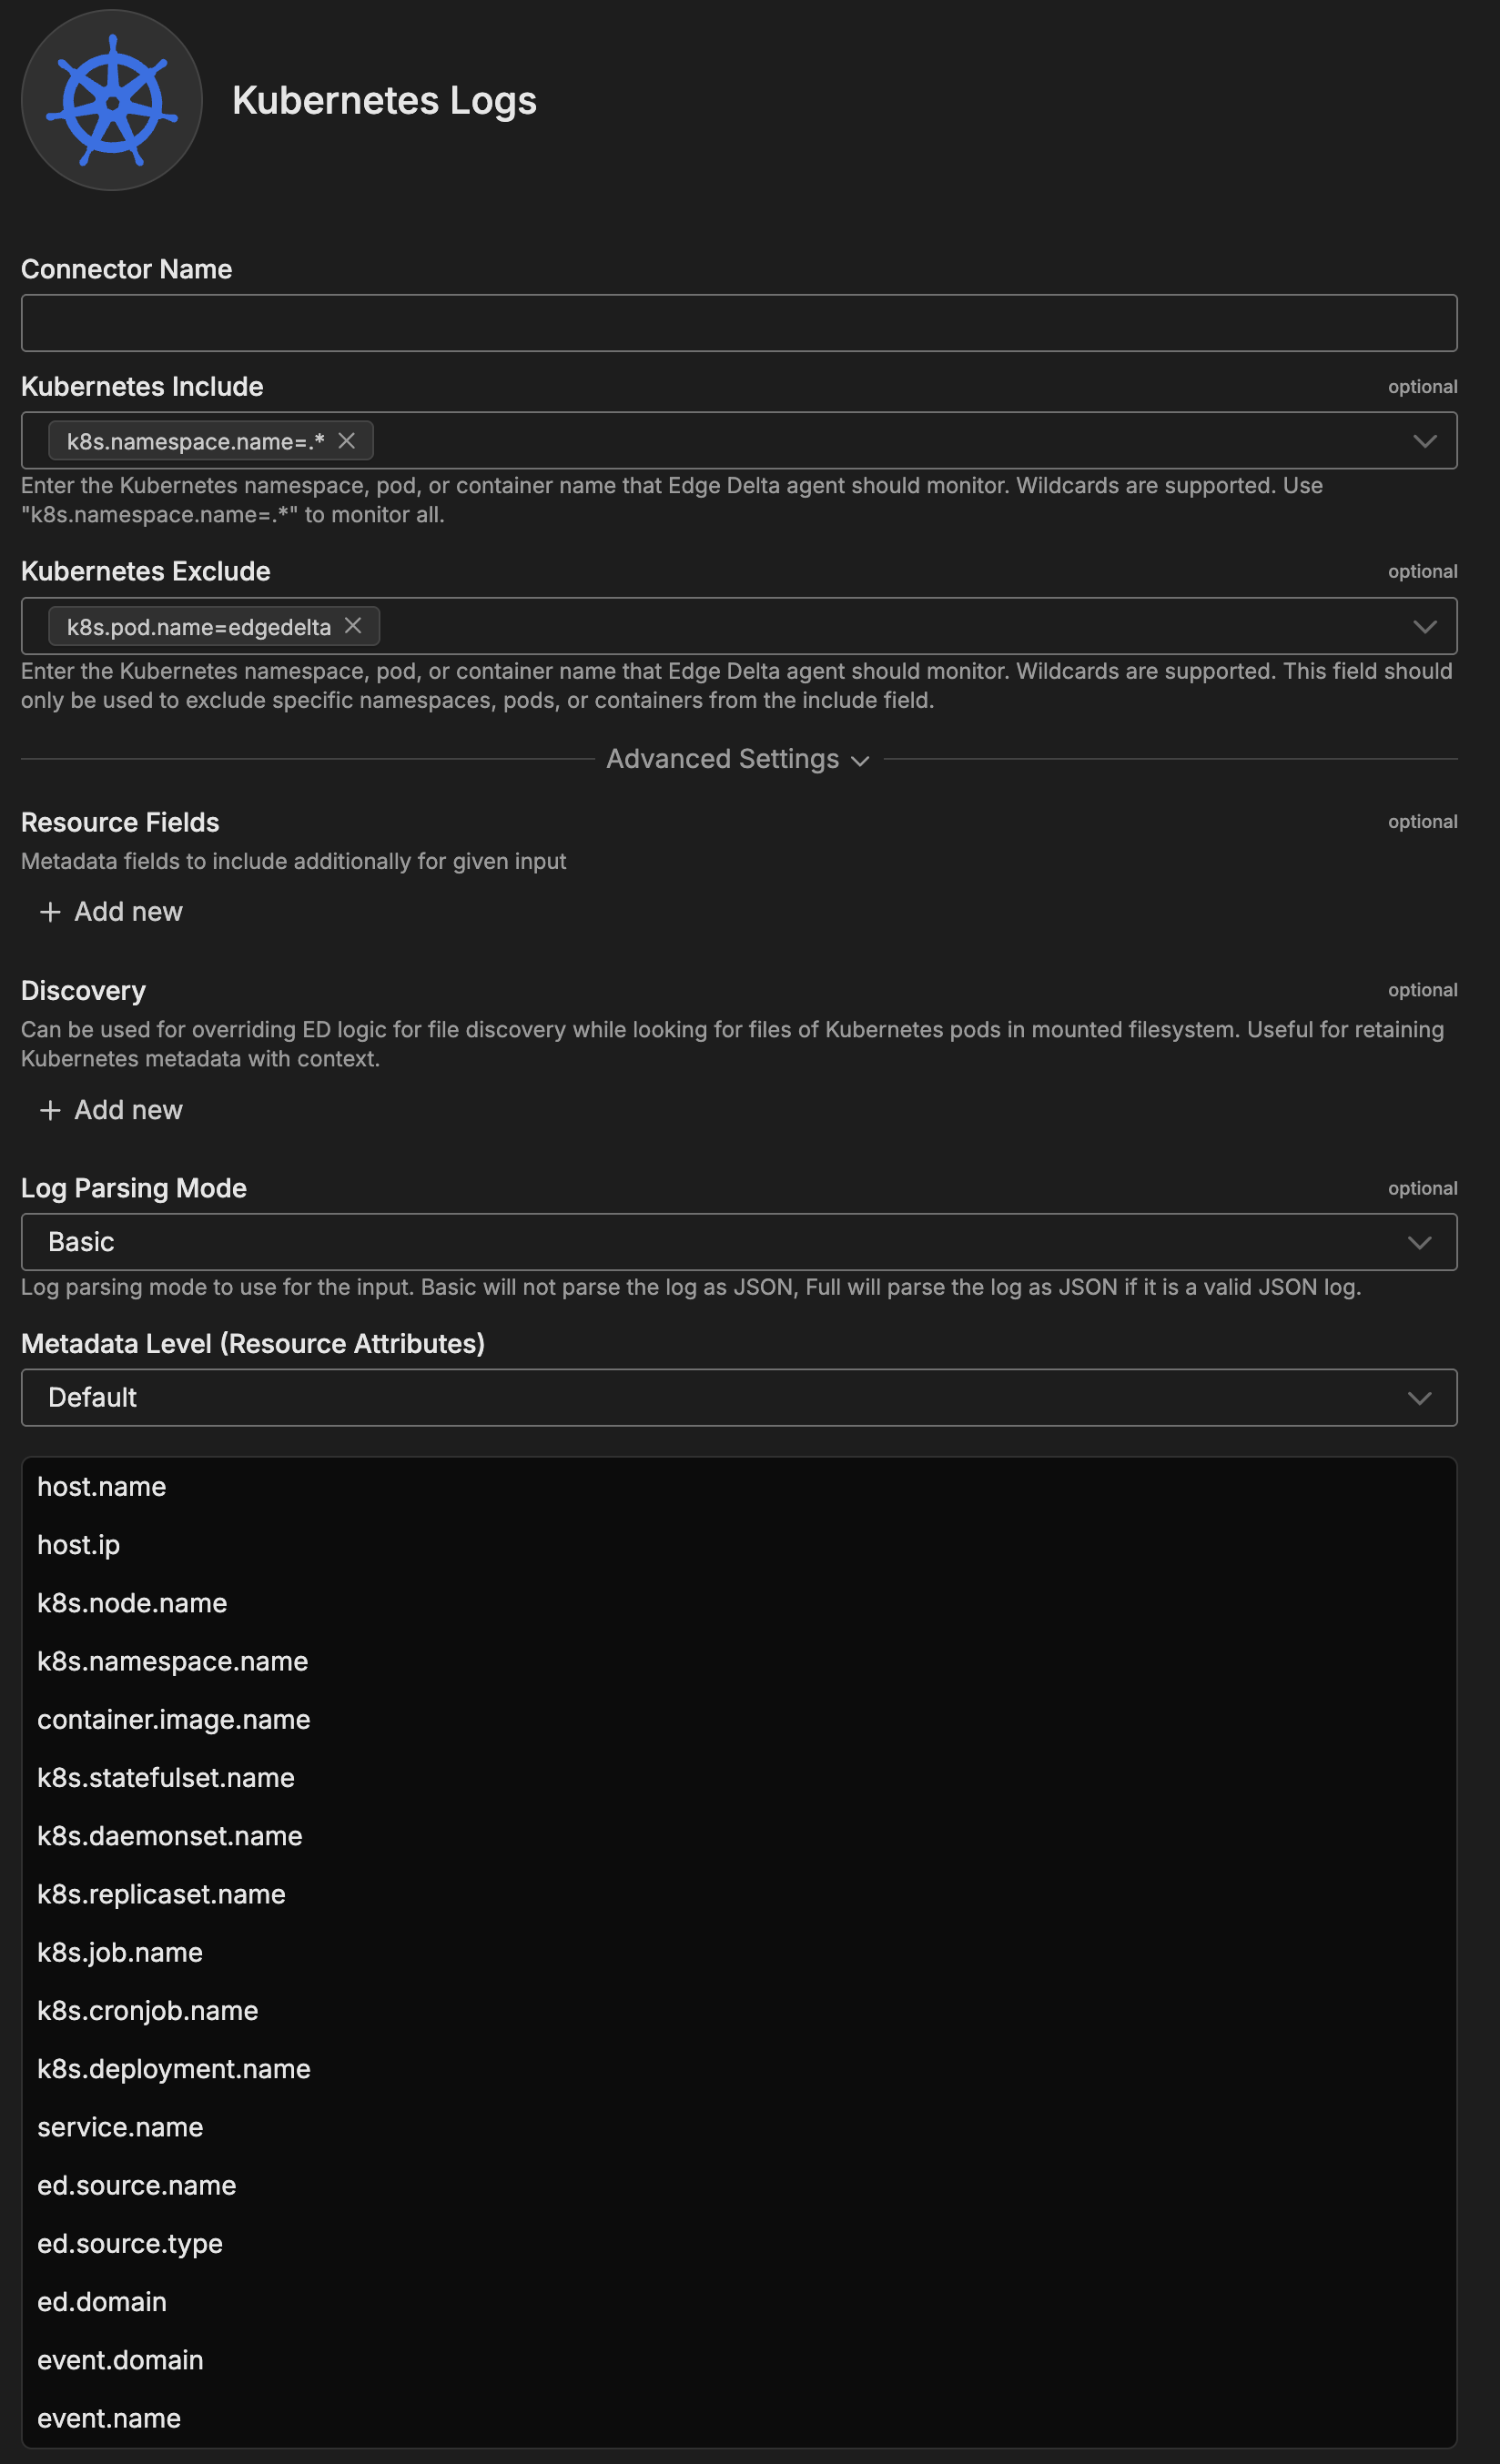
Metadata Level
This option is used to define which detected resources and attributes to add to each data item as it is ingested by Edge Delta. You can select:
- Required Only: This option includes the minimum required resources and attributes for Edge Delta to operate.
- Default: This option includes the required resources and attributes plus those selected by Edge Delta
- High: This option includes the required resources and attributes along with a larger selection of common optional fields.
- Custom: With this option selected, you can choose which attributes and resources to include. The required fields are selected by default and can’t be unchecked.
Based on your selection in the GUI, the source_metadata YAML is populated as two dictionaries (resource_attributes and attributes) with Boolean values.
See Choose Data Item Metadata for more information on selecting metadata.
Kubernetes Logs-specific metadata included:
k8s.node.name- Node where pod runsk8s.namespace.name- Pod namespacecontainer.image.name- Container imagek8s.statefulset.name- StatefulSet (if applicable)k8s.daemonset.name- DaemonSet (if applicable)k8s.replicaset.name- ReplicaSet (if applicable)k8s.job.name- Job (if applicable)k8s.cronjob.name- CronJob (if applicable)k8s.deployment.name- Deployment (if applicable)ed.domain- Edge Delta domainevent.domain- Event domainevent.name- Event name
Rate Limit
The rate_limit parameter enables you to control data ingestion based on system resource usage. This advanced setting helps prevent source nodes from overwhelming the agent by automatically throttling or stopping data collection when CPU or memory thresholds are exceeded.
Use rate limiting to prevent runaway log collection from overwhelming the agent in high-volume sources, protect agent stability in resource-constrained environments with limited CPU/memory, automatically throttle during bursty traffic patterns, and ensure fair resource allocation across source nodes in multi-tenant deployments.
When rate limiting triggers, pull-based sources (File, S3, HTTP Pull) stop fetching new data, push-based sources (HTTP, TCP, UDP, OTLP) reject incoming data, and stream-based sources (Kafka, Pub/Sub) pause consumption. Rate limiting operates at the source node level, where each source with rate limiting enabled independently monitors and enforces its own thresholds.
Rate limiting vs backpressure: Rate limiting and backpressure are different mechanisms. Rate limiting controls data ingestion at the source based on CPU or memory thresholds. Backpressure controls data output at the destination when in-memory queues fill up. Backpressure logs such as
backpressure: dataCh at 92% capacitydo not appear when rate limiting triggers, and rate limiting logs do not appear during backpressure events.
Observability: When rate limiting is active in enforce mode, the agent does not produce INFO, WARN, or ERROR level logs. To confirm that rate limiting is triggering, check the source node’s Bytes I/O metrics in the Edge Delta app for gaps or drops that coincide with expected throttling periods.
Configuration Steps:
- Click Add New in the Rate Limit section
- Click Add New for Evaluation Policy
- Select Policy Type:
- CPU Usage: Monitors CPU consumption and rate limits when usage exceeds defined thresholds. Use for CPU-intensive sources like file parsing or complex transformations.
- Memory Usage: Monitors memory consumption and rate limits when usage exceeds defined thresholds. Use for memory-intensive sources like large message buffers or caching.
- AND (composite): Combines multiple sub-policies with AND logic. All sub-policies must be true simultaneously to trigger rate limiting. Use when you want conservative rate limiting (both CPU and memory must be high).
- OR (composite): Combines multiple sub-policies with OR logic. Any sub-policy can trigger rate limiting. Use when you want aggressive rate limiting (either CPU or memory being high triggers).
- Select Evaluation Mode. Choose how the policy behaves when thresholds are exceeded:
- Enforce (default): Actively applies rate limiting when thresholds are met. Pull-based sources (File, S3, HTTP Pull) stop fetching new data, push-based sources (HTTP, TCP, UDP, OTLP) reject incoming data, and stream-based sources (Kafka, Pub/Sub) pause consumption. Use in production to protect agent resources.
- Monitor: Logs when rate limiting would occur without actually limiting data flow. Use for testing thresholds before enforcing them in production.
- Passthrough: Disables rate limiting entirely while keeping the configuration in place. Use to temporarily disable rate limiting without removing configuration.
- Set Absolute Limits and Relative Limits (for CPU Usage and Memory Usage policies)
Note: If you specify both absolute and relative limits, the system evaluates both conditions and rate limiting triggers when either condition is met (OR logic). For example, if you set absolute limit to
1.0CPU cores and relative limit to50%, rate limiting triggers when the source uses either 1 full core OR 50% of available CPU, whichever happens first.
For CPU Absolute Limits: Enter value in full core units:
0.1= one-tenth of a CPU core0.5= half a CPU core1.0= one full CPU core2.0= two full CPU cores
For CPU Relative Limits: Enter percentage of total available CPU (0-100):
50= 50% of available CPU75= 75% of available CPU85= 85% of available CPU
For Memory Absolute Limits: Enter value in bytes
104857600= 100Mi (100 × 1024 × 1024)536870912= 512Mi (512 × 1024 × 1024)1073741824= 1Gi (1 × 1024 × 1024 × 1024)
For Memory Relative Limits: Enter percentage of total available memory (0-100)
60= 60% of available memory75= 75% of available memory80= 80% of available memory
- Set Refresh Interval (for CPU Usage and Memory Usage policies). Specify how frequently the system checks resource usage:
- Recommended Values:
10sto30sfor most use cases5sto10sfor high-volume sources requiring quick response1mor higher for stable, low-volume sources
The system fetches current CPU/memory usage at the specified refresh interval and uses that value for evaluation until the next refresh. Shorter intervals provide more responsive rate limiting but incur slightly higher overhead, while longer intervals are more efficient but slower to react to sudden resource spikes.
The GUI generates YAML as follows:
# Simple CPU-based rate limiting
nodes:
  - name: <node name>
    type: <node type>
    rate_limit:
      evaluation_policy:
        policy_type: cpu_usage
        evaluation_mode: enforce
        absolute_limit: 0.5  # Limit to half a CPU core
        refresh_interval: 10s
# Simple memory-based rate limiting
nodes:
  - name: <node name>
    type: <node type>
    rate_limit:
      evaluation_policy:
        policy_type: memory_usage
        evaluation_mode: enforce
        absolute_limit: 536870912  # 512Mi in bytes
        refresh_interval: 30s
Composite Policies (AND / OR)
When using AND or OR policy types, you define sub-policies instead of limits. Sub-policies must be siblings (at the same level)—do not nest sub-policies within other sub-policies. Each sub-policy is independently evaluated, and the parent policy’s evaluation mode applies to the composite result.
- AND Logic: All sub-policies must evaluate to true at the same time to trigger rate limiting. Use when you want conservative rate limiting (limit only when CPU AND memory are both high).
- OR Logic: Any sub-policy evaluating to true triggers rate limiting. Use when you want aggressive protection (limit when either CPU OR memory is high).
Configuration Steps:
- Select AND (composite) or OR (composite) as the Policy Type
- Choose the Evaluation Mode (typically Enforce)
- Click Add New under Sub-Policies to add the first condition
- Configure the first sub-policy by selecting policy type (CPU Usage or Memory Usage), selecting evaluation mode, setting absolute and/or relative limits, and setting refresh interval
- In the parent policy (not within the child), click Add New again to add a sibling sub-policy
- Configure additional sub-policies following the same pattern
The GUI generates YAML as follows:
# AND composite policy - both CPU AND memory must exceed limits
nodes:
  - name: <node name>
    type: <node type>
    rate_limit:
      evaluation_policy:
        policy_type: and
        evaluation_mode: enforce
        sub_policies:
          # First sub-policy (sibling)
          - policy_type: cpu_usage
            evaluation_mode: enforce
            absolute_limit: 0.75  # Limit to 75% of one core
            refresh_interval: 15s
          # Second sub-policy (sibling)
          - policy_type: memory_usage
            evaluation_mode: enforce
            absolute_limit: 1073741824  # 1Gi in bytes
            refresh_interval: 15s
# OR composite policy - either CPU OR memory can trigger
nodes:
  - name: <node name>
    type: <node type>
    rate_limit:
      evaluation_policy:
        policy_type: or
        evaluation_mode: enforce
        sub_policies:
          - policy_type: cpu_usage
            evaluation_mode: enforce
            relative_limit: 85  # 85% of available CPU
            refresh_interval: 20s
          - policy_type: memory_usage
            evaluation_mode: enforce
            relative_limit: 80  # 80% of available memory
            refresh_interval: 20s
# Monitor mode for testing thresholds
nodes:
  - name: <node name>
    type: <node type>
    rate_limit:
      evaluation_policy:
        policy_type: memory_usage
        evaluation_mode: monitor  # Only logs, doesn't limit
        relative_limit: 70  # Test at 70% before enforcing
        refresh_interval: 30s
Target Environments
Select the Edge Delta pipeline (environment) where you want to deploy this connector. Must be a Kubernetes environment - the connector requires in-cluster deployment.
How to Use the Kubernetes Logs Connector
The Kubernetes Logs connector integrates seamlessly with AI Team, enabling AI-powered analysis of container logs. AI teammates automatically leverage logs to troubleshoot application errors, monitor deployment health, and investigate pod crashes.
Use Case: Monitoring Production Error Patterns
Analyze application errors across production services by collecting logs from production namespace. AI teammates identify error patterns, determine which services generate most errors, and provide context about issues. When combined with PagerDuty alerts, teammates automatically investigate error spikes by querying recent production logs and identifying root causes.
Configuration: Include: k8s.namespace.name=production, Exclude: k8s.pod.name=.*test.*, Log Parsing Mode: Full
Use Case: Tracking Deployment Health
Verify deployment rollouts by analyzing container startup logs and identifying crash loops. AI teammates monitor logs from specific deployments, check for startup errors, and validate health checks pass. This is valuable when deploying new versions—teammates can confirm pods start successfully and catch issues before they impact users.
Configuration: Include: k8s.namespace.name=staging,k8s.deployment.name=api-v2, Log Parsing Mode: Full
Use Case: Investigating Pod Crashes
Identify why pods crash by retrieving logs up to termination point. AI teammates analyze stacktraces, identify specific errors causing crashes, and recommend remediation based on failure patterns. When integrated with Jira, teammates automatically document crash causes by querying pod logs and creating tickets with diagnostic details.
Configuration: Include: k8s.namespace.name=.*, Log Parsing Mode: Full for comprehensive crash analysis
Pattern Syntax Reference
When creating include and exclude filters, use regex patterns to match Kubernetes resources:
Basic Patterns:
.- Any single character.*- Zero or more of any character (wildcard)^- Start of string$- End of string[abc]- Any of a, b, or c[^abc]- NOT a, b, or c
Common Examples:
k8s.namespace.name=.*with excludek8s.namespace.name=^kube-system$- All namespaces except kube-systemk8s.pod.name=^(api|auth|worker).*$- Pods starting with api, auth, or workerk8s.namespace.name=^(production|staging).*$- Production and staging namespaces only
Troubleshooting
No logs appearing: Verify Edge Delta DaemonSet running (kubectl get ds edgedelta -n edgedelta). Check include filter matches intended pods. Confirm RBAC permissions for log access. Verify correct target environment selected.
Too many logs: Add exclude filters for noisy namespaces (k8s.namespace.name=^kube-.*$). Make include patterns more specific. Configure rate limiting. Deploy separate connectors for different use cases.
Missing Kubernetes metadata: Ensure agent service account has permissions to read pods, deployments, services. Verify pods have standard Kubernetes labels. Check metadata level configuration includes required attributes.
JSON logs as plain text: Change Log Parsing Mode to Full. Verify application produces valid JSON. Check for BOM or encoding issues preventing JSON detection.
Agent not discovering pods: Use DaemonSet deployment for full cluster coverage. Test regex patterns against actual pod names. Verify target pods in Running state.
Delayed or missing logs: Check rate limiting not throttling collection. Monitor agent resource usage (CPU, memory). Verify network connectivity to Edge Delta backend.
Sensitive data collected: Add exclude filters for namespaces with secrets/PII. Configure data redaction processors in pipeline. For multi-tenant clusters, create separate connectors per tenant.
Next Steps
- Learn about Kubernetes source node for advanced configuration
- Learn about creating custom teammates that can use Kubernetes logs
For additional help, visit AI Team Support.