Metric Anomaly Monitor
5 minute read
Overview
The Metric Anomaly Monitor detects when a metric deviates significantly from its own recent history. Instead of comparing the current value against a fixed threshold, the monitor continuously builds a rolling baseline from the last N evaluated datapoints and raises an alert when the current value falls outside a configurable number of standard deviations from that mean.
This makes the Metric Anomaly Monitor well suited for metrics with natural variation or gradual drift where a static threshold would either miss real anomalies or generate excessive noise.
Create a Metric Anomaly Monitor
To create a Metric Anomaly monitor:
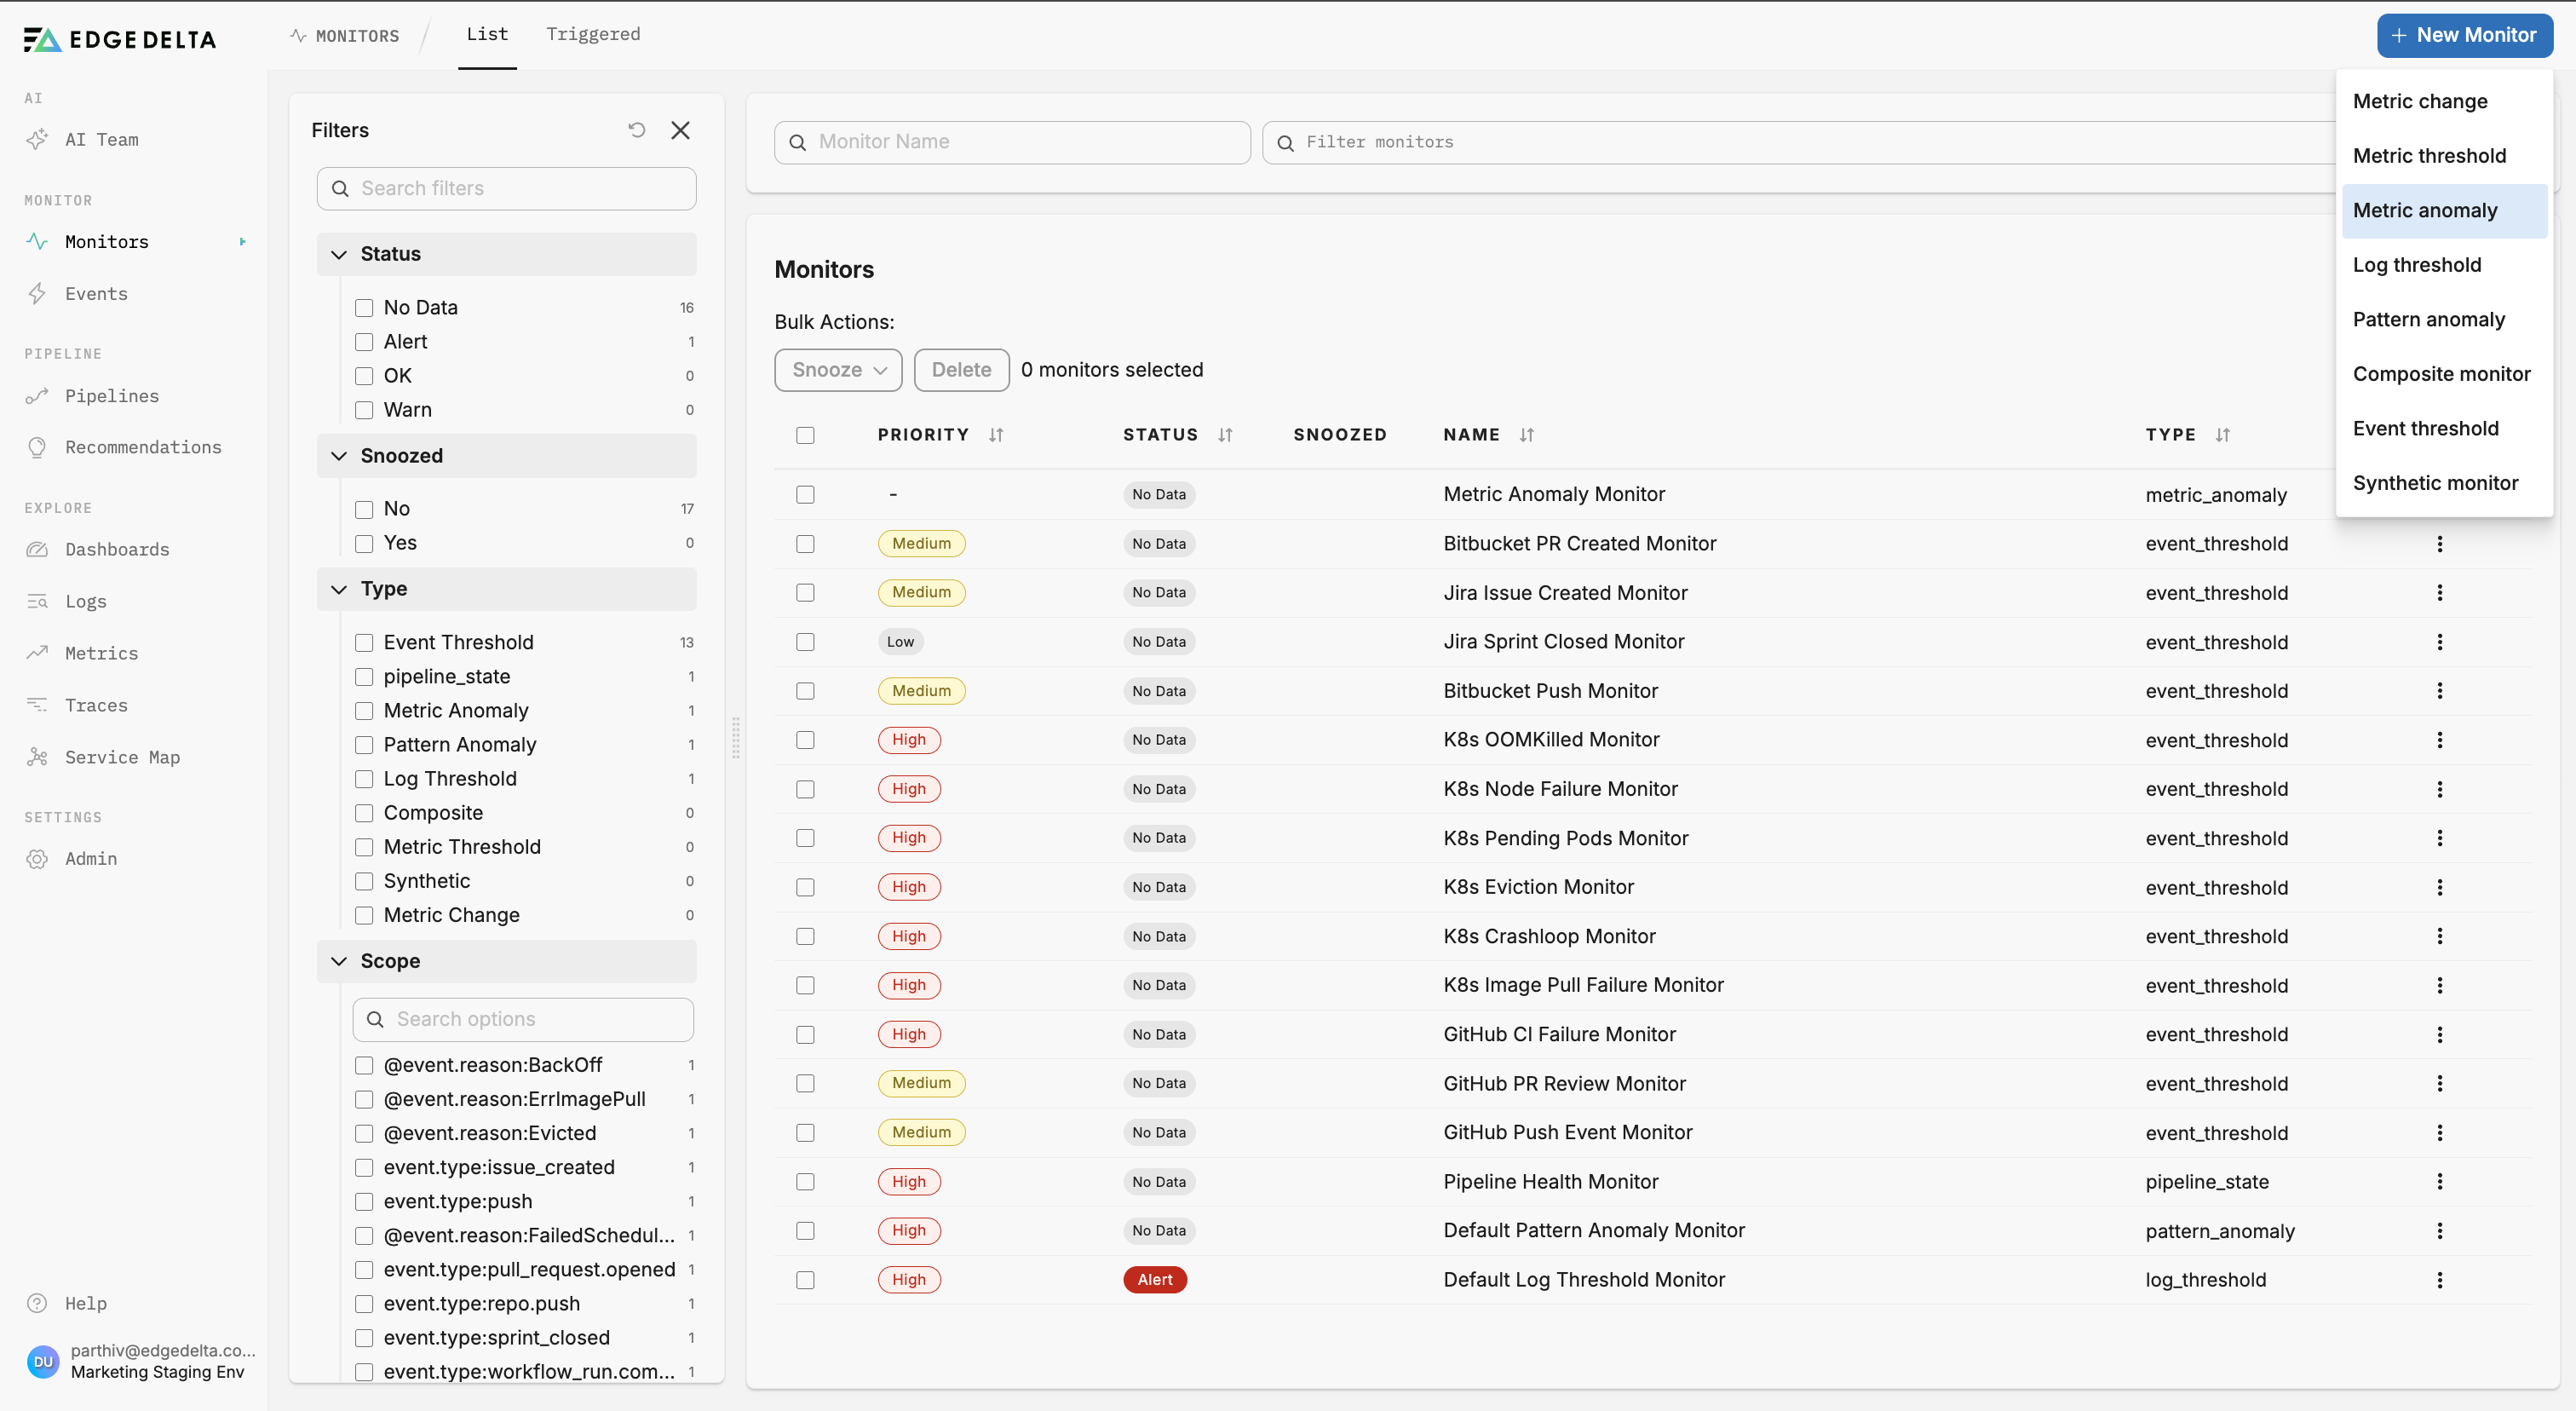
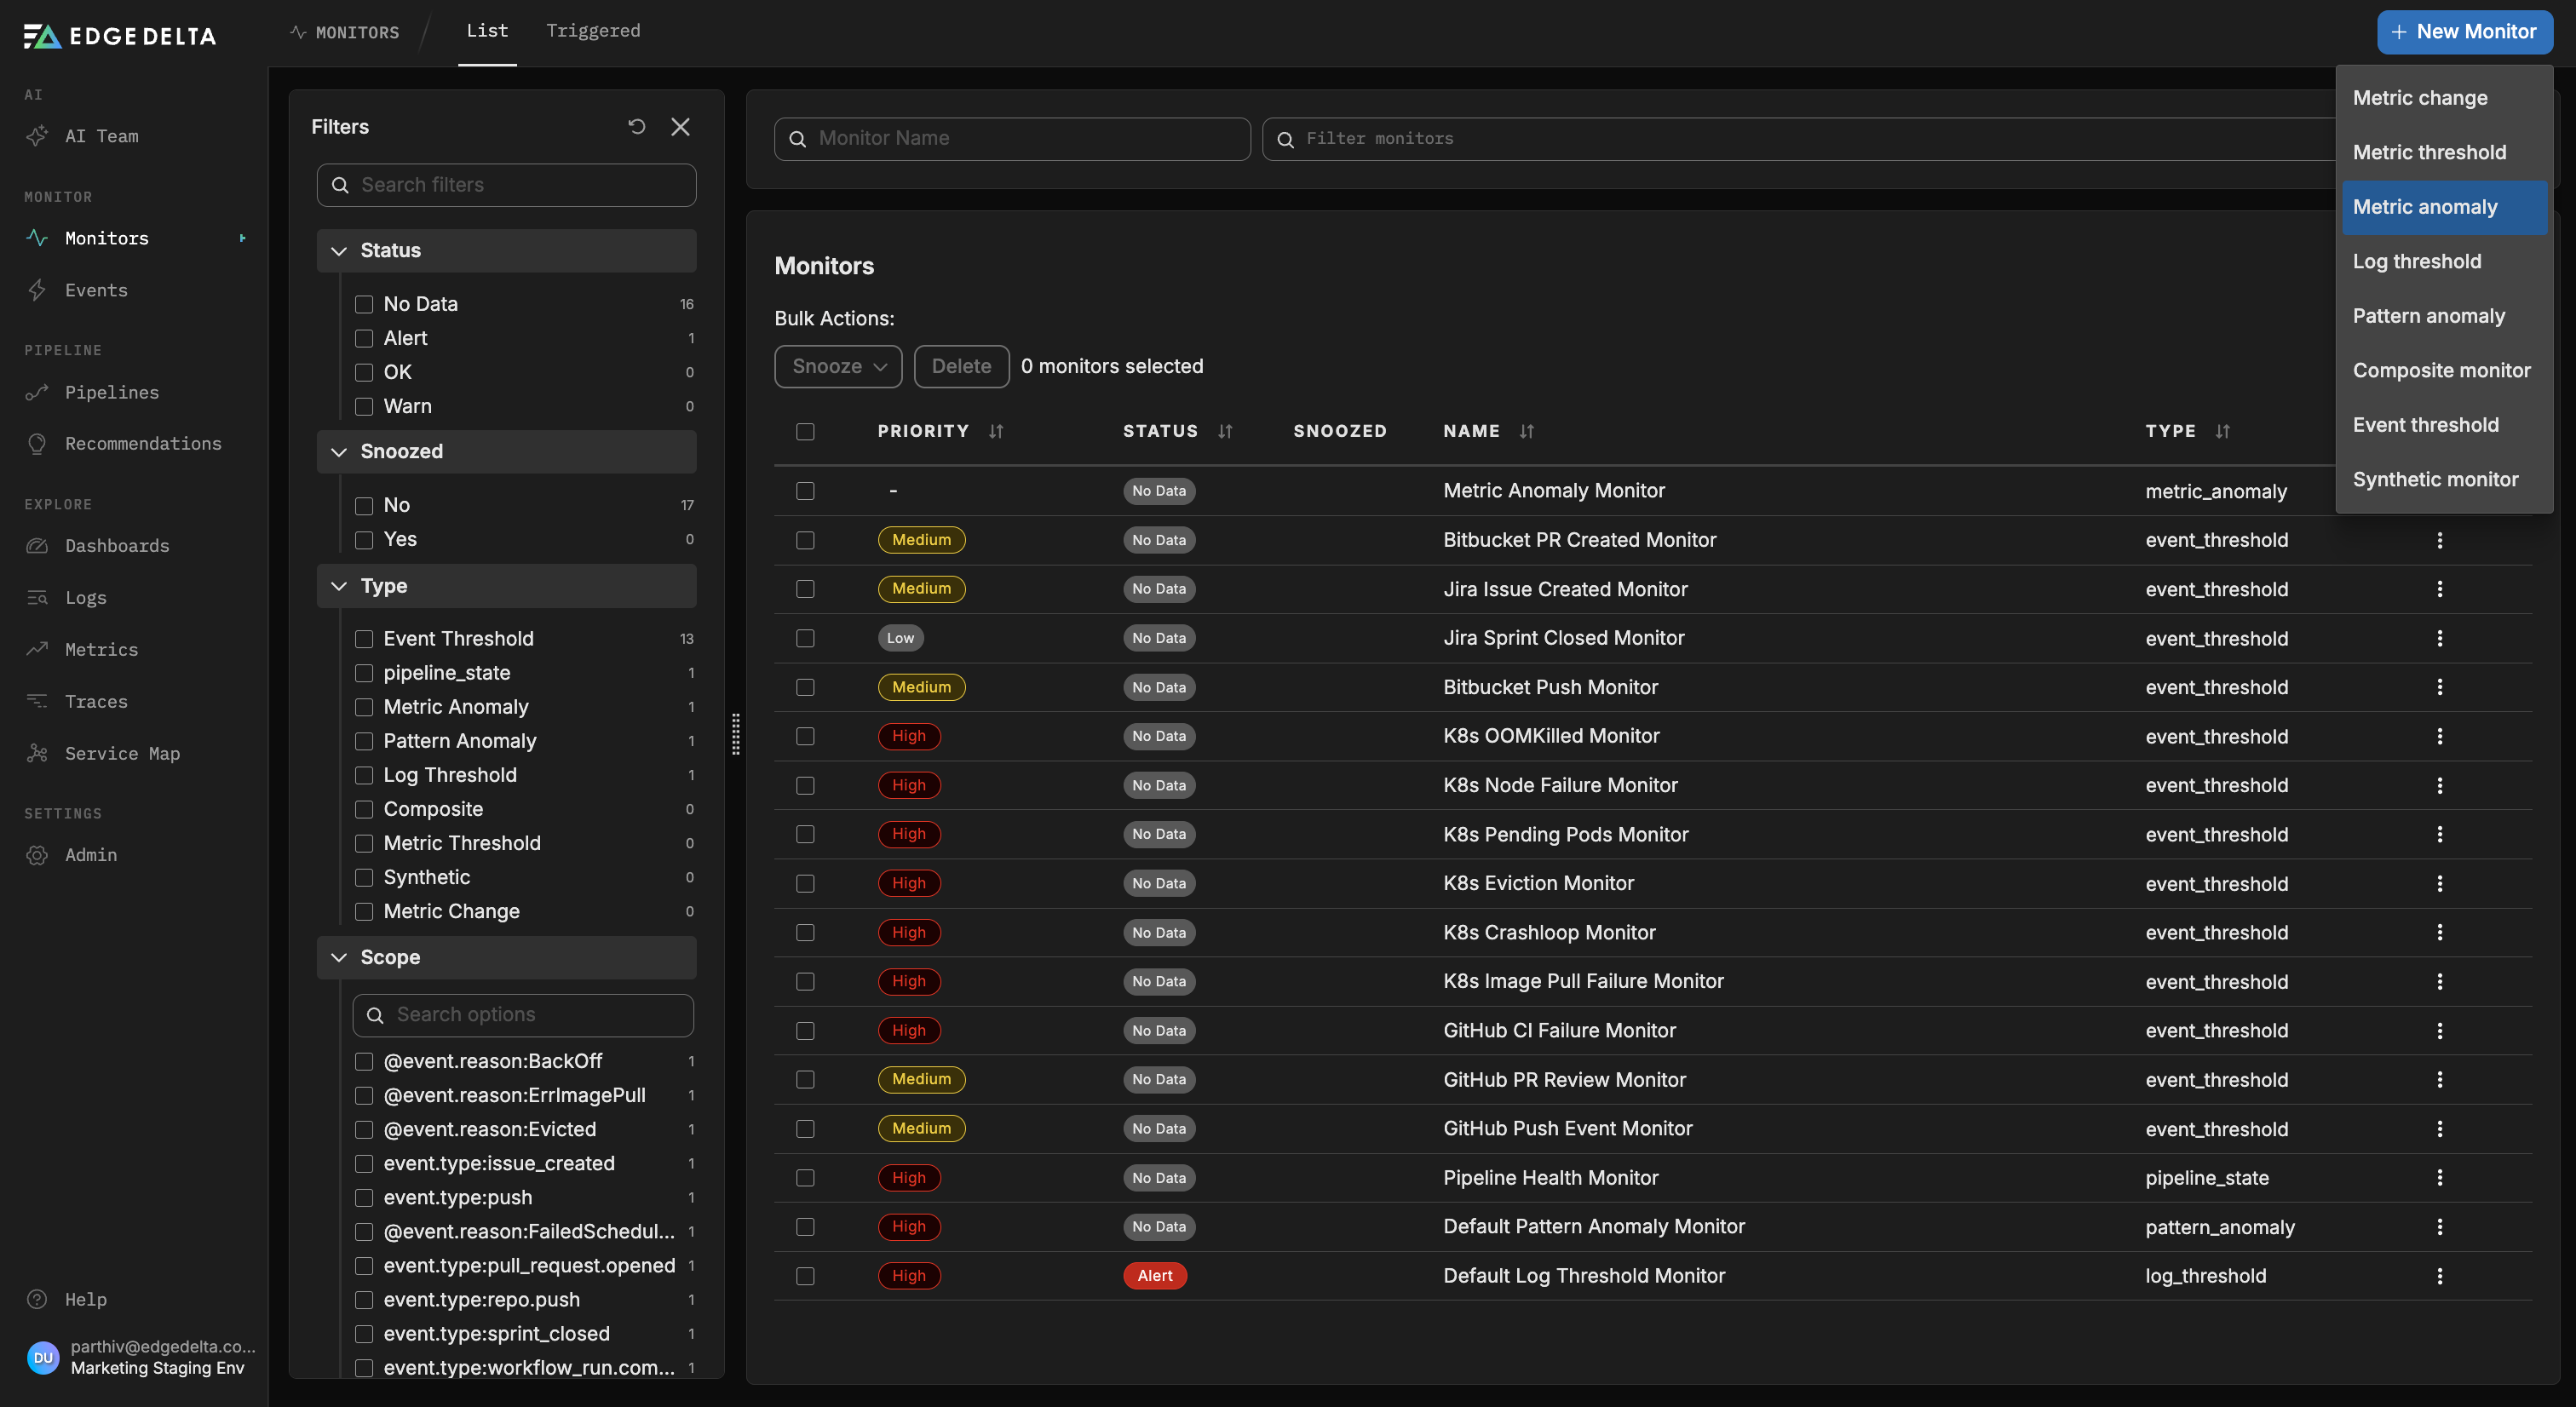
Click Monitors and select the Triggered tab.
Click + New Monitor and select Metric Anomaly.
Key Configuration Fields
Source
The Source allows you to scope the chosen metrics to specific services or environments using tags, dimensions, or labels. For example, a tag like ed.tag:"main-lab-gateway" restricts the monitor to metrics emitted by the main-lab-gateway pipeline specifically, which reduces noise and keeps alerts focused on the right target system.
Metric
The Metric specifies the exact telemetry signal being monitored, such as latency, request rate, or error count. Use the metrics explorer and metrics inventory to identify the right metric. You can also define a formula combining multiple metric queries.
Group By
Group the monitored signal by dimensions such as agent tag, host, namespace, or service name. This field is required if you want separate notifications per group. See Monitor Limits for group-by limits.
Aggregation Method
The Aggregation Method summarizes raw data points into each rollup interval before evaluation.
- Sum: Total of all values in the interval
- Average: Mean of values in the interval
- Minimum: Lowest value observed
- Maximum: Highest value observed
- Count: Total number of observations
- Median: Middle value in the dataset
- Count Unique: Number of distinct values
Rollup Window
The Rollup Window defines how metric data is pre-aggregated over time. A 1-minute rollup window collapses raw points into 1-minute intervals using the chosen aggregation method. Each rolled-up interval becomes one datapoint that feeds into the rolling baseline.
Evaluation Aggregation
The Evaluation Aggregation combines the rolled-up values into a single evaluated datapoint that the monitor tests against the anomaly band.
- Average: Mean of values
- Minimum: Lowest value seen
- Maximum: Highest value seen
- Sum: Total of all values
- Count: Number of values observed
Historical Window
The Historical Window sets how many past evaluated datapoints form the rolling baseline used to compute the mean and standard deviation. The default is 10 datapoints (valid range: 5-100).
The baseline grows incrementally: until the monitor has accumulated enough history to fill the window, it collects datapoints without alerting. Once the window is full, it advances as a sliding window, dropping the oldest datapoint each time a new one arrives.
Anomaly Direction
The Anomaly Direction controls which side of the baseline band triggers an alert.
| Value | Behavior |
|---|---|
| Both (default) | Alerts when the metric rises above or falls below the band |
| Above | Alerts only when the metric rises above the upper band boundary |
| Below | Alerts only when the metric falls below the lower band boundary |
Use Above for metrics like error rates where unexpectedly low values are not a concern. Use Below for metrics like throughput where drops are the risk. Use Both when deviations in either direction are meaningful.
Alert Threshold
The Alert Threshold is the number of standard deviations from the rolling mean that defines the alert band boundary. The default is 5.0 standard deviations.
alert_band_upper = historical_average + (alert_threshold x standard_deviation)alert_band_lower = historical_average - (alert_threshold x standard_deviation)
A lower value produces a tighter band and more sensitive alerting. A higher value only fires on extreme deviations.
Warning Threshold (Optional)
The Warning Threshold sets an inner band boundary for early warning alerts, expressed in the same standard deviation units as the alert threshold. It must be greater than zero and less than or equal to the alert threshold. When the metric crosses the warning band but not the alert band, the monitor enters a Warn state instead of Alert.
Consecutive Points
The Consecutive Points setting controls how many datapoints in a row must fall outside the band before an alert fires. The default is 1 (alert on the first outlier). Raising this value reduces noise for metrics with occasional spikes but delays alert onset.
If Data is Missing
The If data is missing for <evaluation window> dropdown controls how the monitor behaves when no data is available during the evaluation window.
- Evaluate as 0: Treats missing data as zero and proceeds with evaluation. May trigger alerts if zero is outside the anomaly band.
- Show No Data: Displays “No Data” status without sending notifications.
- Show No Data and Notify: Displays “No Data” and sends alert notifications. Use when missing data itself indicates a problem.
- Show OK: Treats missing data as normal. Use for metrics with legitimate gaps during off-hours.
Require a Full Window of Data for Evaluation
When enabled, the monitor waits until the entire evaluation window is populated before making any decision. This prevents false alerts during monitor startup or after gaps in data. When disabled, the monitor evaluates on partial data as soon as any arrives.
Example Configuration
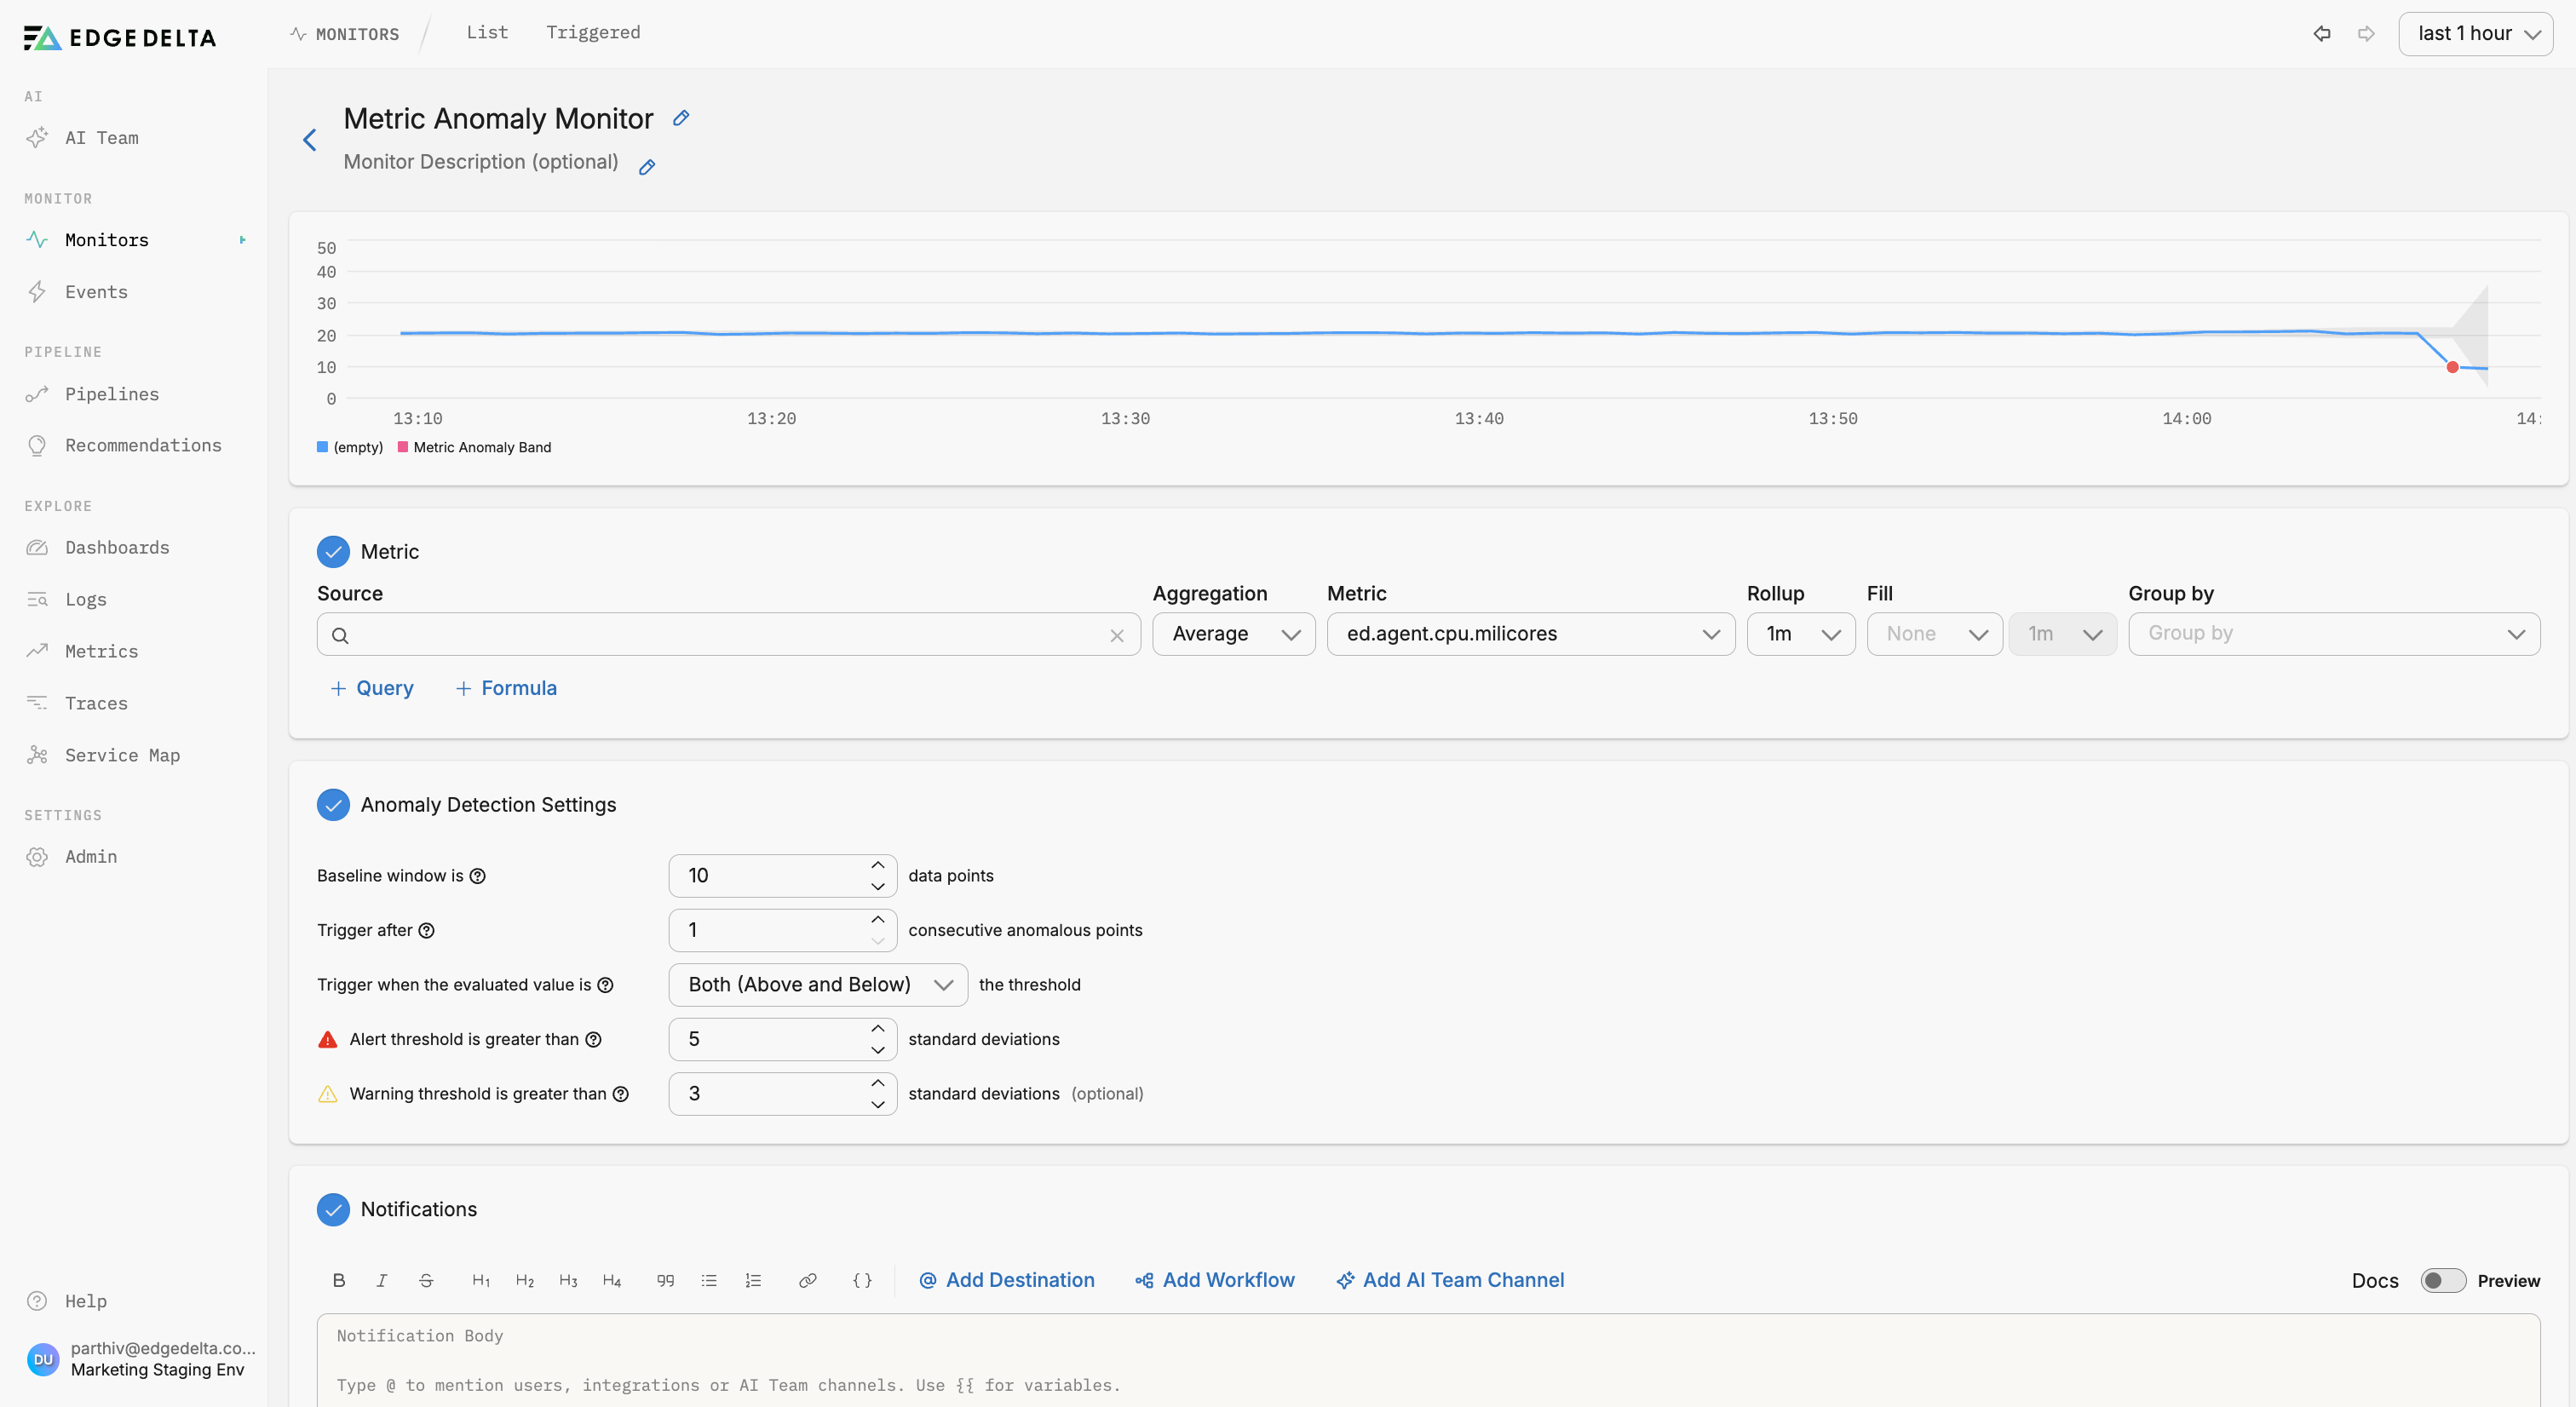
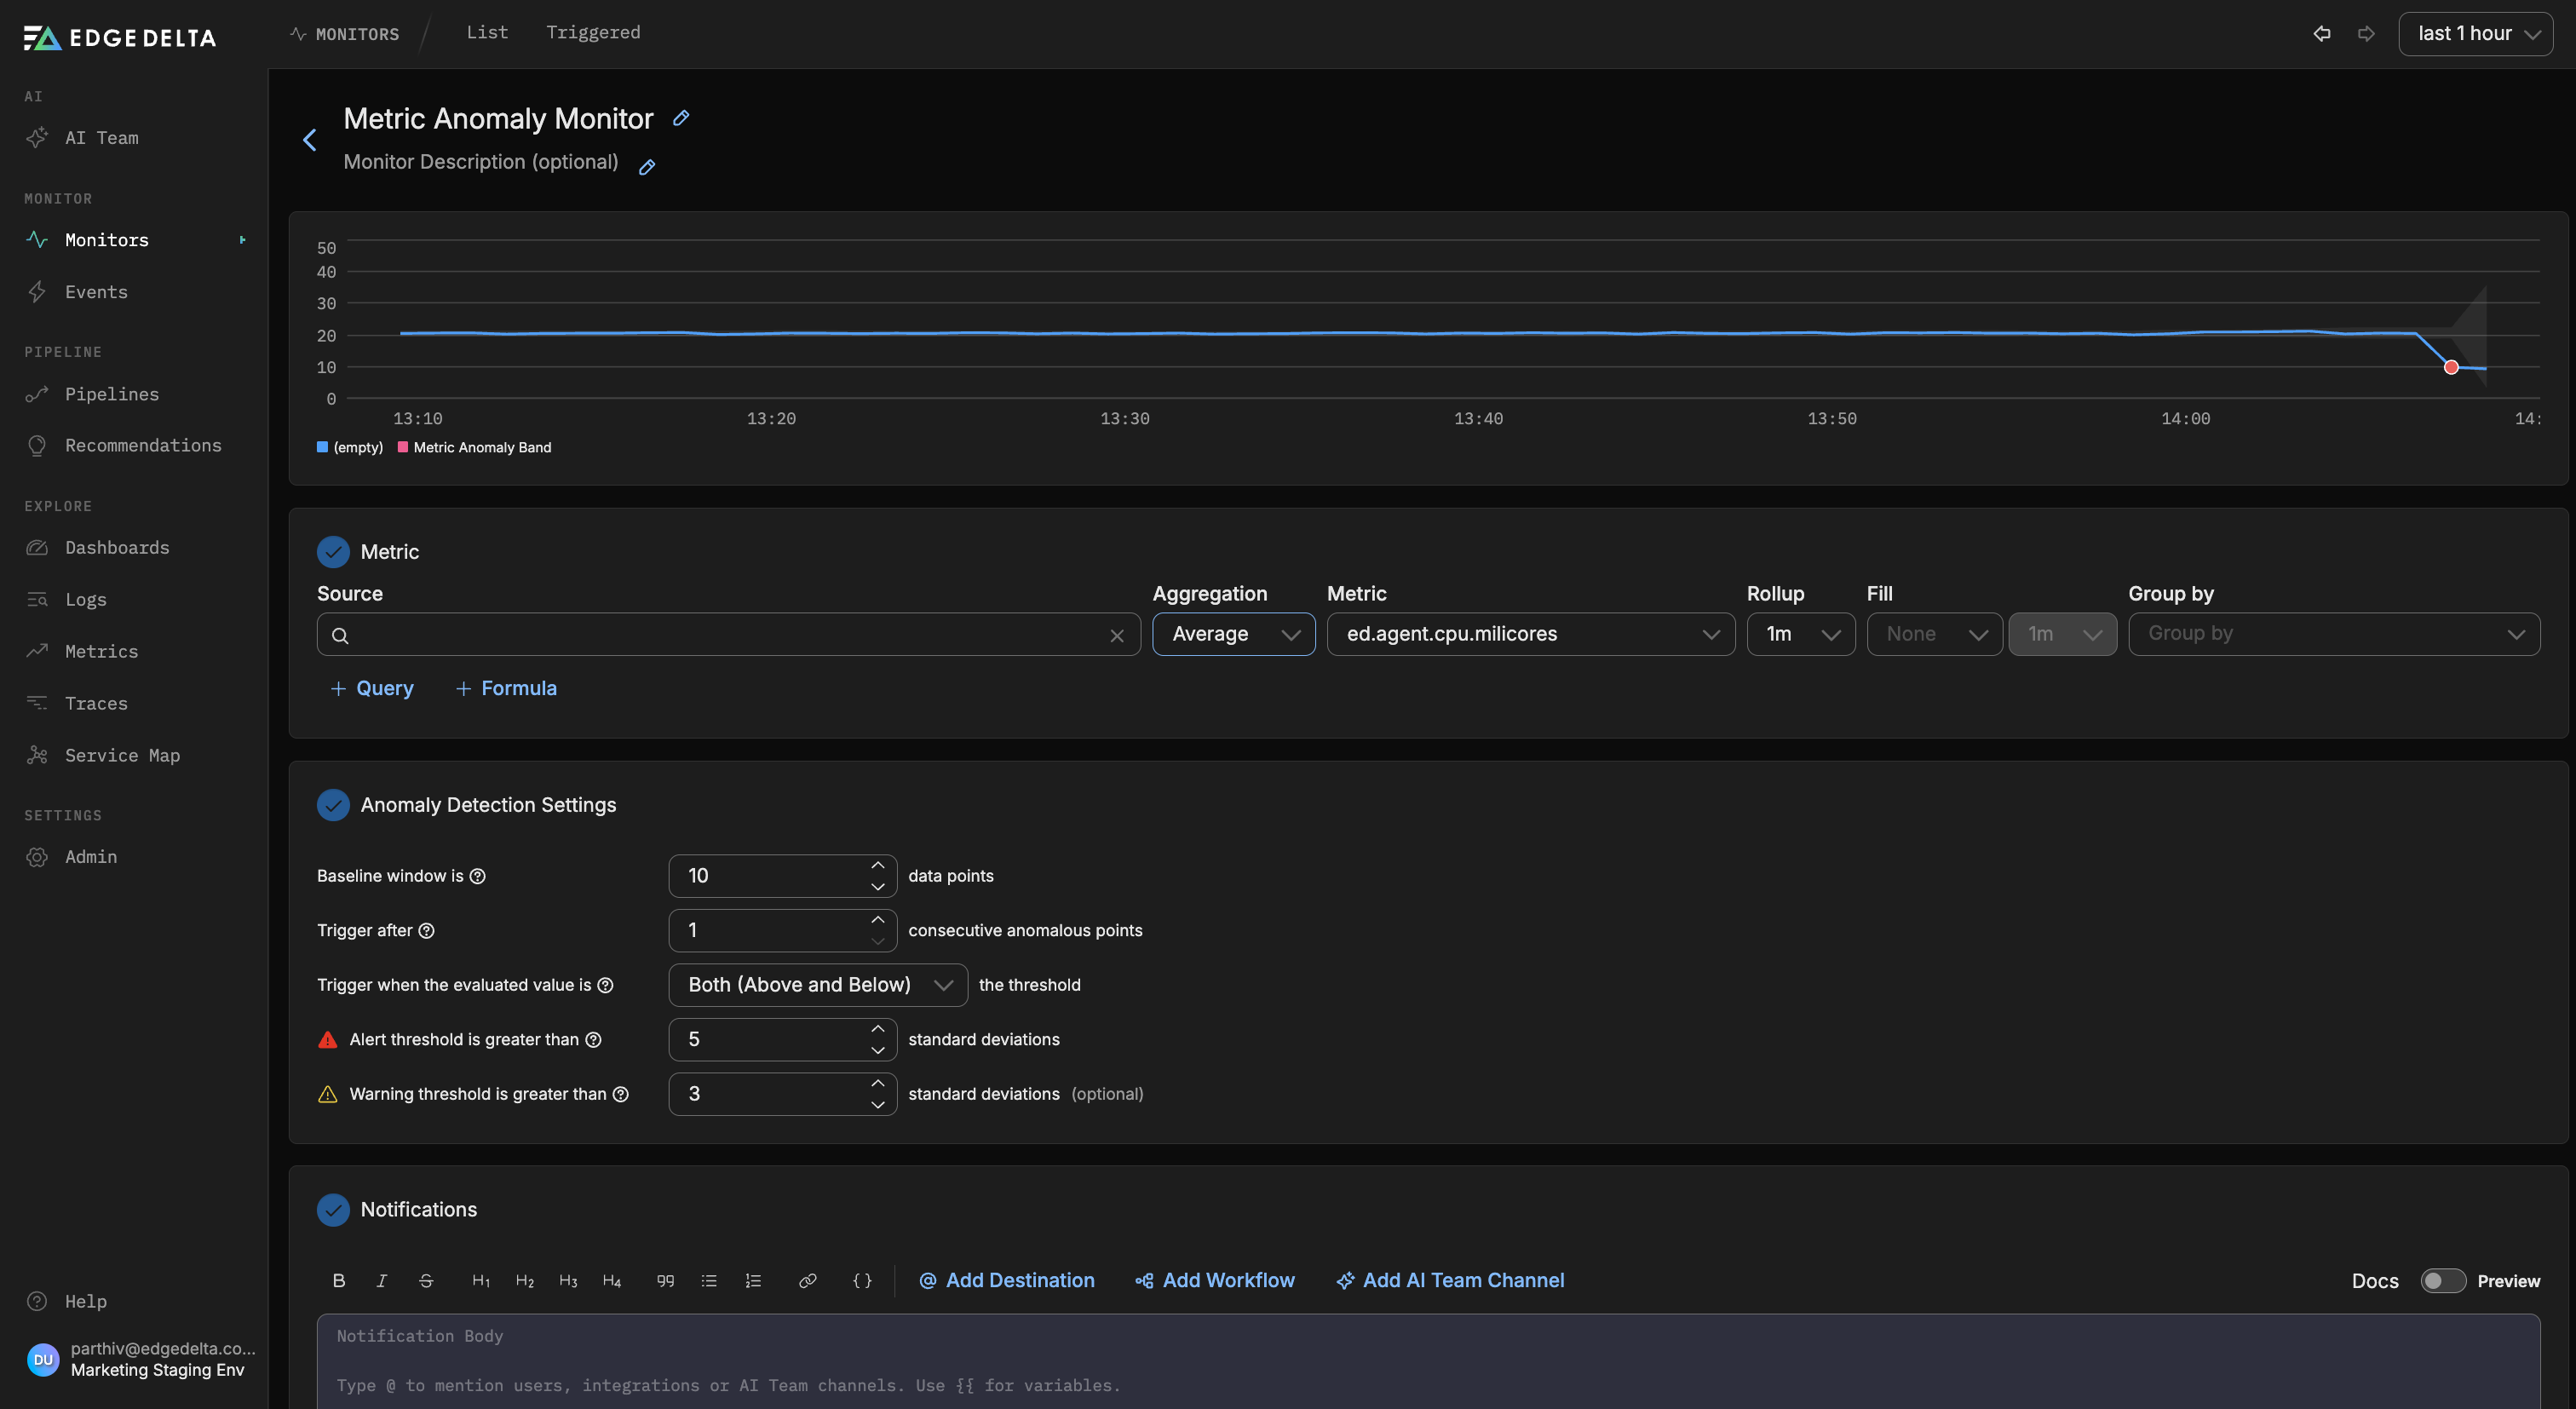
In this example, the monitor tracks the ed.agent.cpu.milicores metric with no source filter applied, so all sources are evaluated. The metric is aggregated using Average and rolled up into 1-minute intervals.
The Historical Window is set to 10 datapoints, so the baseline is built from the 10 most recently evaluated datapoints. The Anomaly Direction is Both (Above and Below), the Alert Threshold is 5 standard deviations, the Warning Threshold is 3 standard deviations, and Consecutive Points is 1.
Notification
Group Notifications By
To use source fields in the notification you must specify them in the Group By field in the Monitor Scope section and in the Group notifications by field in the Notifications section. This allows you to send separate notifications for each group combination, such as per-service or per-namespace alerts.