OTLP Connector
Configure the OTLP connector to collect logs, metrics, and traces from applications instrumented with OpenTelemetry for AI-powered observability.
16 minute read
Overview
The OTLP (OpenTelemetry Protocol) connector collects logs, metrics, and traces from applications instrumented with OpenTelemetry. OpenTelemetry is an open-source observability framework providing standardized instrumentation for capturing telemetry data. Edge Delta acts as an OTLP receiver, ingesting data in industry-standard OpenTelemetry format. Content streams into Edge Delta Pipelines for analysis by AI teammates through the Edge Delta MCP connector.
The connector supports all OpenTelemetry signals (traces, metrics, logs) via gRPC or HTTP protocols. It works seamlessly with OpenTelemetry SDKs and Collectors.
When you add this streaming connector, it appears as a OTLP source in your selected pipeline. AI teammates access this data by querying the Edge Delta backend with the Edge Delta MCP connector.
Add the OTLP Connector
To add the OTLP connector, you configure Edge Delta as an OTLP receiver by specifying port and protocol.
Prerequisites
Before configuring the connector, ensure you have:
- Edge Delta agent deployed with network access to receive OTLP data
- Applications instrumented with OpenTelemetry SDK or Collector configured to export telemetry
- Firewall rules allowing inbound traffic on OTLP port
- Identified port number for OTLP endpoint
Configuration Steps
- Navigate to AI Team > Connectors in the Edge Delta application
- Find the OTLP connector in Streaming Connectors
- Click the connector card
- Configure the Port number for listening (default: 8585)
- Select the Protocol (gRPC or HTTP/protobuf)
- Set Read Timeout for incoming connections
- Optionally configure Advanced Settings for TLS
- Select a target environment
- Click Save
The connector deploys and begins listening for OTLP data on the specified port.
Configuration Options
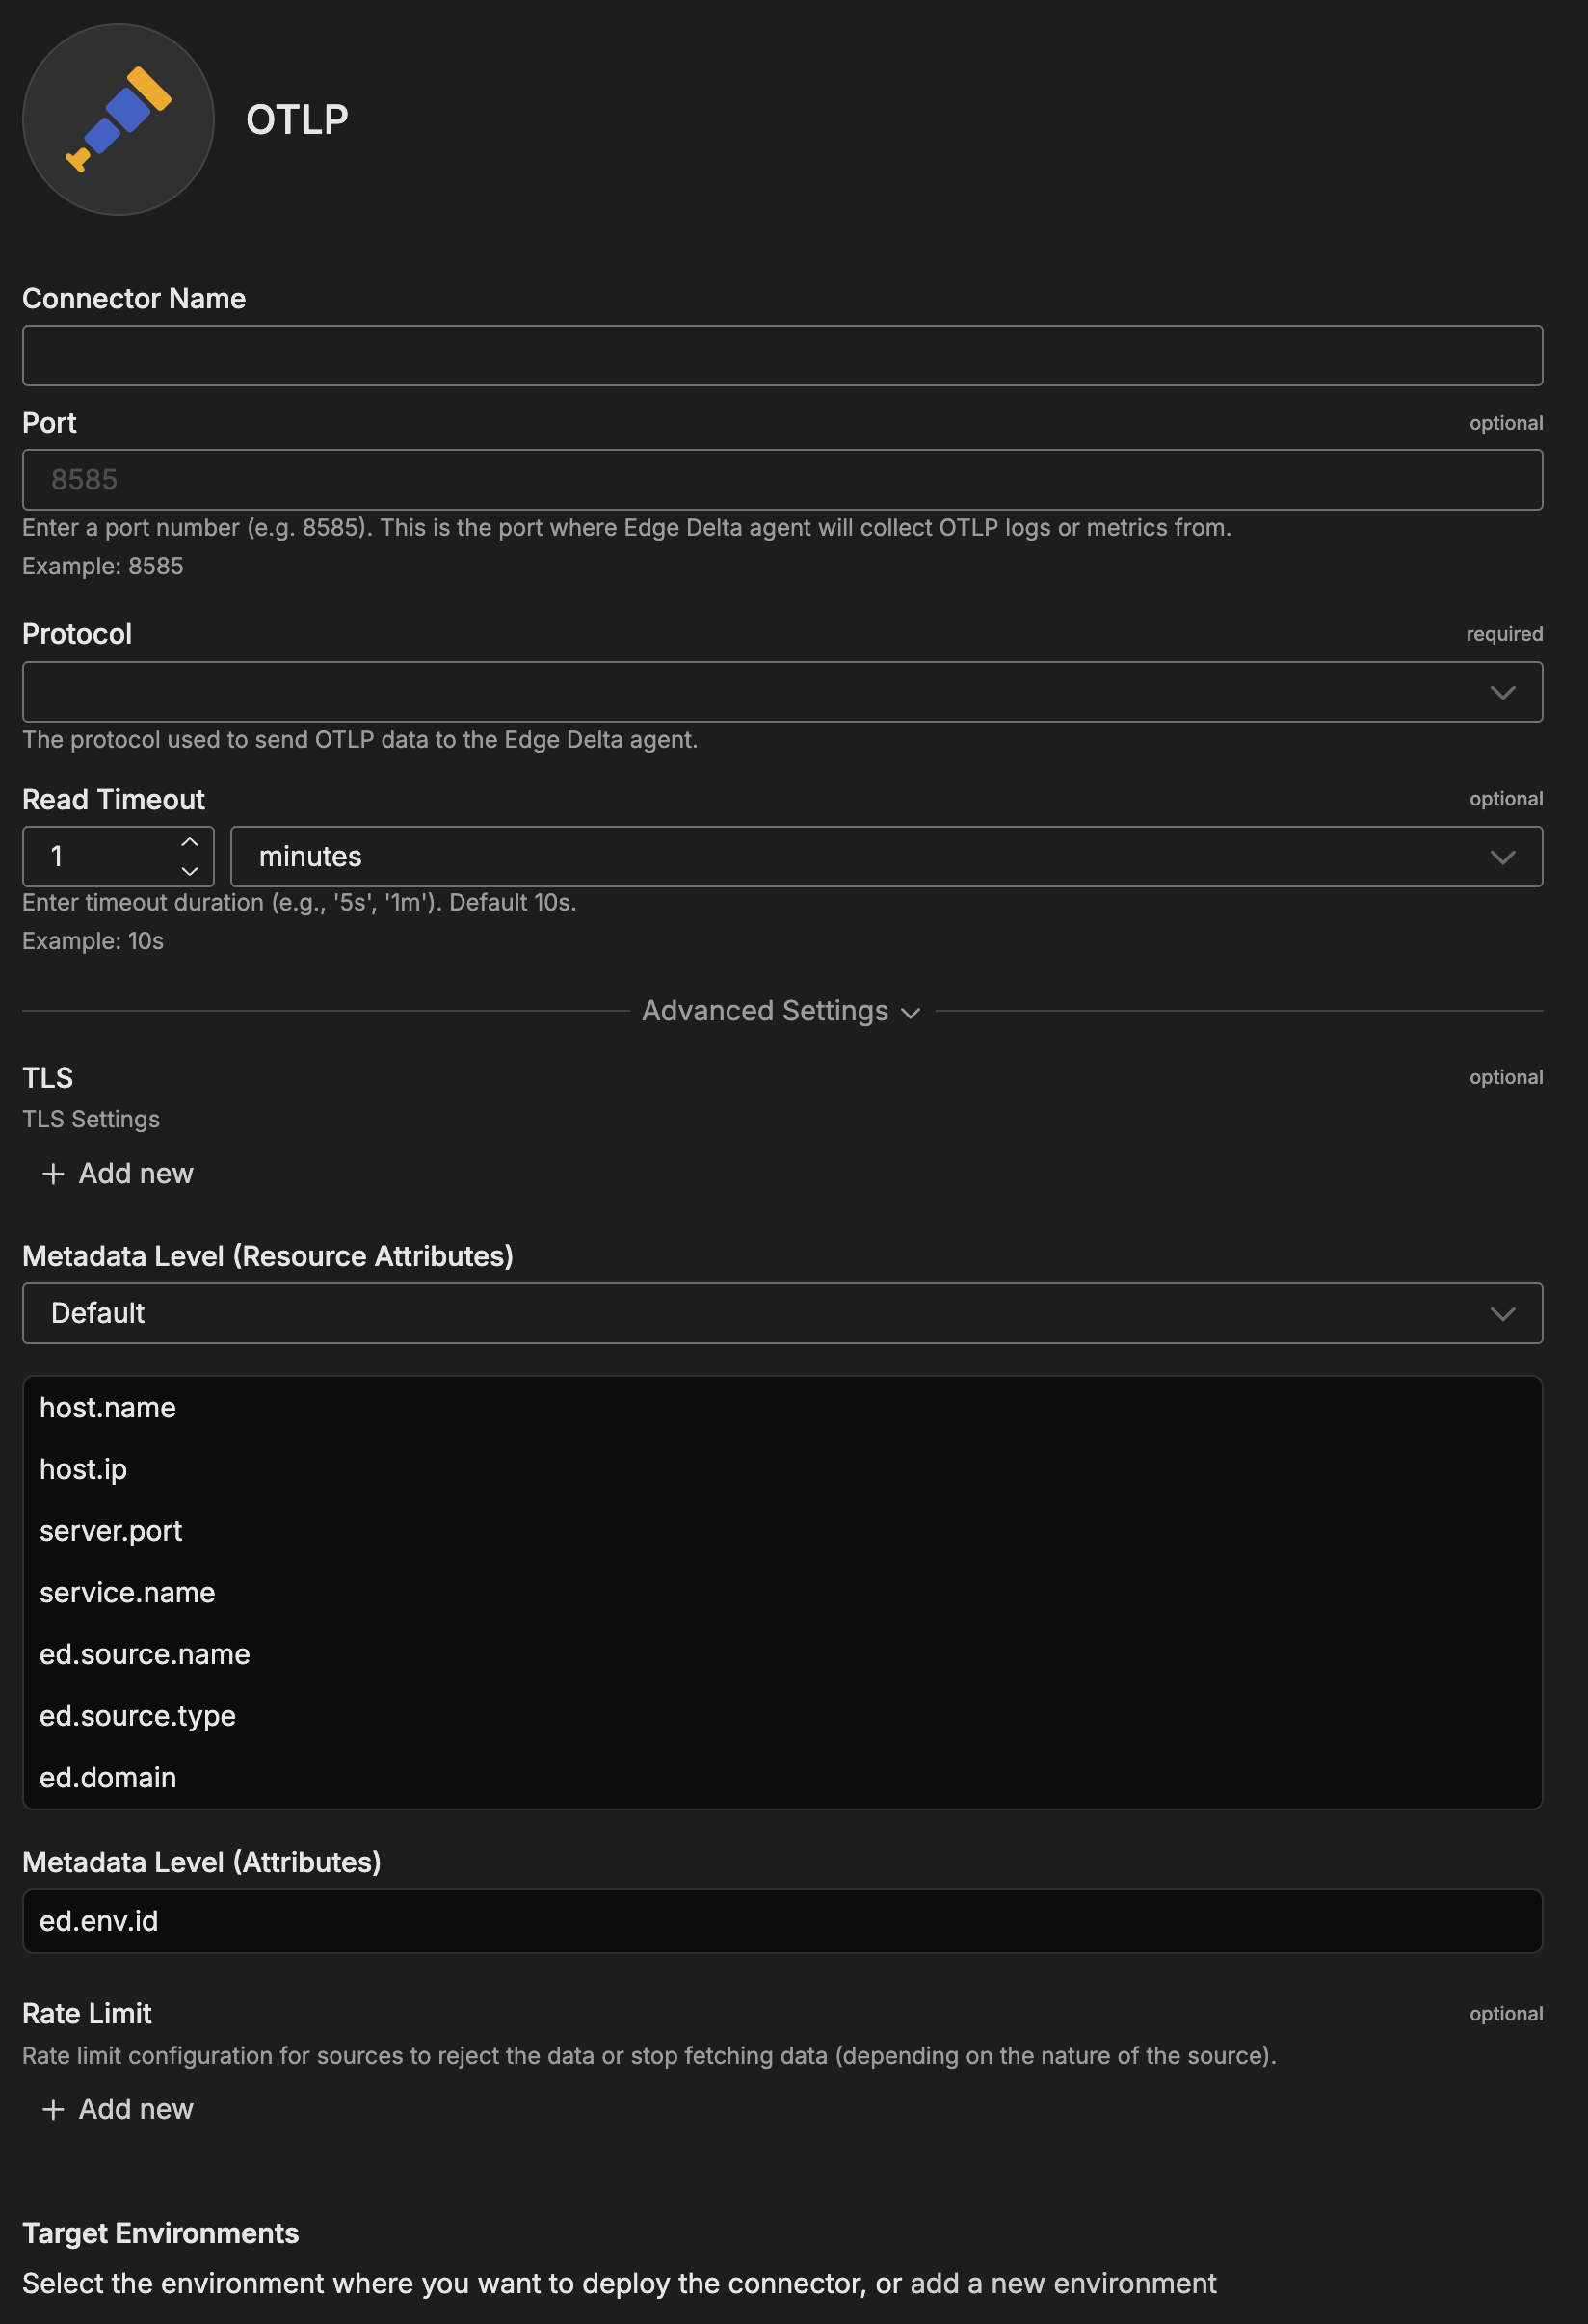
Connector Name
Name to identify this OTLP connector instance.
Port
Port number where Edge Delta agent will collect OTLP logs or metrics from.
Format: Integer between 1-65535
Default: 8585
Examples:
8585- Custom port4317- Standard OTLP gRPC port4318- Standard OTLP HTTP port
Port Notes:
- Use standard ports (4317 for gRPC, 4318 for HTTP) for compatibility with default OpenTelemetry exporters
- Use custom ports to avoid conflicts with existing services
Protocol
Protocol used to send OTLP data to the Edge Delta agent.
Values: gRPC, HTTP/protobuf
Default: gRPC
When to Use:
- gRPC: Production deployments (30-50% lower overhead, efficient binary protocol)
- HTTP/protobuf: Firewall-restricted environments, easier debugging
Performance: gRPC recommended for production due to better performance and bidirectional streaming.
Read Timeout
Timeout duration for incoming connections. Maximum time to wait for data.
Format: Duration with unit (s, m, h)
Default: 1 minute
Examples:
10s- 10 seconds (default in OTLP spec)30s- 30 seconds1m- 1 minute
Advanced Settings
TLS
Configure TLS settings for secure connections to this source. TLS is optional and typically used when the source node needs to accept encrypted connections or perform mutual TLS authentication with clients.
YAML Configuration Example:
nodes:
  - name: <node name>
    type: <source type>
    tls:
      <tls options>
CA Certificate File
Specifies the absolute path to a single CA (Certificate Authority) certificate file used to verify client certificates during mutual TLS authentication. This file contains the trusted CA certificate that signed the client certificates. Use this when you have a single CA certificate. (YAML parameter: ca_file)
When to use: Required when client_auth_type is set to verifyclientcertifgiven or requireandverifyclientcert. Choose either ca_file or ca_path, not both.
YAML Configuration Example:
nodes:
  - name: <node name>
    type: <source type>
    tls:
      ca_file: /certs/ca.pem
      client_auth_type: requireandverifyclientcert
CA Certificate Path
Specifies a directory path containing one or more CA certificate files for client certificate verification. Use this when you need to trust multiple CAs or when managing CA certificates across multiple files. All certificate files in the directory will be loaded. (YAML parameter: ca_path)
When to use: Alternative to ca_file when you have multiple CA certificates. Required when client_auth_type is set to verifyclientcertifgiven or requireandverifyclientcert. Choose either ca_file or ca_path, not both.
YAML Configuration Example:
nodes:
  - name: <node name>
    type: <source type>
    tls:
      ca_path: /certs/ca-certificates/
      client_auth_type: requireandverifyclientcert
Certificate File
Path to the server certificate file (public key) that will be presented to connecting clients during the TLS handshake. This certificate identifies the server and must match the private key. The certificate should be in PEM format and can include the full certificate chain. (YAML parameter: crt_file)
When to use: Required for TLS/HTTPS connections. Must be used together with key_file. Obtain this from your certificate authority or generate a self-signed certificate for testing.
YAML Configuration Example:
nodes:
  - name: <node name>
    type: <source type>
    tls:
      crt_file: /certs/server-cert.pem
      key_file: /certs/server-key.pem
Private Key File
Path to the private key file corresponding to the server certificate. This key must match the public key in the certificate file and is used to decrypt communications encrypted with the public key. Keep this file secure and restrict access permissions. (YAML parameter: key_file)
When to use: Required for TLS/HTTPS connections. Must be used together with crt_file. If the key file is encrypted, also specify key_password.
YAML Configuration Example:
nodes:
  - name: <node name>
    type: <source type>
    tls:
      crt_file: /certs/server-cert.pem
      key_file: /certs/server-key.pem
      key_password: <password>  # Only if key is encrypted
Private Key Password
Password (passphrase) used to decrypt an encrypted private key file. Only needed if your private key file is password-protected. If your key file is unencrypted, omit this parameter. (YAML parameter: key_password)
When to use: Optional. Only required if key_file is encrypted/password-protected. For enhanced security, use encrypted keys in production environments.
YAML Configuration Example:
nodes:
  - name: <node name>
    type: <source type>
    tls:
      crt_file: /certs/server-cert.pem
      key_file: /certs/encrypted-server-key.pem
      key_password: mySecurePassword123
Client Authentication Type
Controls how client certificates are requested and validated during the TLS handshake. This setting is specific to server-side TLS and determines the mutual TLS (mTLS) behavior. Use this to enforce certificate-based authentication from connecting clients for enhanced security. (YAML parameter: client_auth_type)
Valid options:
noclientcert- No client certificate is requested; any sent certificates are ignored. Use for standard TLS encryption without client authentication.requestclientcert- Client certificate is requested but not required. Useful for optional client authentication where you want to accept both authenticated and unauthenticated clients.requireanyclientcert- Client must send a certificate, but it is not validated against a CA. Use when you need proof a client has a certificate but don’t need to verify its authenticity.verifyclientcertifgiven- Certificate is requested but not required; if sent, it must be valid and signed by a trusted CA. Balances security with flexibility for mixed client environments.requireandverifyclientcert- Client must send a valid certificate signed by a trusted CA (full mutual TLS). Use for maximum security when all clients can be provisioned with certificates.
Default: noclientcert
When to use: Set to verifyclientcertifgiven or requireandverifyclientcert for secure environments where you need to verify client identity. When using certificate verification options, you must also configure ca_file or ca_path to specify the trusted CA certificates.
YAML Configuration Example:
nodes:
  - name: <node name>
    type: <source type>
    tls:
      client_auth_type: requireandverifyclientcert
      ca_file: /certs/ca.pem  # Required for certificate validation
Minimum TLS Version
Minimum TLS protocol version that will be accepted from connecting clients. This enforces a baseline security level by rejecting connections from clients using older, less secure TLS versions. (YAML parameter: min_version)
Available versions:
TLSv1_0- Deprecated, not recommended (security vulnerabilities)TLSv1_1- Deprecated, not recommended (security vulnerabilities)TLSv1_2- Recommended minimum for production (default)TLSv1_3- Most secure, use when all clients support it
Default: TLSv1_2
When to use: Set to TLSv1_2 or higher for production deployments. Only use TLSv1_0 or TLSv1_1 if you must support legacy clients that cannot upgrade, and be aware of the security risks. TLS 1.0 and 1.1 are officially deprecated and should be avoided.
YAML Configuration Example:
nodes:
  - name: <node name>
    type: <source type>
    tls:
      min_version: TLSv1_2
Maximum TLS Version
Maximum TLS protocol version that will be accepted from connecting clients. This is typically used to restrict newer TLS versions if compatibility issues arise with specific client implementations. (YAML parameter: max_version)
Available versions:
TLSv1_0TLSv1_1TLSv1_2TLSv1_3
When to use: Usually left unset to allow the most secure version available. Only set this if you encounter specific compatibility issues with TLS 1.3 clients, or for testing purposes. In most cases, you should allow the latest TLS version.
YAML Configuration Example:
nodes:
  - name: <node name>
    type: <source type>
    tls:
      max_version: TLSv1_3
When to Enable:
- Production deployments
- Telemetry contains sensitive data
- Compliance requirements for encryption
- Public/untrusted networks
mTLS: Enable client authentication for additional security (client certificates required).
Metadata Level
This option is used to define which detected resources and attributes to add to each data item as it is ingested by Edge Delta. You can select:
- Required Only: This option includes the minimum required resources and attributes for Edge Delta to operate.
- Default: This option includes the required resources and attributes plus those selected by Edge Delta
- High: This option includes the required resources and attributes along with a larger selection of common optional fields.
- Custom: With this option selected, you can choose which attributes and resources to include. The required fields are selected by default and can’t be unchecked.
Based on your selection in the GUI, the source_metadata YAML is populated as two dictionaries (resource_attributes and attributes) with Boolean values.
See Choose Data Item Metadata for more information on selecting metadata.
OTLP-specific metadata included:
server.port- Port number receiver listening oned.domain- Edge Delta domain
OpenTelemetry Resource Attributes: Applications send resource attributes (service.name, service.version, deployment.environment, k8s.pod.name, cloud.region) which are automatically extracted and queryable by AI teammates.
Rate Limit
The rate_limit parameter enables you to control data ingestion based on system resource usage. This advanced setting helps prevent source nodes from overwhelming the agent by automatically throttling or stopping data collection when CPU or memory thresholds are exceeded.
Use rate limiting to prevent runaway log collection from overwhelming the agent in high-volume sources, protect agent stability in resource-constrained environments with limited CPU/memory, automatically throttle during bursty traffic patterns, and ensure fair resource allocation across source nodes in multi-tenant deployments.
When rate limiting triggers, pull-based sources (File, S3, HTTP Pull) stop fetching new data, push-based sources (HTTP, TCP, UDP, OTLP) reject incoming data, and stream-based sources (Kafka, Pub/Sub) pause consumption. Rate limiting operates at the source node level, where each source with rate limiting enabled independently monitors and enforces its own thresholds.
Rate limiting vs backpressure: Rate limiting and backpressure are different mechanisms. Rate limiting controls data ingestion at the source based on CPU or memory thresholds. Backpressure controls data output at the destination when in-memory queues fill up. Backpressure logs such as
backpressure: dataCh at 92% capacitydo not appear when rate limiting triggers, and rate limiting logs do not appear during backpressure events.
Observability: When rate limiting is active in enforce mode, the agent does not produce INFO, WARN, or ERROR level logs. To confirm that rate limiting is triggering, check the source node’s Bytes I/O metrics in the Edge Delta app for gaps or drops that coincide with expected throttling periods.
Configuration Steps:
- Click Add New in the Rate Limit section
- Click Add New for Evaluation Policy
- Select Policy Type:
- CPU Usage: Monitors CPU consumption and rate limits when usage exceeds defined thresholds. Use for CPU-intensive sources like file parsing or complex transformations.
- Memory Usage: Monitors memory consumption and rate limits when usage exceeds defined thresholds. Use for memory-intensive sources like large message buffers or caching.
- AND (composite): Combines multiple sub-policies with AND logic. All sub-policies must be true simultaneously to trigger rate limiting. Use when you want conservative rate limiting (both CPU and memory must be high).
- OR (composite): Combines multiple sub-policies with OR logic. Any sub-policy can trigger rate limiting. Use when you want aggressive rate limiting (either CPU or memory being high triggers).
- Select Evaluation Mode. Choose how the policy behaves when thresholds are exceeded:
- Enforce (default): Actively applies rate limiting when thresholds are met. Pull-based sources (File, S3, HTTP Pull) stop fetching new data, push-based sources (HTTP, TCP, UDP, OTLP) reject incoming data, and stream-based sources (Kafka, Pub/Sub) pause consumption. Use in production to protect agent resources.
- Monitor: Logs when rate limiting would occur without actually limiting data flow. Use for testing thresholds before enforcing them in production.
- Passthrough: Disables rate limiting entirely while keeping the configuration in place. Use to temporarily disable rate limiting without removing configuration.
- Set Absolute Limits and Relative Limits (for CPU Usage and Memory Usage policies)
Note: If you specify both absolute and relative limits, the system evaluates both conditions and rate limiting triggers when either condition is met (OR logic). For example, if you set absolute limit to
1.0CPU cores and relative limit to50%, rate limiting triggers when the source uses either 1 full core OR 50% of available CPU, whichever happens first.
For CPU Absolute Limits: Enter value in full core units:
0.1= one-tenth of a CPU core0.5= half a CPU core1.0= one full CPU core2.0= two full CPU cores
For CPU Relative Limits: Enter percentage of total available CPU (0-100):
50= 50% of available CPU75= 75% of available CPU85= 85% of available CPU
For Memory Absolute Limits: Enter value in bytes
104857600= 100Mi (100 × 1024 × 1024)536870912= 512Mi (512 × 1024 × 1024)1073741824= 1Gi (1 × 1024 × 1024 × 1024)
For Memory Relative Limits: Enter percentage of total available memory (0-100)
60= 60% of available memory75= 75% of available memory80= 80% of available memory
- Set Refresh Interval (for CPU Usage and Memory Usage policies). Specify how frequently the system checks resource usage:
- Recommended Values:
10sto30sfor most use cases5sto10sfor high-volume sources requiring quick response1mor higher for stable, low-volume sources
The system fetches current CPU/memory usage at the specified refresh interval and uses that value for evaluation until the next refresh. Shorter intervals provide more responsive rate limiting but incur slightly higher overhead, while longer intervals are more efficient but slower to react to sudden resource spikes.
The GUI generates YAML as follows:
# Simple CPU-based rate limiting
nodes:
  - name: <node name>
    type: <node type>
    rate_limit:
      evaluation_policy:
        policy_type: cpu_usage
        evaluation_mode: enforce
        absolute_limit: 0.5  # Limit to half a CPU core
        refresh_interval: 10s
# Simple memory-based rate limiting
nodes:
  - name: <node name>
    type: <node type>
    rate_limit:
      evaluation_policy:
        policy_type: memory_usage
        evaluation_mode: enforce
        absolute_limit: 536870912  # 512Mi in bytes
        refresh_interval: 30s
Composite Policies (AND / OR)
When using AND or OR policy types, you define sub-policies instead of limits. Sub-policies must be siblings (at the same level)—do not nest sub-policies within other sub-policies. Each sub-policy is independently evaluated, and the parent policy’s evaluation mode applies to the composite result.
- AND Logic: All sub-policies must evaluate to true at the same time to trigger rate limiting. Use when you want conservative rate limiting (limit only when CPU AND memory are both high).
- OR Logic: Any sub-policy evaluating to true triggers rate limiting. Use when you want aggressive protection (limit when either CPU OR memory is high).
Configuration Steps:
- Select AND (composite) or OR (composite) as the Policy Type
- Choose the Evaluation Mode (typically Enforce)
- Click Add New under Sub-Policies to add the first condition
- Configure the first sub-policy by selecting policy type (CPU Usage or Memory Usage), selecting evaluation mode, setting absolute and/or relative limits, and setting refresh interval
- In the parent policy (not within the child), click Add New again to add a sibling sub-policy
- Configure additional sub-policies following the same pattern
The GUI generates YAML as follows:
# AND composite policy - both CPU AND memory must exceed limits
nodes:
  - name: <node name>
    type: <node type>
    rate_limit:
      evaluation_policy:
        policy_type: and
        evaluation_mode: enforce
        sub_policies:
          # First sub-policy (sibling)
          - policy_type: cpu_usage
            evaluation_mode: enforce
            absolute_limit: 0.75  # Limit to 75% of one core
            refresh_interval: 15s
          # Second sub-policy (sibling)
          - policy_type: memory_usage
            evaluation_mode: enforce
            absolute_limit: 1073741824  # 1Gi in bytes
            refresh_interval: 15s
# OR composite policy - either CPU OR memory can trigger
nodes:
  - name: <node name>
    type: <node type>
    rate_limit:
      evaluation_policy:
        policy_type: or
        evaluation_mode: enforce
        sub_policies:
          - policy_type: cpu_usage
            evaluation_mode: enforce
            relative_limit: 85  # 85% of available CPU
            refresh_interval: 20s
          - policy_type: memory_usage
            evaluation_mode: enforce
            relative_limit: 80  # 80% of available memory
            refresh_interval: 20s
# Monitor mode for testing thresholds
nodes:
  - name: <node name>
    type: <node type>
    rate_limit:
      evaluation_policy:
        policy_type: memory_usage
        evaluation_mode: monitor  # Only logs, doesn't limit
        relative_limit: 70  # Test at 70% before enforcing
        refresh_interval: 30s
Target Environments
Select the Edge Delta pipeline (environment) where you want to deploy this connector.
How to Use the OTLP Connector
The OTLP connector integrates seamlessly with AI Team, enabling AI-powered observability for OpenTelemetry-instrumented applications. AI teammates automatically leverage telemetry data to analyze performance, troubleshoot issues, and monitor service health.
Use Case: Distributed Trace Analysis
Identify performance bottlenecks by analyzing distributed traces showing request flows through microservices. AI teammates query trace data to find slow requests, break down latency by service, and identify which service contributes most to overall latency. When combined with PagerDuty alerts, teammates automatically investigate performance degradations by querying recent traces and identifying bottleneck services.
Configuration: Protocol: gRPC, Port: 4317, Configure OpenTelemetry SDK to export traces to Edge Delta endpoint.
Use Case: Error Rate Monitoring
Detect error spikes and diagnose root causes through correlated traces and logs. AI teammates identify which service is failing, analyze error messages, and determine common patterns. This is valuable when troubleshooting incidents—teammates correlate error traces with detailed logs to reveal underlying causes.
Configuration: Protocol: HTTP/protobuf, Port: 4318, Configure applications to export both traces and logs with trace correlation.
Use Case: Service Dependency Mapping
Understand microservice dependencies by analyzing trace data showing service-to-service calls. AI teammates construct dependency graphs, identify critical paths, and assess impact of changes. When integrated with Jira, teammates automatically document dependencies by querying trace patterns and creating architecture diagrams.
Configuration: Protocol: gRPC, Port: 4317, Instrument all services with OpenTelemetry for complete dependency visibility.
Configuring OpenTelemetry Exporters
After deploying the OTLP connector, configure applications to send telemetry to Edge Delta.
Environment Variables (Universal)
Most SDKs support configuration via environment variables:
export OTEL_EXPORTER_OTLP_ENDPOINT=http://edge-delta-host:8585
export OTEL_EXPORTER_OTLP_PROTOCOL=http/protobuf
export OTEL_SERVICE_NAME=my-application
export OTEL_RESOURCE_ATTRIBUTES=environment=production,version=1.2.3
OpenTelemetry SDK (Go Example)
import (
    "go.opentelemetry.io/otel/exporters/otlp/otlptrace/otlptracegrpc"
    "go.opentelemetry.io/otel/sdk/trace"
)

exporter, _ := otlptracegrpc.New(
    context.Background(),
    otlptracegrpc.WithEndpoint("edge-delta-host:4317"),
    otlptracegrpc.WithInsecure(), // Use WithTLSCredentials() for TLS
)

tp := trace.NewTracerProvider(trace.WithBatcher(exporter))
otel.SetTracerProvider(tp)
OpenTelemetry Collector
Configure OTLP exporter in config.yaml:
exporters:
  otlp:
    endpoint: edge-delta-host:4317
    tls:
      insecure: true  # Set to false and configure certificates for TLS

service:
  pipelines:
    traces:
      receivers: [otlp]
      exporters: [otlp]
Troubleshooting
No telemetry appearing: Verify Edge Delta listening on port (netstat -tuln | grep 8585). Check exporter endpoint matches receiver address. Test connectivity (telnet edge-delta-host 8585). Review application logs for export errors.
Connection refused: Ensure OTLP connector deployed to correct environment. Verify Edge Delta agent running. Check firewall rules allow inbound traffic on OTLP port.
TLS handshake failures: Verify certificates valid and not expired. Ensure both sides use compatible TLS versions. For mTLS, check client certificates properly configured and trusted by receiver.
Missing signal types: Verify signal types enabled in connector configuration. Check application exporters configured to send all expected signals (traces, metrics, logs). Some SDKs require separate exporter configuration per signal type.
High memory usage: Implement sampling in OpenTelemetry exporters to reduce volume. Enable gzip compression. Filter unnecessary high-cardinality attributes before sending. Review for abnormally large traces or logs.
Application performance degradation: Configure batch exporters (512-2048 spans per batch) instead of individual exports. Set export timeouts to prevent blocking. Use asynchronous export in background threads. Implement sampling for high-volume applications.
Incomplete distributed traces: Verify all services propagate trace context through headers (HTTP) or metadata (gRPC). Ensure compatible OpenTelemetry SDKs across services. Use parent-based sampling so children honor root sampling decision.
Missing resource attributes: Configure OTEL_SERVICE_NAME and OTEL_RESOURCE_ATTRIBUTES environment variables. Set attributes like service.name, service.version, deployment.environment in exporter configuration.
Next Steps
- Learn about OTLP input node for advanced configuration
- Explore OTLP input node preparation for comprehensive OpenTelemetry ingestion setup and implementation examples
- Learn about creating custom teammates that can use OpenTelemetry data
For additional help, visit AI Team Support.