Pub/Sub Connector
Configure the Pub/Sub connector to collect messages from Google Cloud Pub/Sub subscriptions for AI-powered analysis of application logs, events, and real-time data.
12 minute read
Overview
The Pub/Sub connector collects messages from Google Cloud Pub/Sub subscriptions. Pub/Sub is a fully-managed messaging service providing reliable, asynchronous communication through a publish-subscribe pattern. Content streams into Edge Delta Pipelines for analysis by AI teammates through the Edge Delta MCP connector.
The connector uses pull subscription model to consume messages with automatic acknowledgment and service account authentication. It integrates natively with Google Cloud services (Cloud Run, Cloud Functions, GKE) for centralized log and event collection.
When you add this streaming connector, it appears as a Pub/Sub source in your selected pipeline. AI teammates access this data by querying the Edge Delta backend with the Edge Delta MCP connector.
Add the Pub/Sub Connector
To add the Pub/Sub connector, you configure a GCP service account with subscriber permissions and specify which subscription to pull messages from.
Prerequisites
Before configuring the connector, ensure you have:
- Google Cloud Platform project with Pub/Sub enabled
- Pub/Sub subscription created for the topic to monitor
- Service account with
roles/pubsub.subscriberrole - Service account JSON key file downloaded
- Identified which subscription to consume messages from
Create service account:
gcloud iam service-accounts create edgedelta-pubsub \
  --display-name "Edge Delta Pub/Sub Reader"

gcloud projects add-iam-policy-binding PROJECT_ID \
  --member="serviceAccount:edgedelta-pubsub@PROJECT_ID.iam.gserviceaccount.com" \
  --role="roles/pubsub.subscriber"

gcloud iam service-accounts keys create edgedelta-key.json \
  --iam-account=edgedelta-pubsub@PROJECT_ID.iam.gserviceaccount.com
Create subscription:
gcloud pubsub subscriptions create edgedelta-sub \
  --topic=application-logs \
  --ack-deadline=60 \
  --message-retention-duration=7d
Configuration Steps
- Navigate to AI Team > Connectors in the Edge Delta application
- Find the Pub/Sub connector in Streaming Connectors
- Click the connector card
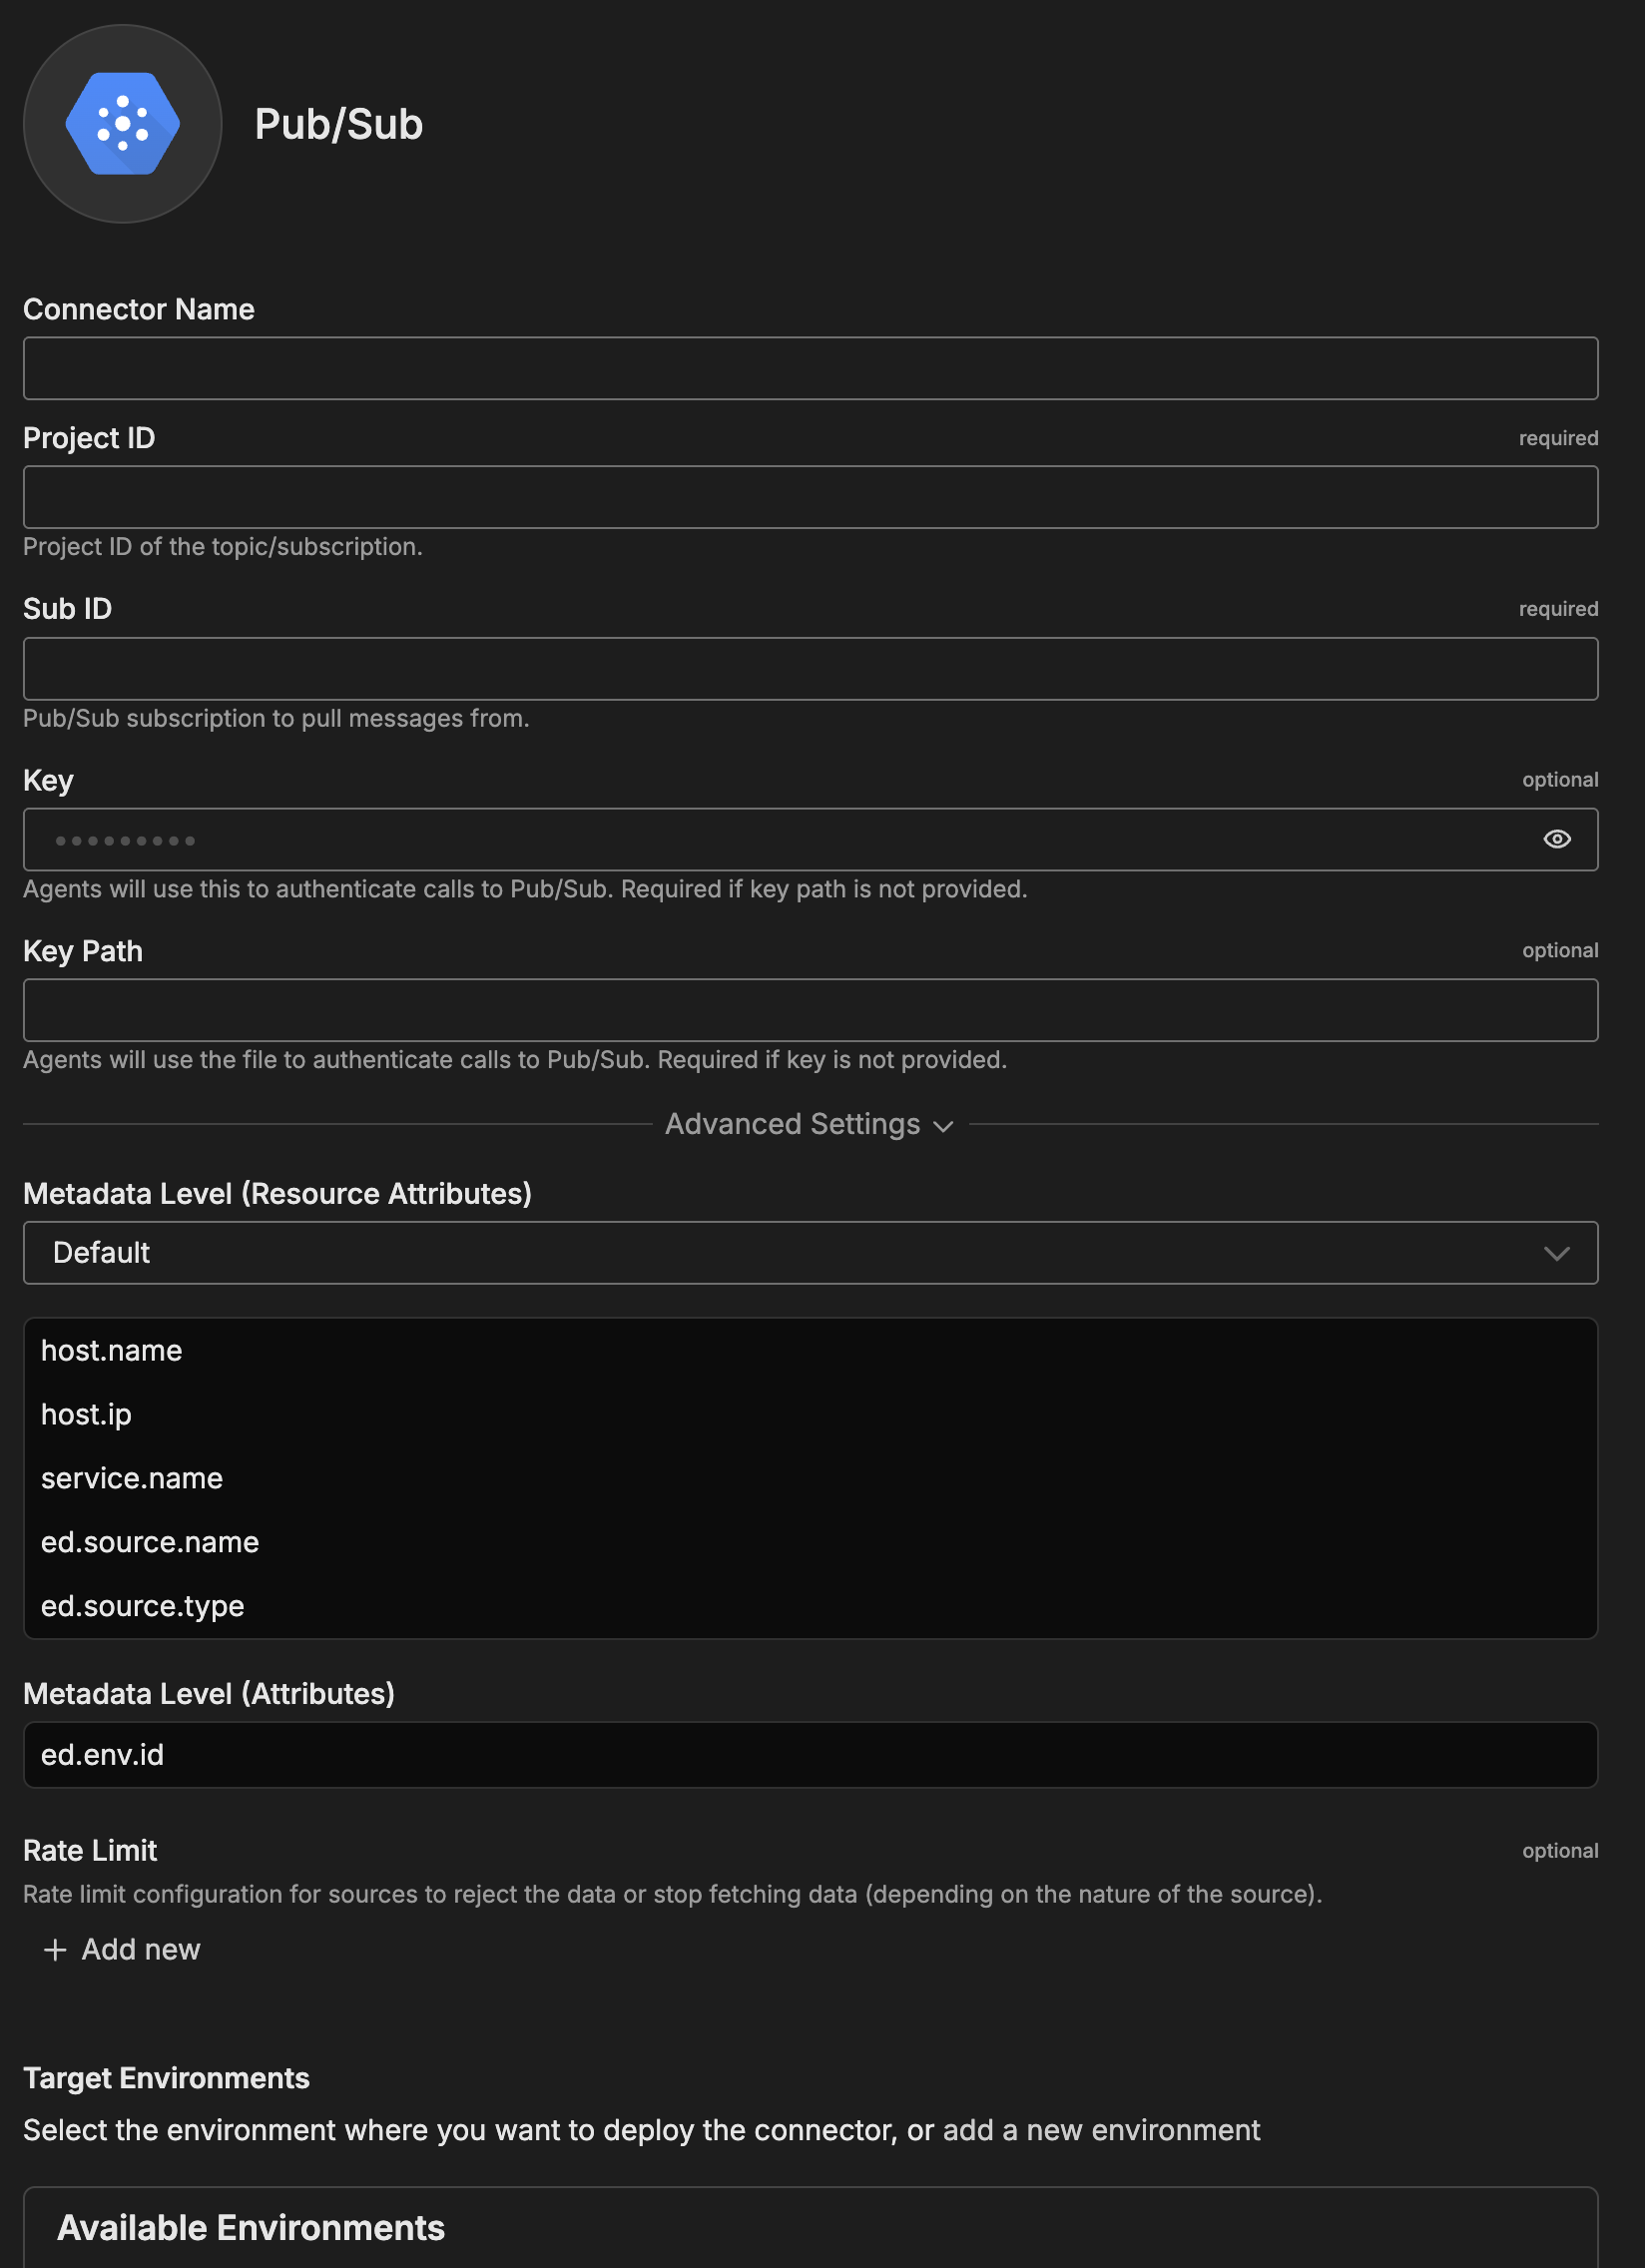
- Enter Project ID (GCP project identifier)
- Enter Sub ID (subscription name only, not full resource path)
- Paste complete service account JSON key into Key field
- Optionally configure Advanced Settings for metadata or rate limiting
- Select a target environment
- Click Save
The connector deploys and begins pulling messages from your subscription at the configured interval.
Configuration Options
Connector Name
Name to identify this Pub/Sub connector instance.
Project ID
GCP project identifier where the Pub/Sub subscription exists. This is the project ID (not project name or number) shown in GCP Console project selector.
Format: Valid GCP project ID (lowercase letters, numbers, hyphens)
Examples:
production-telemetry-12345my-gcp-project
Finding Project ID: GCP Console → Project selector dropdown → Copy Project ID column
Sub ID
Pub/Sub subscription name to pull messages from. Provide only subscription name, not full resource path.
Format: Valid subscription name (alphanumeric, hyphens, underscores, periods)
Examples:
edgedelta-logscloud-run-logs-subapp-logs-subscription
Verify subscription exists:
gcloud pubsub subscriptions describe SUBSCRIPTION_ID --project=PROJECT_ID
Key
Complete JSON key file content for GCP service account with Pub/Sub subscriber permissions. This field or Key Path is required.
Format: Complete valid JSON key file with required fields
Example:
{
  "type": "service_account",
  "project_id": "my-gcp-project",
  "private_key_id": "abc123...",
  "private_key": "-----BEGIN PRIVATE KEY-----\n...",
  "client_email": "edgedelta-pubsub@my-gcp-project.iam.gserviceaccount.com",
  "client_id": "123456789...",
  "auth_uri": "https://accounts.google.com/o/oauth2/auth",
  "token_uri": "https://oauth2.googleapis.com/token"
}
Security: Never commit keys to version control. Use secret management systems.
Key Path
Absolute file path to service account JSON key file on agent filesystem. This field or Key is required.
Format: Absolute file path
Example: /etc/edgedelta/gcp-key.json
When to Use:
- Key field: Secrets management systems inject credentials
- Key Path: File-based credential distribution
Advanced Settings
Metadata Level (Resource Attributes)
This option is used to define which detected resources and attributes to add to each data item as it is ingested by Edge Delta. You can select:
- Required Only: This option includes the minimum required resources and attributes for Edge Delta to operate.
- Default: This option includes the required resources and attributes plus those selected by Edge Delta
- High: This option includes the required resources and attributes along with a larger selection of common optional fields.
- Custom: With this option selected, you can choose which attributes and resources to include. The required fields are selected by default and can’t be unchecked.
Based on your selection in the GUI, the source_metadata YAML is populated as two dictionaries (resource_attributes and attributes) with Boolean values.
See Choose Data Item Metadata for more information on selecting metadata.
Pub/Sub-specific metadata included:
- Message ID - Unique message identifier
- Publish timestamp - When message was published
- Message attributes - Custom key-value pairs
- Subscription name - Source subscription
- Topic name - Originating topic
- Ordering key - For ordered delivery (if enabled)
Metadata Level (Attributes)
Additional attribute-level metadata fields to include.
Default: ed.env.id
Rate Limit
The rate_limit parameter enables you to control data ingestion based on system resource usage. This advanced setting helps prevent source nodes from overwhelming the agent by automatically throttling or stopping data collection when CPU or memory thresholds are exceeded.
Use rate limiting to prevent runaway log collection from overwhelming the agent in high-volume sources, protect agent stability in resource-constrained environments with limited CPU/memory, automatically throttle during bursty traffic patterns, and ensure fair resource allocation across source nodes in multi-tenant deployments.
When rate limiting triggers, pull-based sources (File, S3, HTTP Pull) stop fetching new data, push-based sources (HTTP, TCP, UDP, OTLP) reject incoming data, and stream-based sources (Kafka, Pub/Sub) pause consumption. Rate limiting operates at the source node level, where each source with rate limiting enabled independently monitors and enforces its own thresholds.
Rate limiting vs backpressure: Rate limiting and backpressure are different mechanisms. Rate limiting controls data ingestion at the source based on CPU or memory thresholds. Backpressure controls data output at the destination when in-memory queues fill up. Backpressure logs such as
backpressure: dataCh at 92% capacitydo not appear when rate limiting triggers, and rate limiting logs do not appear during backpressure events.
Observability: When rate limiting is active in enforce mode, the agent does not produce INFO, WARN, or ERROR level logs. To confirm that rate limiting is triggering, check the source node’s Bytes I/O metrics in the Edge Delta app for gaps or drops that coincide with expected throttling periods.
Configuration Steps:
- Click Add New in the Rate Limit section
- Click Add New for Evaluation Policy
- Select Policy Type:
- CPU Usage: Monitors CPU consumption and rate limits when usage exceeds defined thresholds. Use for CPU-intensive sources like file parsing or complex transformations.
- Memory Usage: Monitors memory consumption and rate limits when usage exceeds defined thresholds. Use for memory-intensive sources like large message buffers or caching.
- AND (composite): Combines multiple sub-policies with AND logic. All sub-policies must be true simultaneously to trigger rate limiting. Use when you want conservative rate limiting (both CPU and memory must be high).
- OR (composite): Combines multiple sub-policies with OR logic. Any sub-policy can trigger rate limiting. Use when you want aggressive rate limiting (either CPU or memory being high triggers).
- Select Evaluation Mode. Choose how the policy behaves when thresholds are exceeded:
- Enforce (default): Actively applies rate limiting when thresholds are met. Pull-based sources (File, S3, HTTP Pull) stop fetching new data, push-based sources (HTTP, TCP, UDP, OTLP) reject incoming data, and stream-based sources (Kafka, Pub/Sub) pause consumption. Use in production to protect agent resources.
- Monitor: Logs when rate limiting would occur without actually limiting data flow. Use for testing thresholds before enforcing them in production.
- Passthrough: Disables rate limiting entirely while keeping the configuration in place. Use to temporarily disable rate limiting without removing configuration.
- Set Absolute Limits and Relative Limits (for CPU Usage and Memory Usage policies)
Note: If you specify both absolute and relative limits, the system evaluates both conditions and rate limiting triggers when either condition is met (OR logic). For example, if you set absolute limit to
1.0CPU cores and relative limit to50%, rate limiting triggers when the source uses either 1 full core OR 50% of available CPU, whichever happens first.
For CPU Absolute Limits: Enter value in full core units:
0.1= one-tenth of a CPU core0.5= half a CPU core1.0= one full CPU core2.0= two full CPU cores
For CPU Relative Limits: Enter percentage of total available CPU (0-100):
50= 50% of available CPU75= 75% of available CPU85= 85% of available CPU
For Memory Absolute Limits: Enter value in bytes
104857600= 100Mi (100 × 1024 × 1024)536870912= 512Mi (512 × 1024 × 1024)1073741824= 1Gi (1 × 1024 × 1024 × 1024)
For Memory Relative Limits: Enter percentage of total available memory (0-100)
60= 60% of available memory75= 75% of available memory80= 80% of available memory
- Set Refresh Interval (for CPU Usage and Memory Usage policies). Specify how frequently the system checks resource usage:
- Recommended Values:
10sto30sfor most use cases5sto10sfor high-volume sources requiring quick response1mor higher for stable, low-volume sources
The system fetches current CPU/memory usage at the specified refresh interval and uses that value for evaluation until the next refresh. Shorter intervals provide more responsive rate limiting but incur slightly higher overhead, while longer intervals are more efficient but slower to react to sudden resource spikes.
The GUI generates YAML as follows:
# Simple CPU-based rate limiting
nodes:
  - name: <node name>
    type: <node type>
    rate_limit:
      evaluation_policy:
        policy_type: cpu_usage
        evaluation_mode: enforce
        absolute_limit: 0.5  # Limit to half a CPU core
        refresh_interval: 10s
# Simple memory-based rate limiting
nodes:
  - name: <node name>
    type: <node type>
    rate_limit:
      evaluation_policy:
        policy_type: memory_usage
        evaluation_mode: enforce
        absolute_limit: 536870912  # 512Mi in bytes
        refresh_interval: 30s
Composite Policies (AND / OR)
When using AND or OR policy types, you define sub-policies instead of limits. Sub-policies must be siblings (at the same level)—do not nest sub-policies within other sub-policies. Each sub-policy is independently evaluated, and the parent policy’s evaluation mode applies to the composite result.
- AND Logic: All sub-policies must evaluate to true at the same time to trigger rate limiting. Use when you want conservative rate limiting (limit only when CPU AND memory are both high).
- OR Logic: Any sub-policy evaluating to true triggers rate limiting. Use when you want aggressive protection (limit when either CPU OR memory is high).
Configuration Steps:
- Select AND (composite) or OR (composite) as the Policy Type
- Choose the Evaluation Mode (typically Enforce)
- Click Add New under Sub-Policies to add the first condition
- Configure the first sub-policy by selecting policy type (CPU Usage or Memory Usage), selecting evaluation mode, setting absolute and/or relative limits, and setting refresh interval
- In the parent policy (not within the child), click Add New again to add a sibling sub-policy
- Configure additional sub-policies following the same pattern
The GUI generates YAML as follows:
# AND composite policy - both CPU AND memory must exceed limits
nodes:
  - name: <node name>
    type: <node type>
    rate_limit:
      evaluation_policy:
        policy_type: and
        evaluation_mode: enforce
        sub_policies:
          # First sub-policy (sibling)
          - policy_type: cpu_usage
            evaluation_mode: enforce
            absolute_limit: 0.75  # Limit to 75% of one core
            refresh_interval: 15s
          # Second sub-policy (sibling)
          - policy_type: memory_usage
            evaluation_mode: enforce
            absolute_limit: 1073741824  # 1Gi in bytes
            refresh_interval: 15s
# OR composite policy - either CPU OR memory can trigger
nodes:
  - name: <node name>
    type: <node type>
    rate_limit:
      evaluation_policy:
        policy_type: or
        evaluation_mode: enforce
        sub_policies:
          - policy_type: cpu_usage
            evaluation_mode: enforce
            relative_limit: 85  # 85% of available CPU
            refresh_interval: 20s
          - policy_type: memory_usage
            evaluation_mode: enforce
            relative_limit: 80  # 80% of available memory
            refresh_interval: 20s
# Monitor mode for testing thresholds
nodes:
  - name: <node name>
    type: <node type>
    rate_limit:
      evaluation_policy:
        policy_type: memory_usage
        evaluation_mode: monitor  # Only logs, doesn't limit
        relative_limit: 70  # Test at 70% before enforcing
        refresh_interval: 30s
How to Use the Pub/Sub Connector
The Pub/Sub connector integrates seamlessly with AI Team, enabling AI-powered analysis of Google Cloud Platform logs and events. AI teammates automatically leverage streaming message data to troubleshoot issues, monitor service health, and analyze event flows.
Use Case: Cloud Run Application Error Analysis
Analyze errors across Cloud Run microservices by streaming Cloud Run logs from Pub/Sub. AI teammates identify error patterns, determine critical issues, and provide recommendations. When combined with PagerDuty alerts, teammates automatically investigate error spikes by querying recent Cloud Run logs and identifying root causes.
Configuration: Create Cloud Logging sink routing Cloud Run logs to Pub/Sub topic, configure connector with Project ID: production-gcp, Sub ID: edgedelta-cloudrun, service account key
Use Case: GKE Cluster Monitoring
Monitor Kubernetes workloads by streaming GKE container logs through Pub/Sub. AI teammates provide namespace-level error analysis, identify problematic pods, and detect failures before production impact. This is valuable when managing multi-namespace clusters—teammates categorize errors, detect patterns, and prioritize remediation.
Configuration: Create Cloud Logging sink for GKE cluster, configure connector with Project ID: production-gcp, Sub ID: edgedelta-gke
Use Case: Cloud Functions Timeout Investigation
Identify Cloud Functions experiencing timeouts by streaming function execution logs. AI teammates analyze patterns, suggest configuration improvements, and track resource utilization. When integrated with Jira, teammates automatically document timeout causes by querying function logs and creating tickets with diagnostic details.
Configuration: Create Cloud Logging sink for Cloud Functions, configure connector with Project ID: serverless-project, Sub ID: edgedelta-functions
Troubleshooting
No messages appearing: Verify service account has roles/pubsub.subscriber role (gcloud projects get-iam-policy PROJECT_ID). Check subscription exists (gcloud pubsub subscriptions describe SUB_ID). Verify messages being published to topic (check GCP Console metrics). Review Edge Delta agent logs for authentication errors.
Permission denied errors: Ensure service account key is valid JSON with required fields. Verify Project ID matches project where service account was created. Check IAM bindings at project and subscription levels. Test credentials: gcloud auth activate-service-account --key-file=key.json.
Subscription not found: Provide only subscription name in Sub ID field, not full resource path projects/*/subscriptions/*. Verify subscription in correct project. Check for trailing spaces or special characters in subscription name.
Growing subscription backlog: Increase acknowledgment deadline in subscription (gcloud pubsub subscriptions update SUB_ID --ack-deadline=120). Check Edge Delta pipeline processing time doesn’t exceed acknowledgment deadline. Review pipeline logs for processing errors preventing acknowledgment. Scale horizontally by deploying to multiple environments.
Duplicate messages: Pub/Sub provides at-least-once delivery, duplicates are normal. Implement deduplication using message ID in Edge Delta pipeline. Ensure acknowledgment deadline sufficient for processing. Consider Pub/Sub exactly-once delivery (preview) for strict deduplication.
Messages garbled: Pub/Sub messages are Base64-encoded. Edge Delta should decode automatically—if not, check pipeline configuration. For JSON messages, add JSON parser processor. For Cloud Logging format, use appropriate parsers.
Configuration changes not taking effect: Verify clicked “Save” after changes. Confirm correct target environment selected. Check agent logs for configuration updates. Restart agents if needed.
After key rotation connector stopped: Update connector configuration with new service account key JSON. Save and redeploy. Revoke old key in GCP after confirming new key works.
Next Steps
- Learn about Edge Delta MCP connector for querying Pub/Sub data
- Explore Kubernetes Logs connector for GKE pod logs
- Learn about creating custom teammates that can use Pub/Sub data
For additional help, visit AI Team Support.