Quickstart: Create a Dashboard
less than a minute
Overview
This guide helps you quickly create a dashboard to view performance of your pipelines. In this instance, a dashboard showing the ratio of warning, error and fatal logs is created.
Prerequisites
- You have created a pipeline with the Telemetry Generator node described in Pipeline Quickstart Overview.
Steps
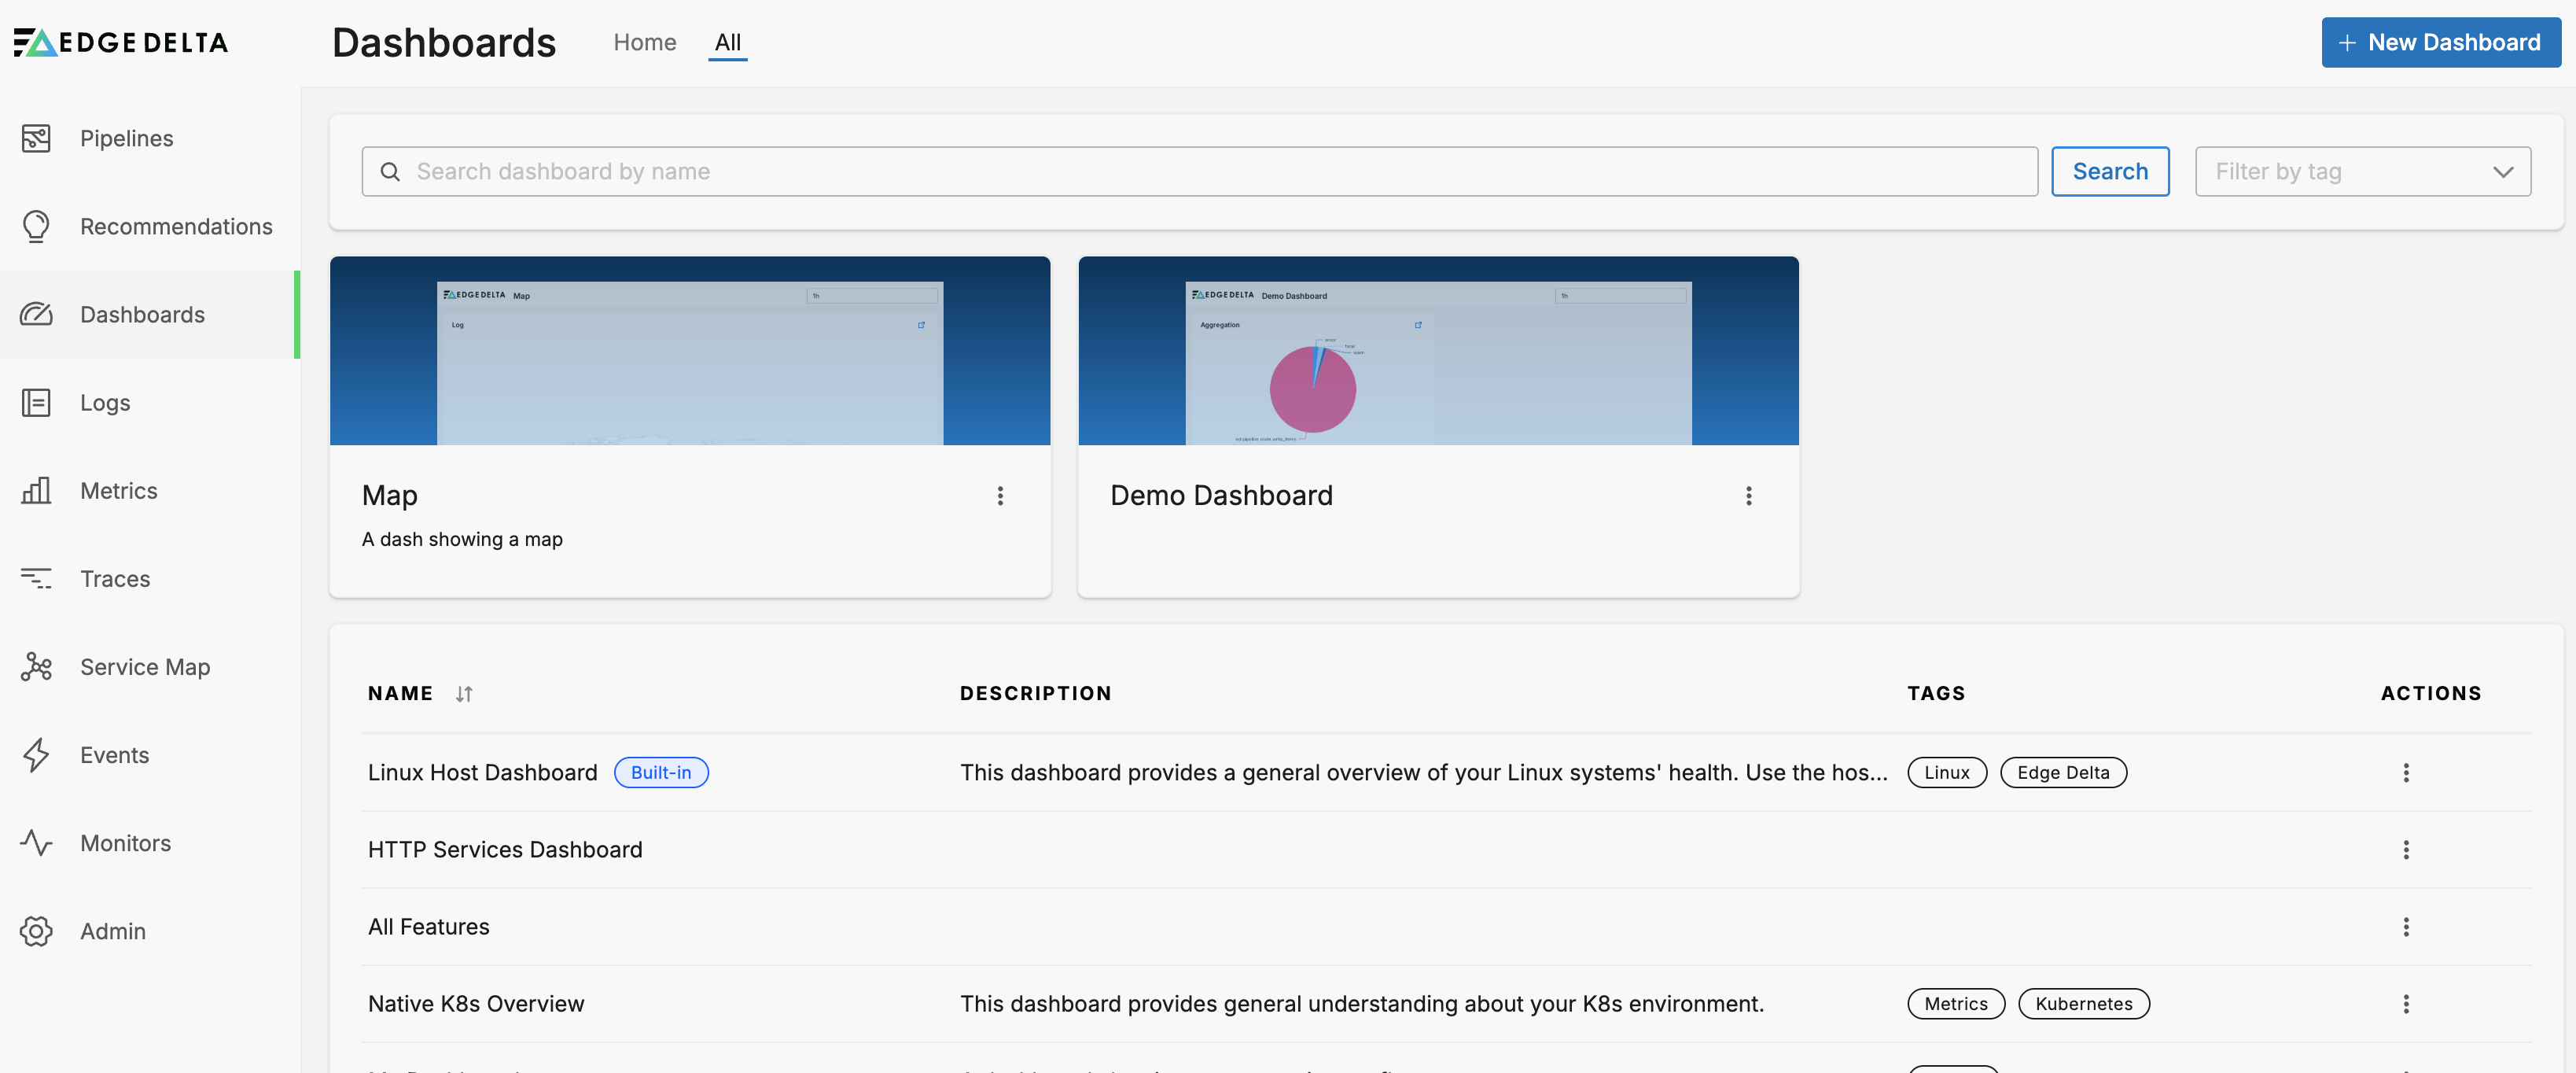
Click Dashboards then click New Dashboard:
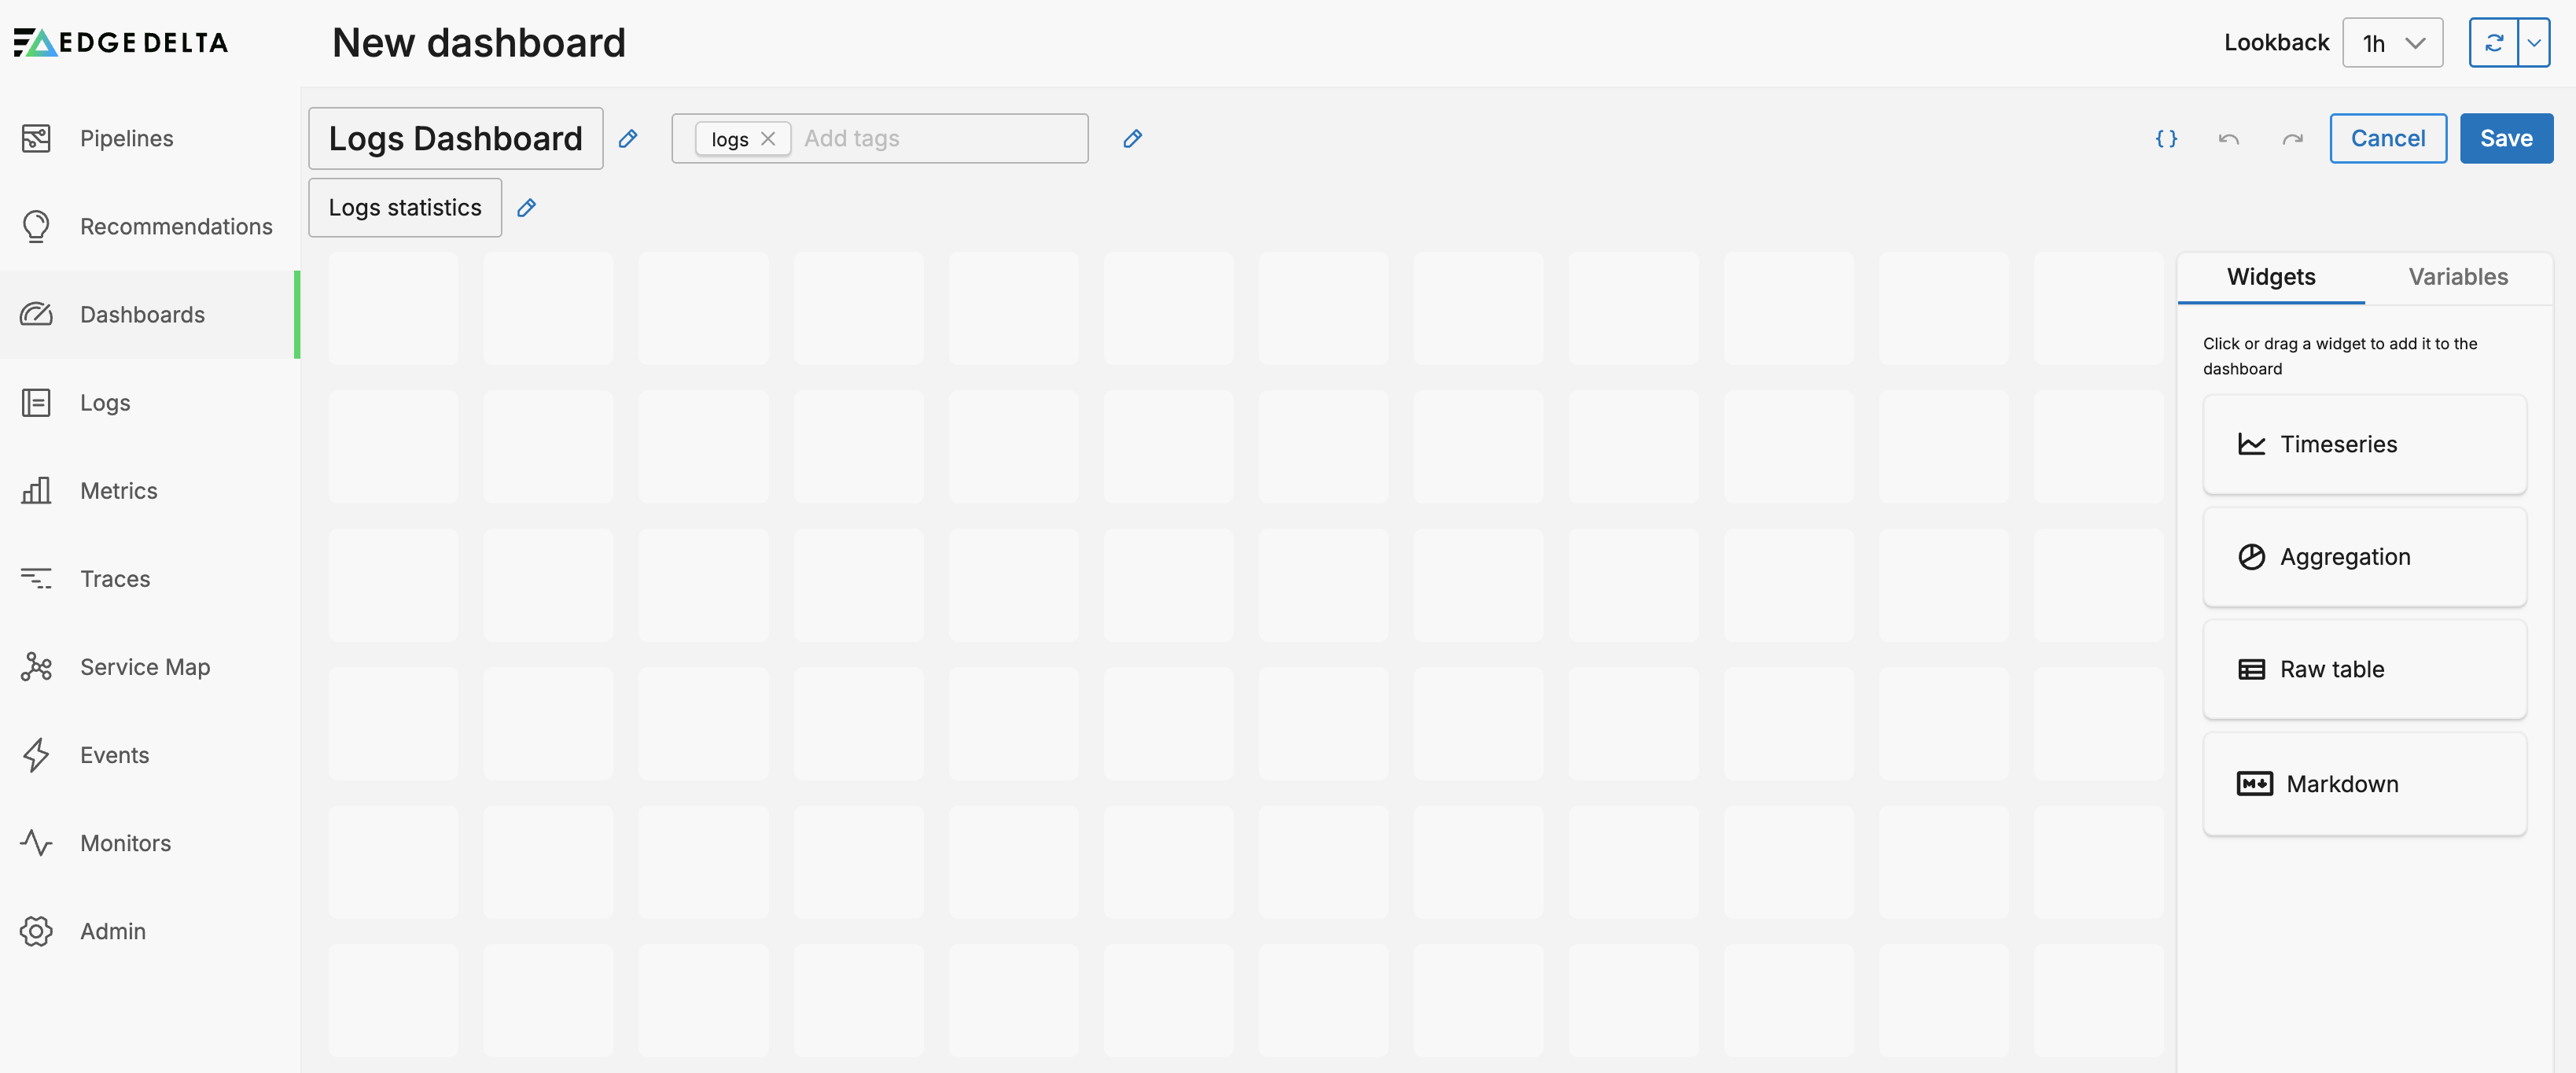
You can edit the dashboard name, description and tags:
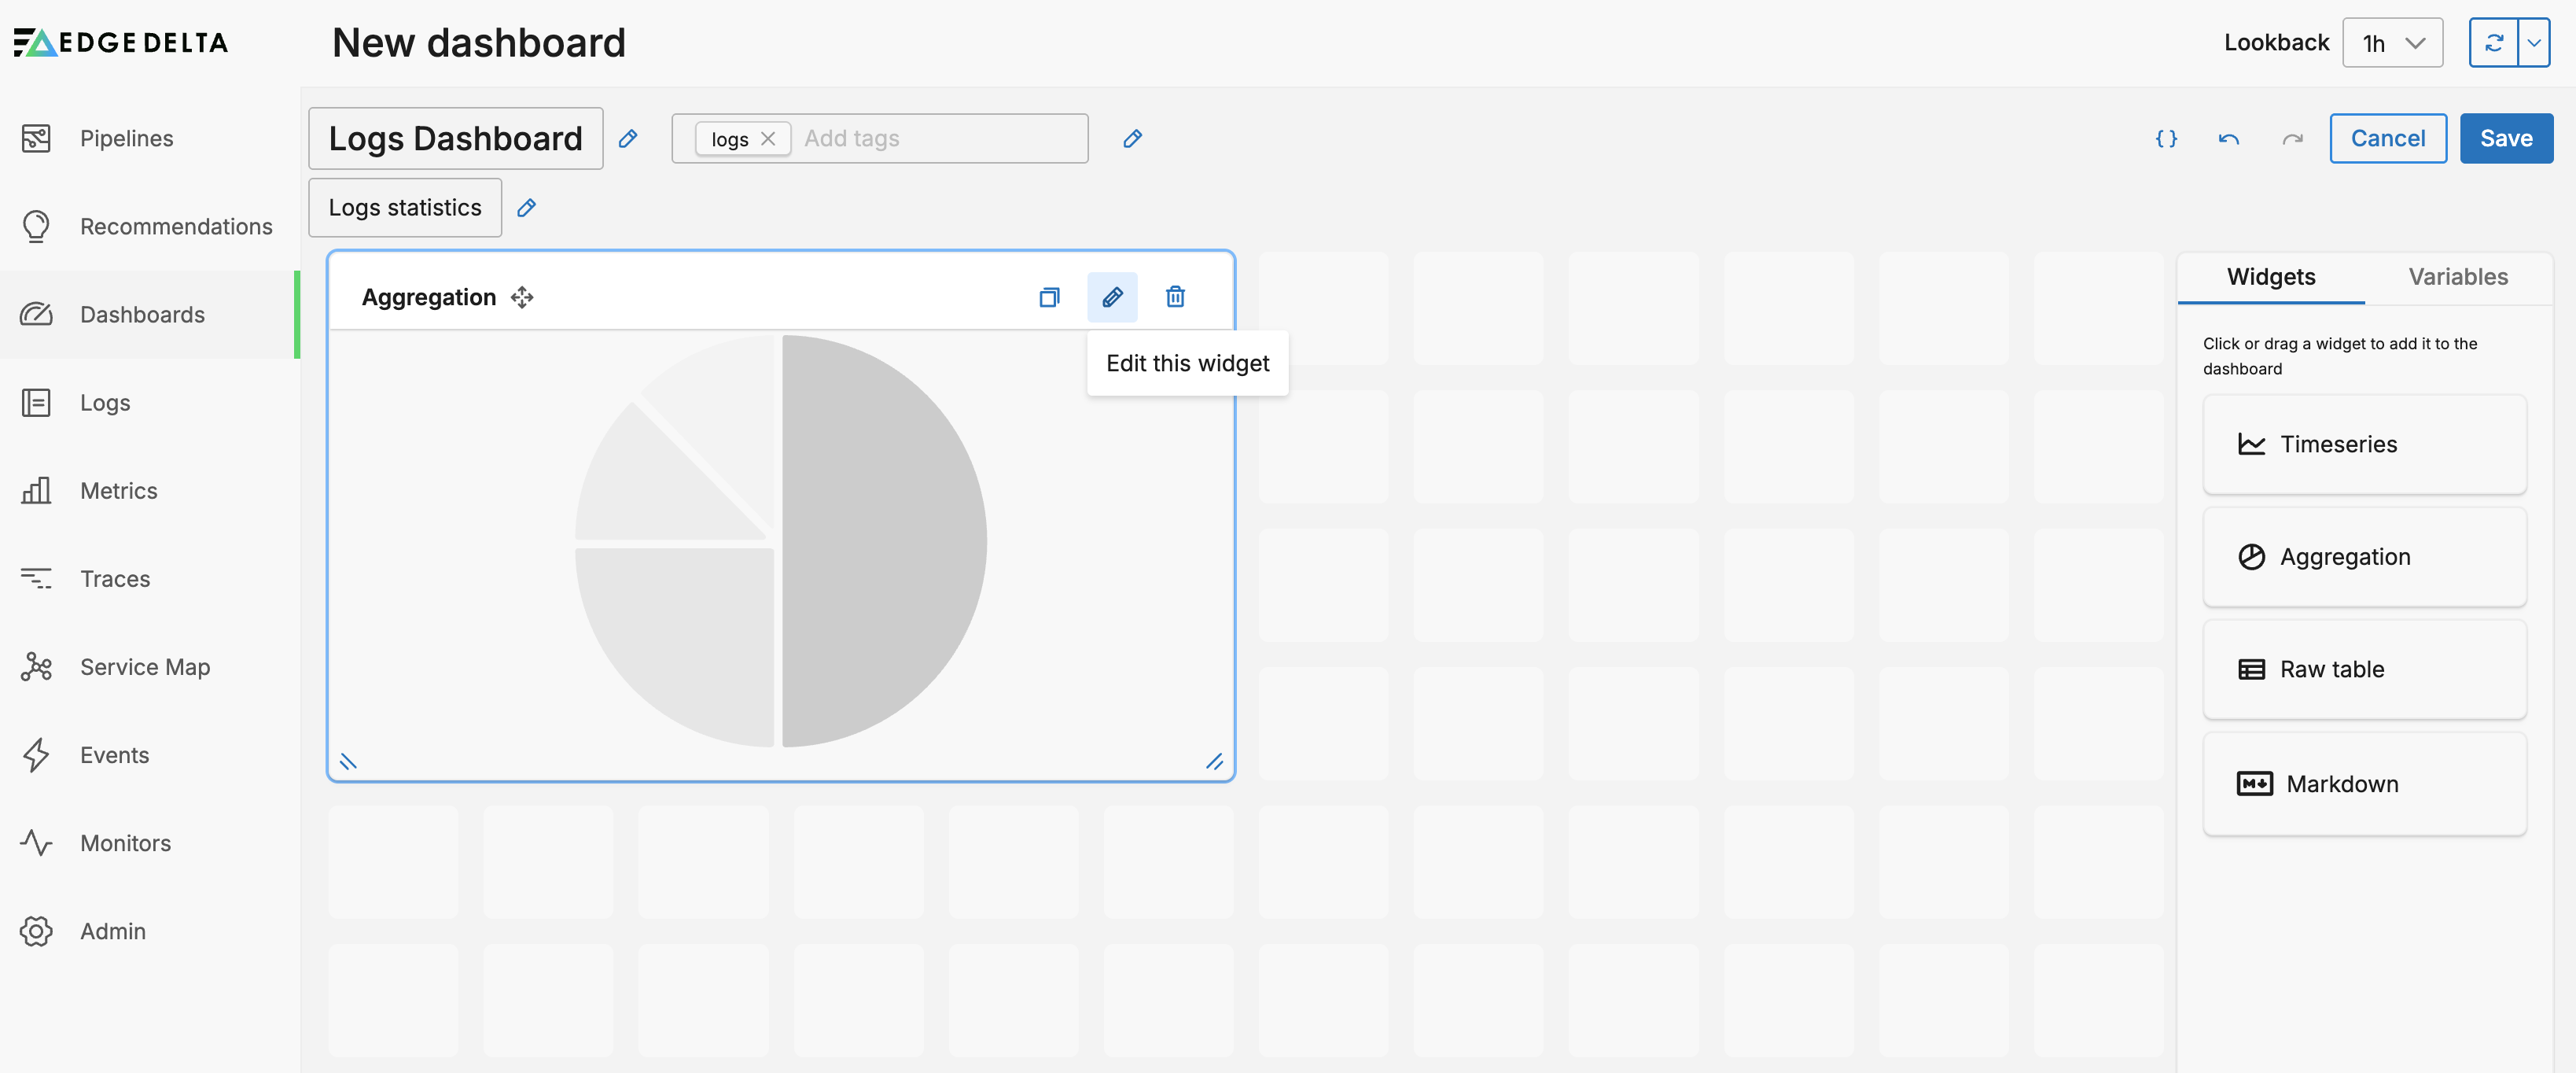
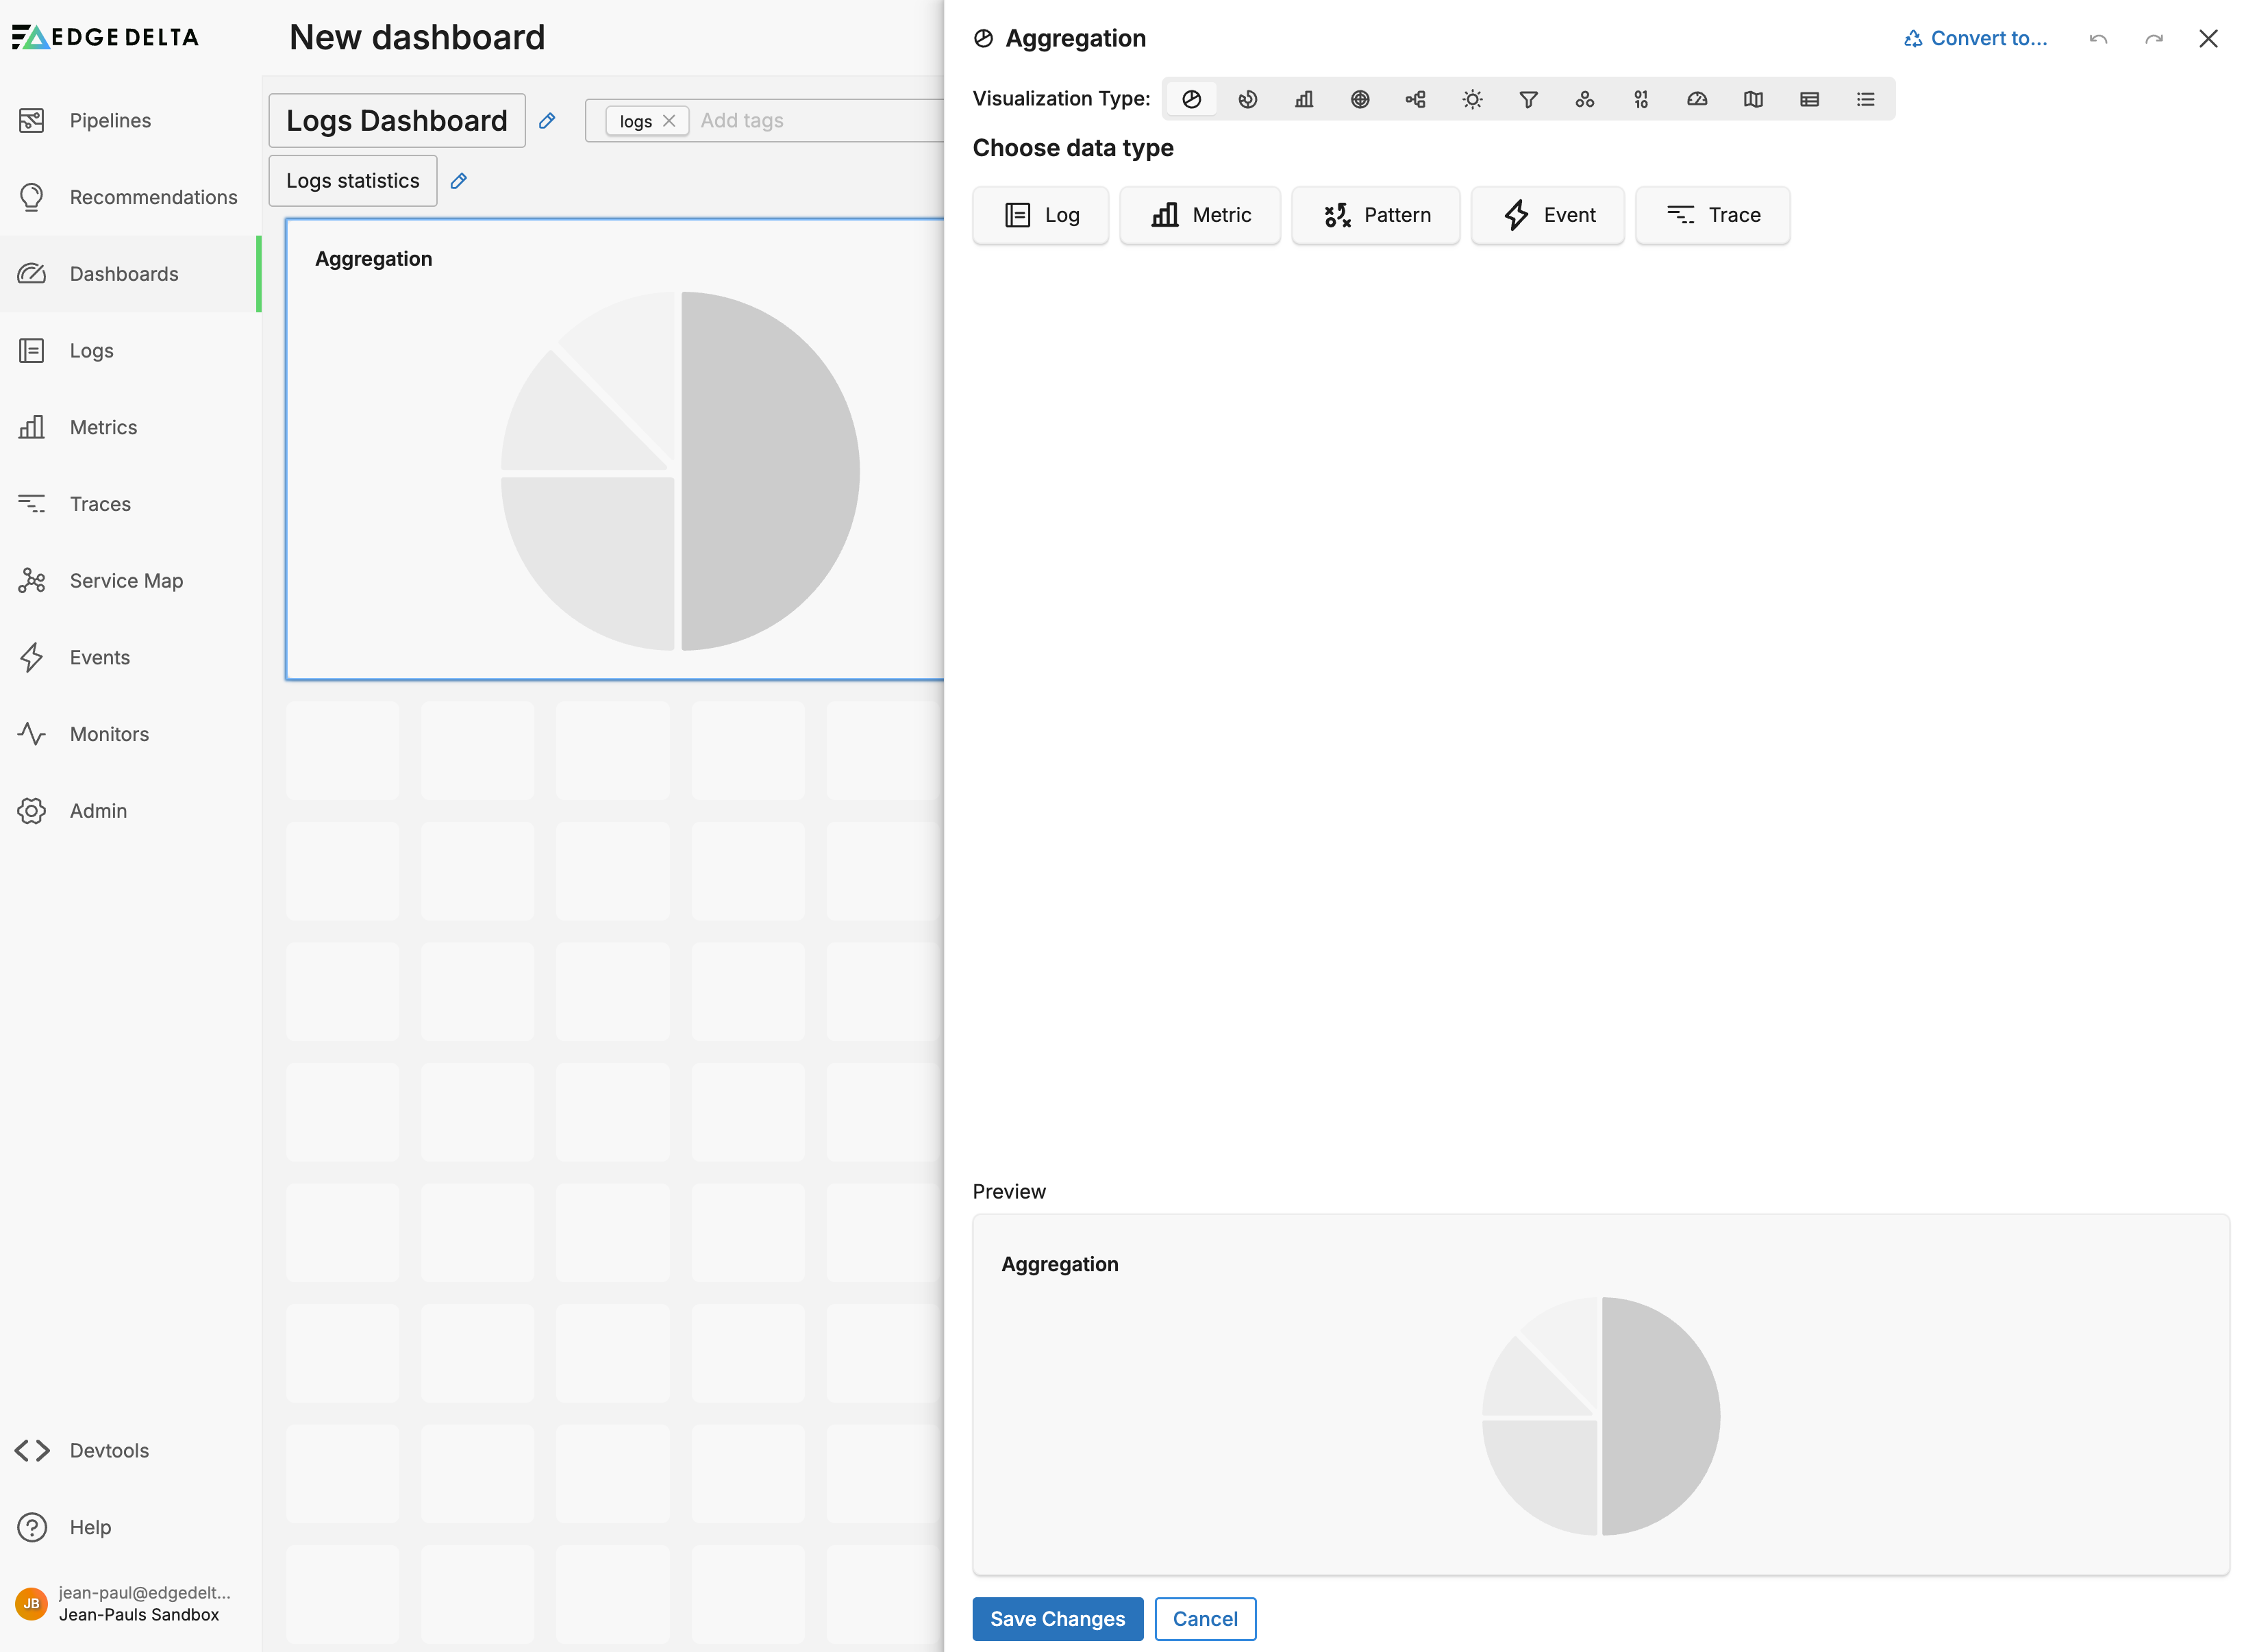
Next, drag an aggregation Widget onto the dashboard and click the Edit this widget button:
In this instance, we will want to visualize logs, so you select the Log data type:
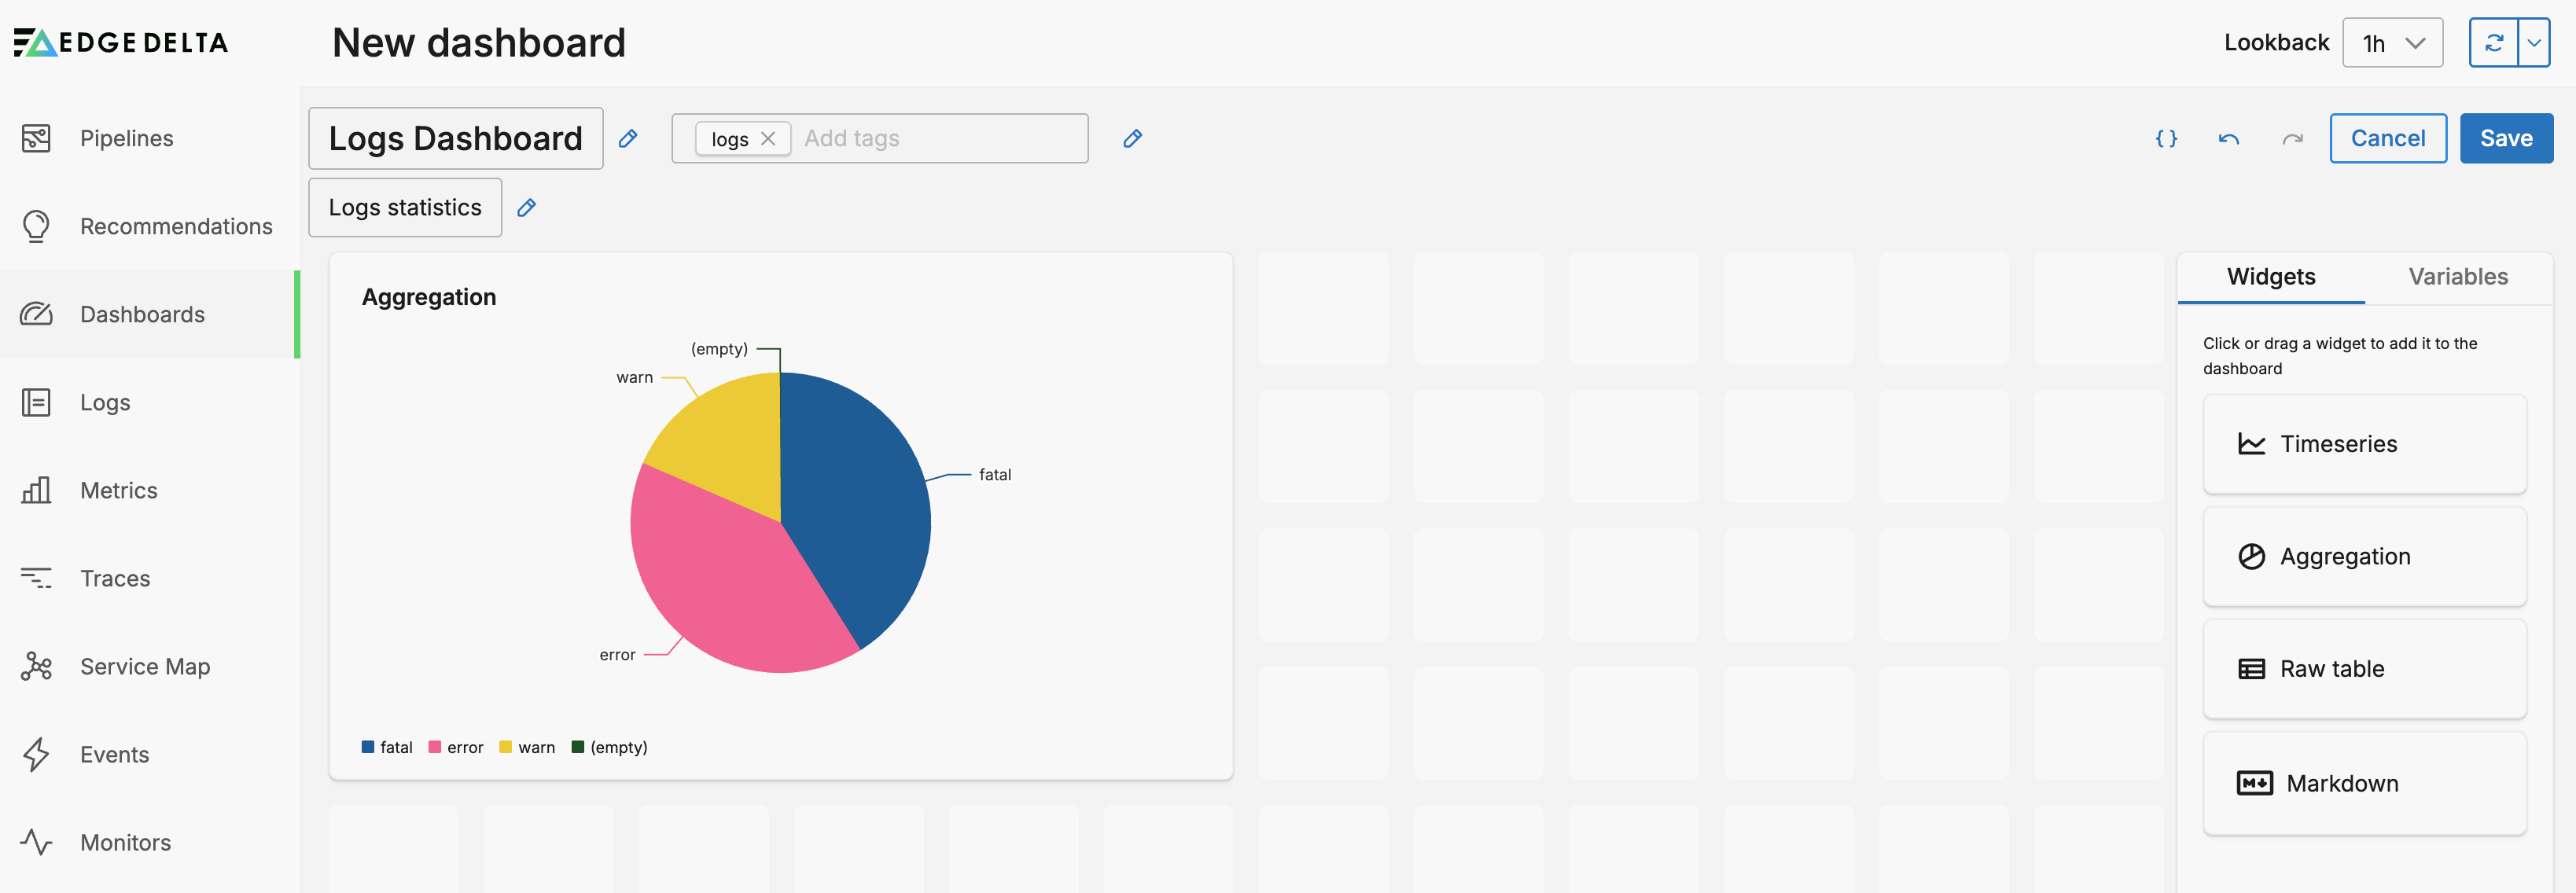
Use the Query field with auto-complete or select the logs you want to chart using the Filters pane. In this instance, you choose a specific Telemetry Generator node using the Service filter, and you select severity_text as a Group by dimension.
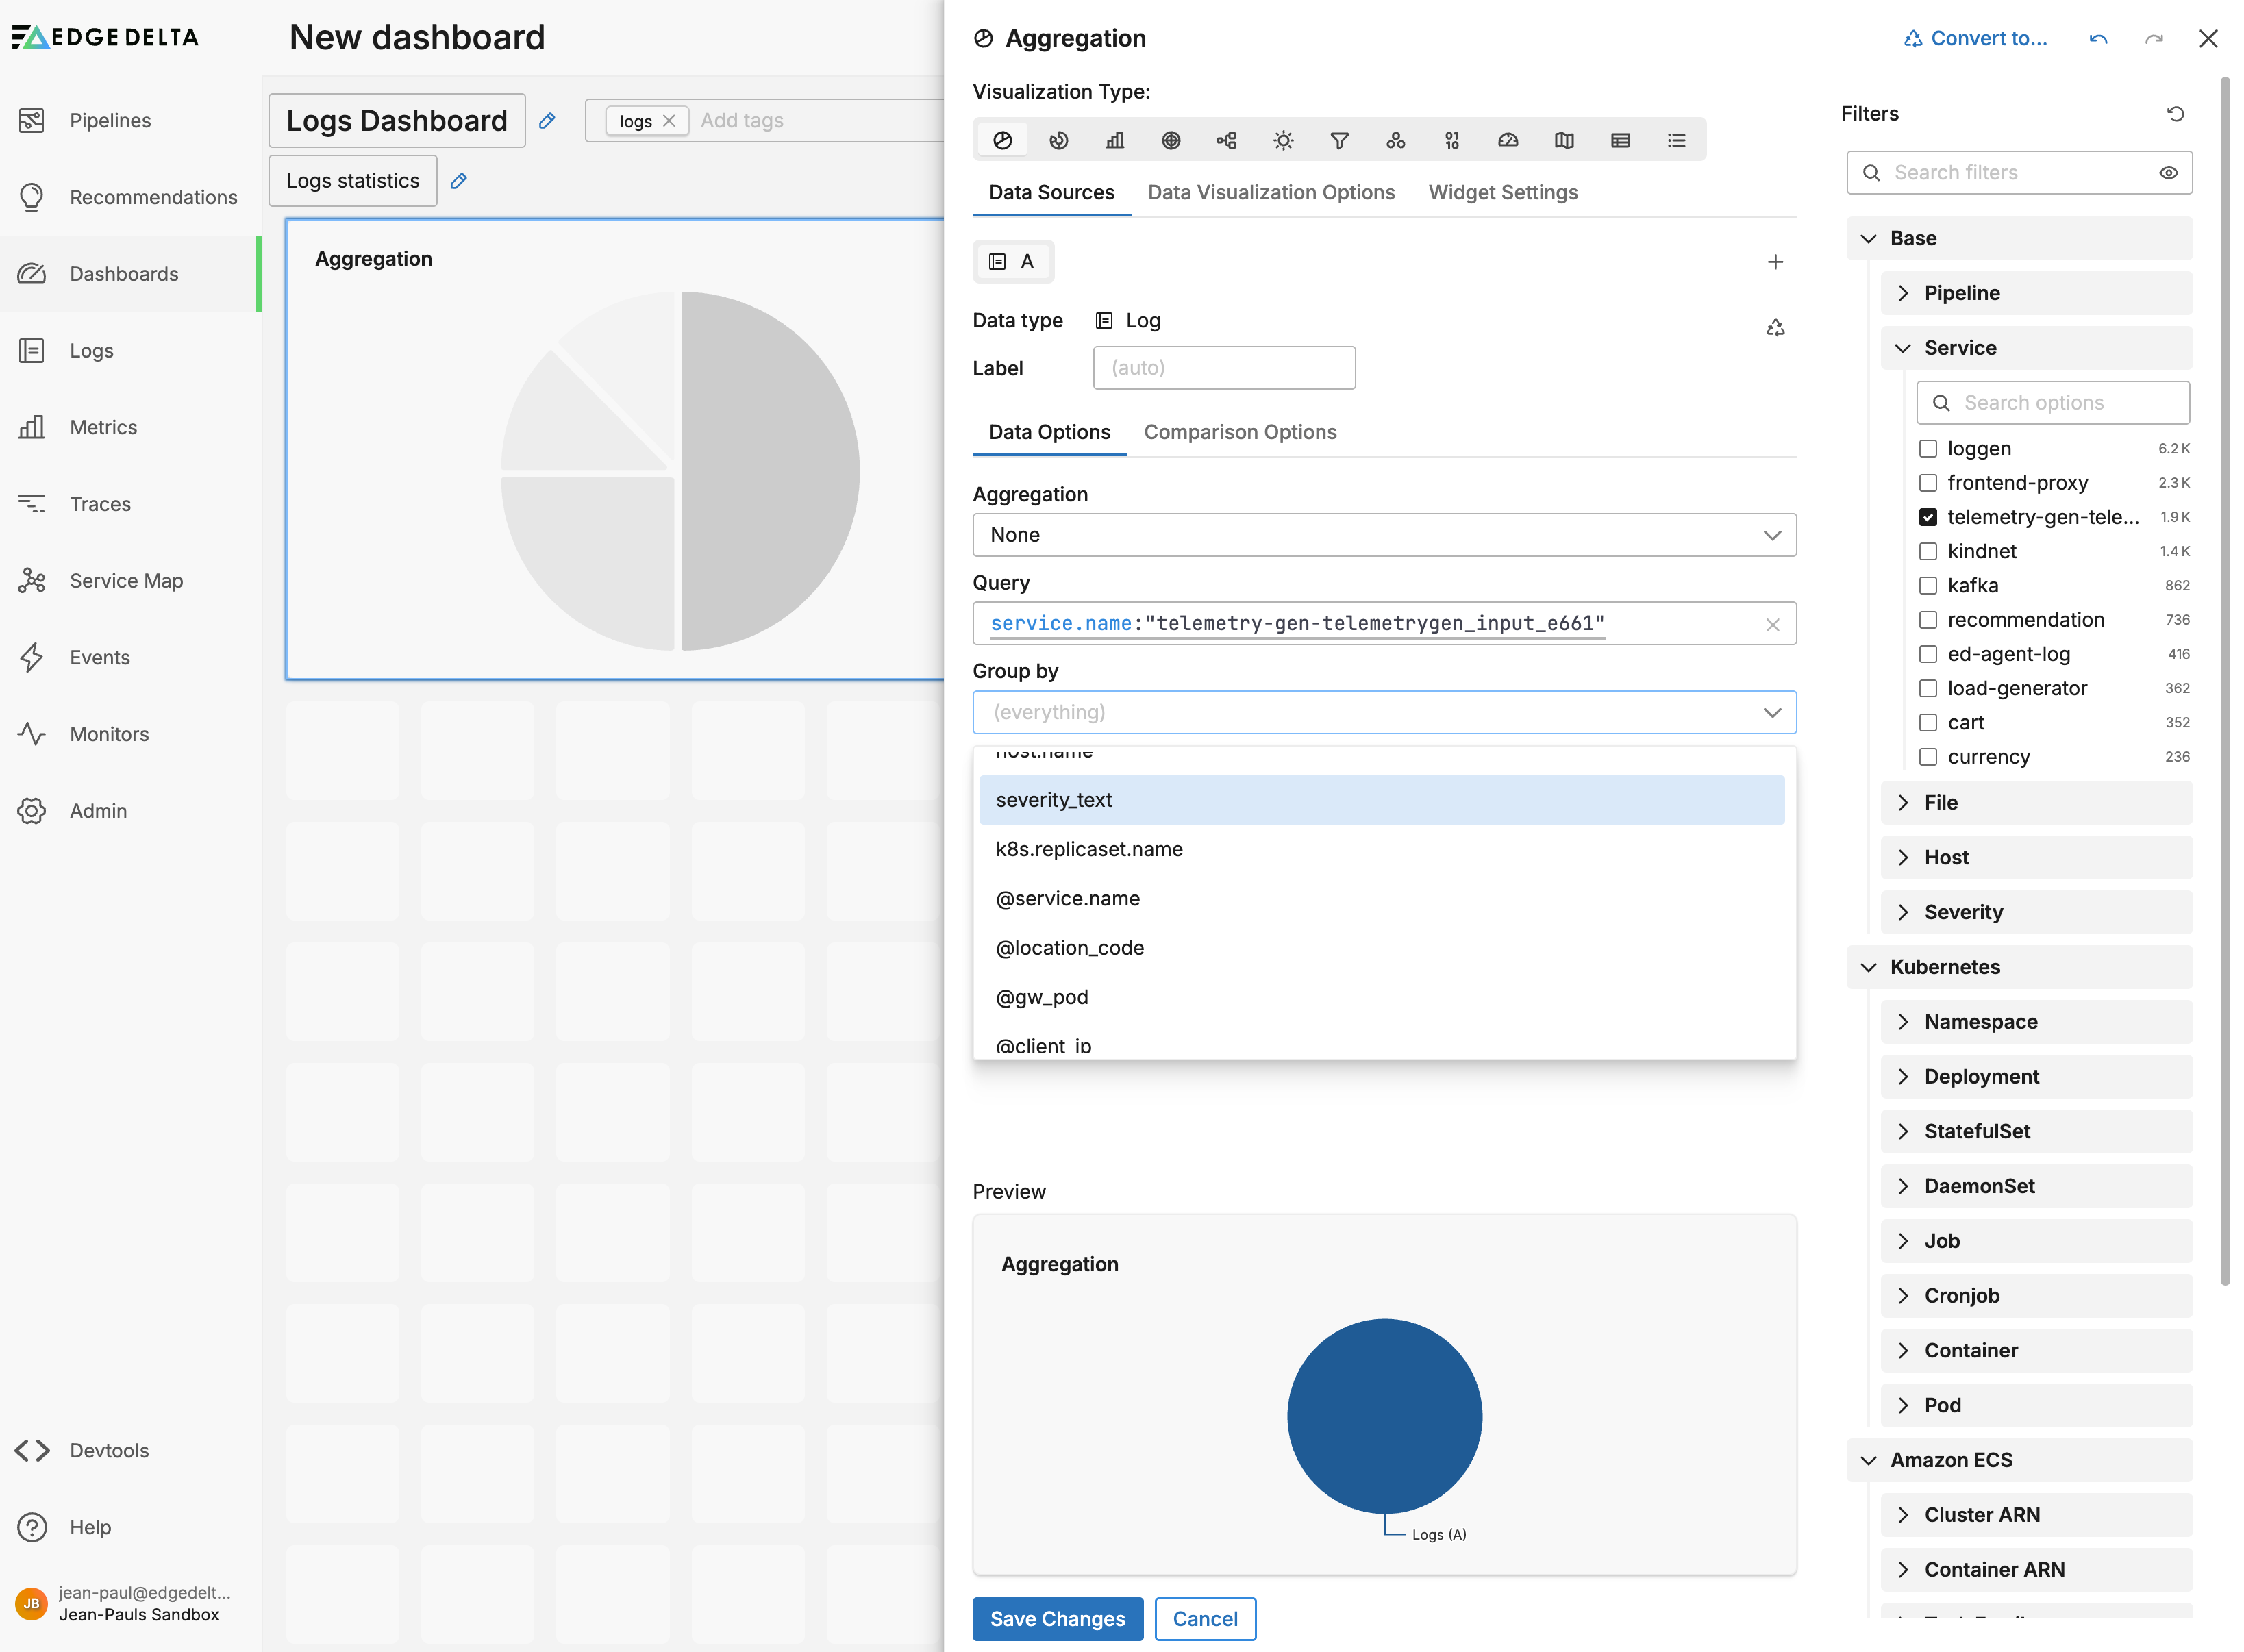
Then you click Save Changes. The dashboard now has a widget showing the ratio of logs with various severity_text values. You click Save to save the dashboard itself.