Edge Delta Rollup Metric Processor
11 minute read
Overview
The rollup metric processor aggregates and rolls up metric data into higher-level summaries without grouping dimensions. It is technically an Aggregate Metric processor configured without the group_by field. This produces a single aggregated value for all matching metrics within each batching interval, simplifying metric views and reducing data volume while maintaining essential statistical information.
The rollup metric processor is ideal for:
- Creating summary metrics from detailed telemetry
- Calculating overall statistics (median, mean, sum) across all data points
- Reducing metric cardinality by not grouping by dimensions
- Pre-aggregating metrics before sending to destinations
Use the configuration wizard below to generate a starter YAML configuration.
Rollup Metric vs Aggregate Metric
The Edge Delta platform offers two ways to aggregate metrics:
Rollup Metric Processor: Aggregates metrics without grouping dimensions, producing a single summary value for all matching metrics in each interval. Use this when you need overall statistics like “total requests across all endpoints” or “median response time for the entire system.”
Aggregate Metric Processor: Aggregates metrics with grouping dimensions using the
group_byfield, producing separate metrics for each unique dimension value. Use this when you need dimensional breakdowns like “requests per status code” or “response time by endpoint.”
Choose the rollup metric processor for simplified, single-value summaries. Choose the aggregate metric processor when you need to maintain visibility into different dimensions of your data.
Example Configuration
You configure the rollup metric processor with rules that define how metrics should be aggregated. Each rule specifies:
- A metric name for the output
- The aggregation type (count, sum, mean, etc.)
- A batching interval
- An optional condition to filter which metrics to process
Example Input
Suppose the following metrics are sent to the rollup metric processor. Each one is a metric extracted from a single log.
11:44:23 AM attributes_response_time = 367
11:44:21 AM attributes_response_time = 248
11:44:19 AM attributes_response_time = 282
11:44:17 AM attributes_response_time = 216
11:44:15 AM attributes_response_time = 215
11:44:13 AM attributes_response_time = 313
11:44:11 AM attributes_response_time = 224
11:44:09 AM attributes_response_time = 453
11:44:07 AM attributes_response_time = 223
11:44:05 AM attributes_response_time = 451
11:44:03 AM attributes_response_time = 492
11:44:01 AM attributes_response_time = 489
Here is the full data item for the first metric:
{
  "_type": "metric",
  "timestamp": 1755051262810,
  "resource": {
...
  },
  "attributes": {
    "method": "GET",
    "path": "/api/metrics",
    "response_time": 367,
    "status_code": "200",
    "status_code_int": 200,
    "timestamp": "2025-08-13T02:14:22+00:00"
  },
  "gauge": {
    "value": 367
  },
  "kind": "gauge",
  "name": "attributes_response_time",
  "unit": "1",
  "_stat_type": "value"
}
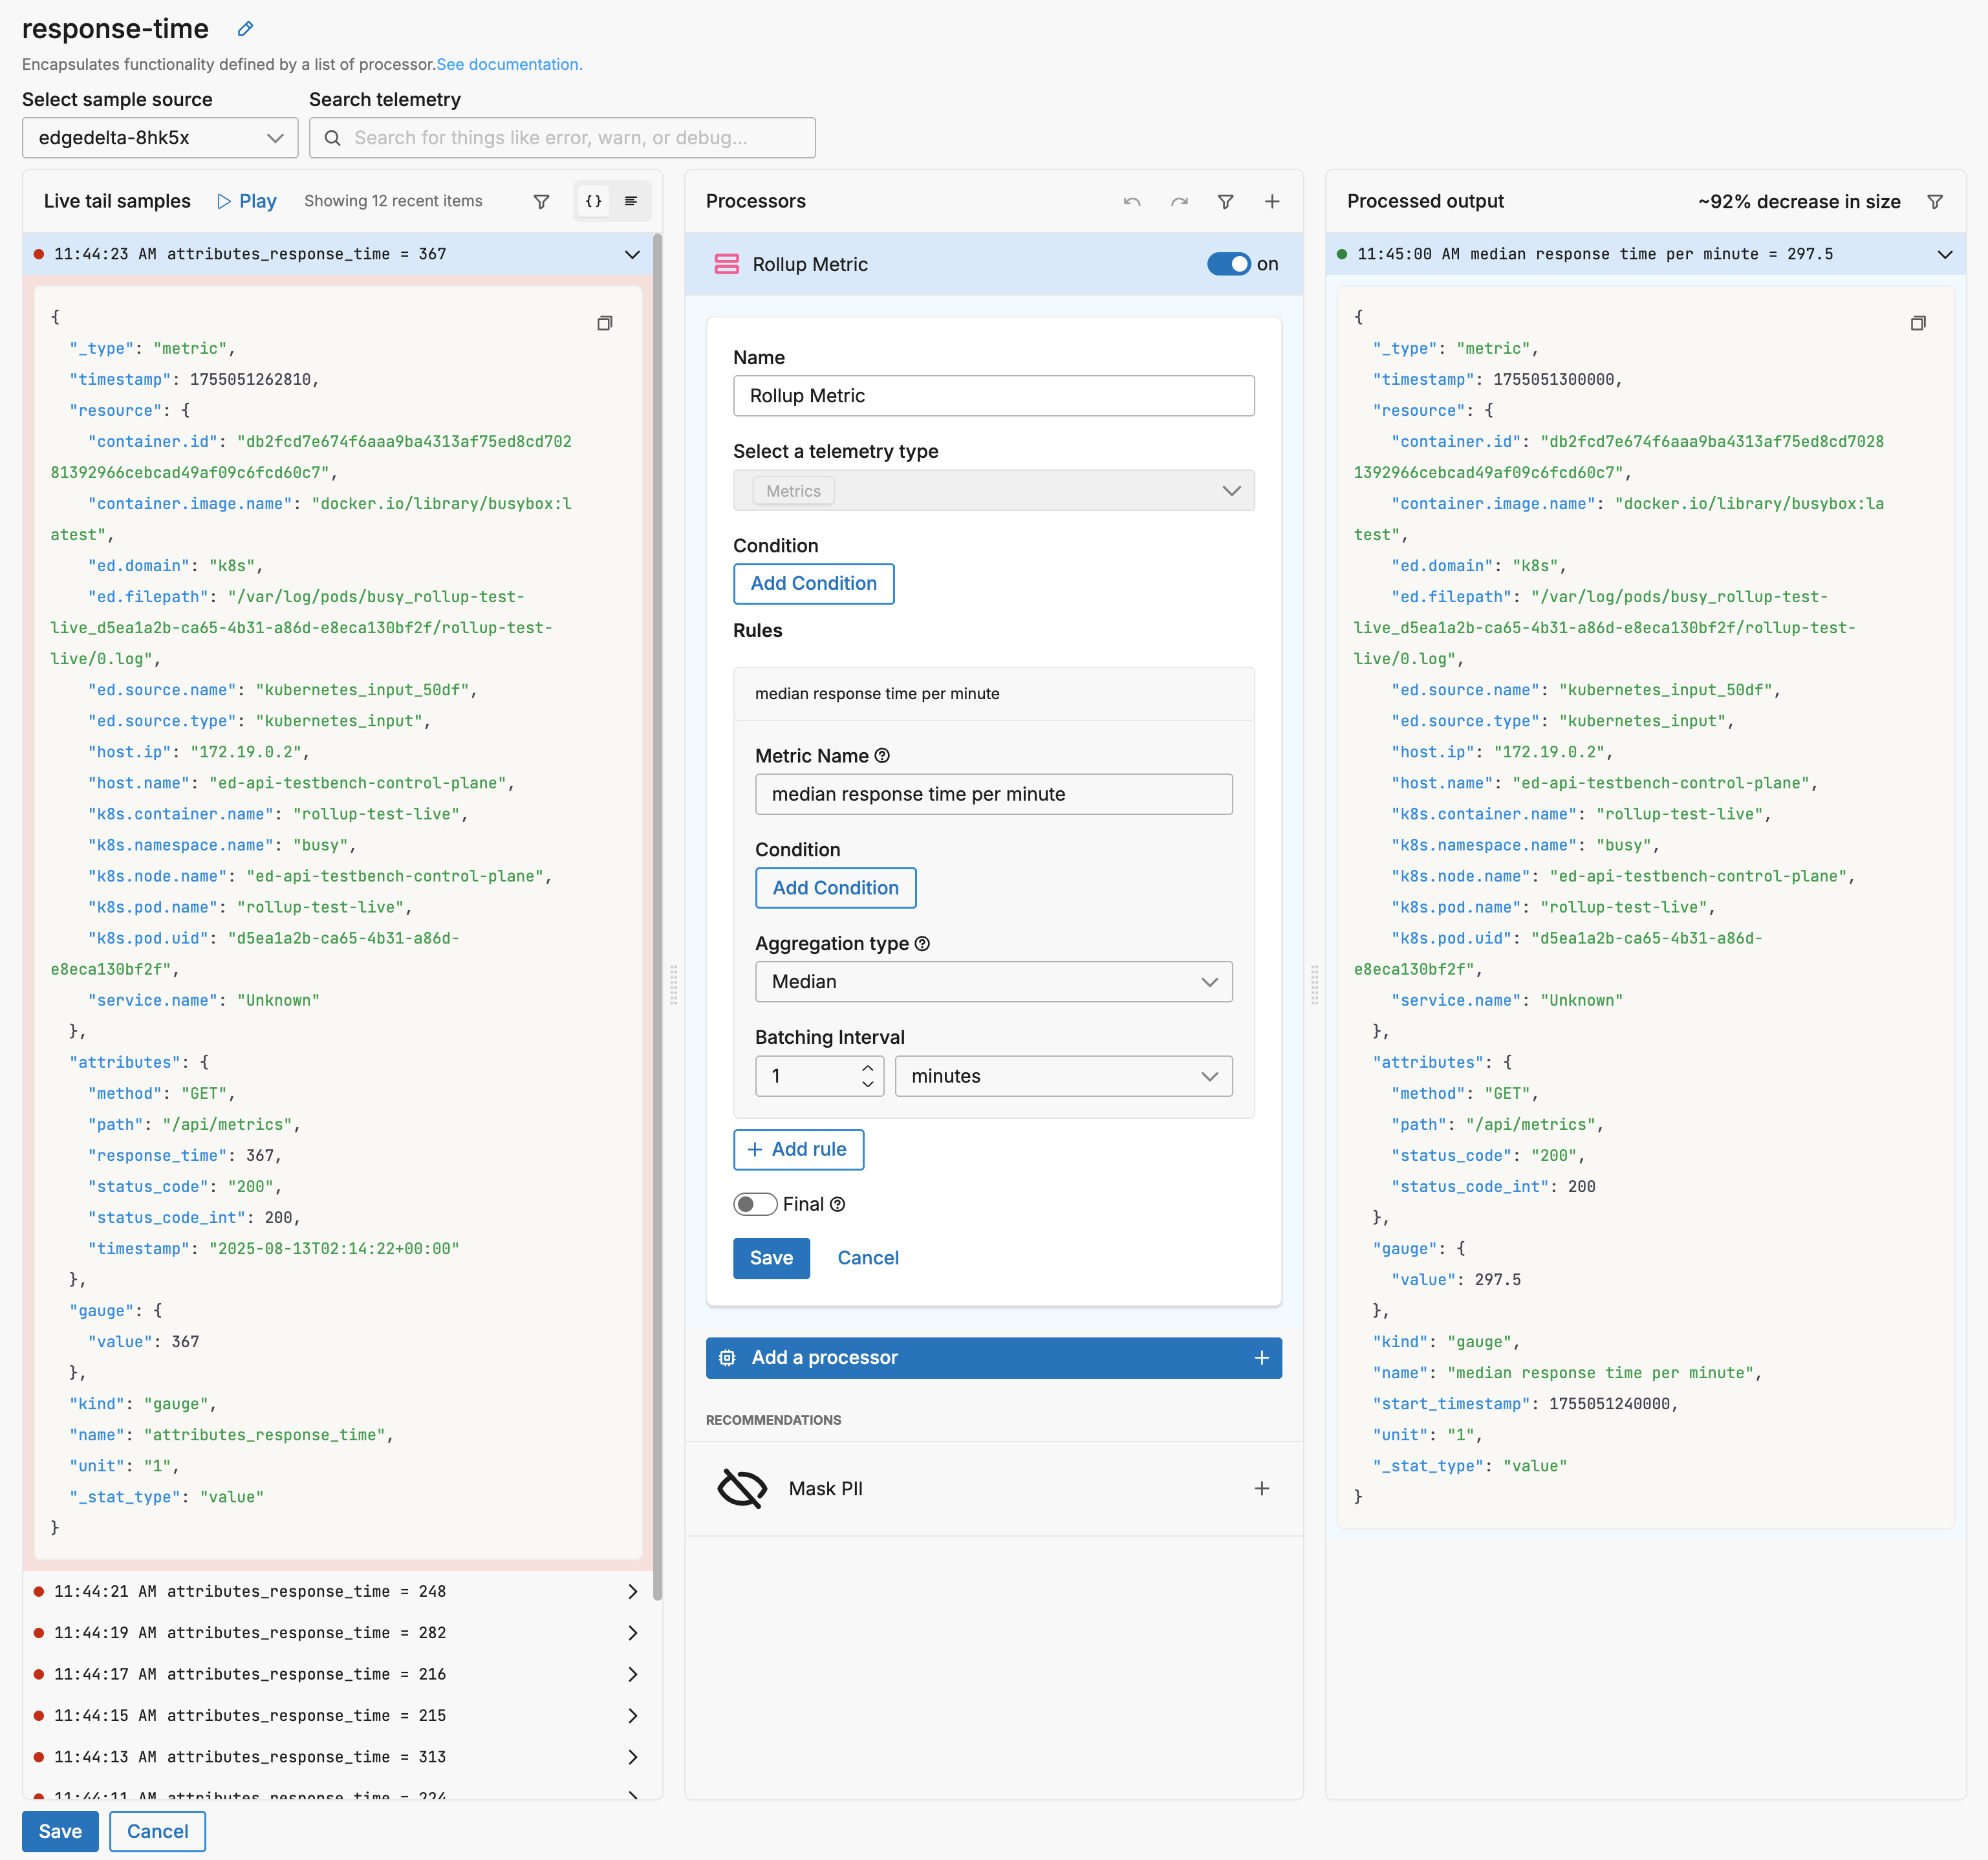
This configuration extracts response time metrics and calculates the median value per minute:
- name: sequence_c064
  type: sequence
  user_description: response-time
  processors:
  - type: aggregate_metric
    metadata: '{"id":"IdjFlGuixV0ahV0YHr6bY","type":"rollup_metric","name":"Rollup Metric"}'
    data_types:
    - metric
    aggregate_metric_rules:
    - name: median response time per minute
      interval: 1m0s
      aggregation_type: median
Example Output
The processor generates a single rolled up metric with the median value:
{
  "_type": "metric",
  "timestamp": 1755051300000,
  "resource": {
...
  },
  "attributes": {
    "method": "GET",
    "path": "/api/metrics",
    "status_code": "200",
    "status_code_int": 200
  },
  "gauge": {
    "value": 297.5
  },
  "kind": "gauge",
  "name": "median response time per minute",
  "start_timestamp": 1755051240000,
  "unit": "1",
  "_stat_type": "value"
}
Note how the rollup processor:
- Calculated the median value (297.5) from the six input metrics
- Removed the individual response_time and timestamp attributes
- Preserved common attributes (method, path, status_code)
- Added start_timestamp to indicate the aggregation window beginning
Options
Select a telemetry type
You can specify, log, metric, trace or all. It is specified using the interface, which generates a YAML list item for you under the data_types parameter. This defines the data item types against which the processor must operate. If data_types is not specified, the default value is all. It is optional.
It is defined in YAML as follows:
- name: multiprocessor
  type: sequence
  processors:
  - type: <processor type>
    data_types:
    - log
condition
The condition parameter contains a conditional phrase of an OTTL statement. It restricts operation of the processor to only data items where the condition is met. Those data items that do not match the condition are passed without processing. You configure it in the interface and an OTTL condition is generated. It is optional.
Important: All conditions must be written on a single line in YAML. Multi-line conditions are not supported.
Comparison Operators
| Operator | Name | Description | Example |
|---|---|---|---|
== | Equal to | Returns true if both values are exactly the same | attributes["status"] == "OK" |
!= | Not equal to | Returns true if the values are not the same | attributes["level"] != "debug" |
> | Greater than | Returns true if the left value is greater than the right | attributes["duration_ms"] > 1000 |
>= | Greater than or equal | Returns true if the left value is greater than or equal to the right | attributes["score"] >= 90 |
< | Less than | Returns true if the left value is less than the right | attributes["load"] < 0.75 |
<= | Less than or equal | Returns true if the left value is less than or equal to the right | attributes["retries"] <= 3 |
matches | Regex match | Returns true if the string matches a regular expression (generates IsMatch function) | IsMatch(attributes["name"], ".*\\.log$") |
Logical Operators
Important: Use lowercase and, or, not - uppercase operators will cause errors!
| Operator | Description | Example |
|---|---|---|
and | Both conditions must be true | attributes["level"] == "ERROR" and attributes["status"] >= 500 |
or | At least one condition must be true | attributes["log_type"] == "TRAFFIC" or attributes["log_type"] == "THREAT" |
not | Negates the condition | not IsMatch(attributes["path"], "^/health") |
Functions
| Function | Description | Example |
|---|---|---|
IsMatch | Returns true if string matches the regex pattern | IsMatch(attributes["message"], "ERROR\|FATAL") |
Field Existence Checks
| Check | Description | Example |
|---|---|---|
!= nil | Field exists (not null) | attributes["user_id"] != nil |
== nil | Field doesn’t exist | attributes["optional_field"] == nil |
!= "" | Field is not empty string | attributes["message"] != "" |
Common Examples
- name: _multiprocessor
  type: sequence
  processors:
  - type: <processor type>
    # Simple equality check
    condition: attributes["request"]["path"] == "/json/view"

  - type: <processor type>
    # Multiple values with OR
    condition: attributes["log_type"] == "TRAFFIC" or attributes["log_type"] == "THREAT"

  - type: <processor type>
    # Excluding multiple values (NOT equal to multiple values)
    condition: attributes["log_type"] != "TRAFFIC" and attributes["log_type"] != "THREAT"

  - type: <processor type>
    # Complex condition with AND/OR/NOT
    condition: (attributes["level"] == "ERROR" or attributes["level"] == "FATAL") and attributes["env"] != "test"

  - type: <processor type>
    # Field existence and value check
    condition: attributes["user_id"] != nil and attributes["user_id"] != ""

  - type: <processor type>
    # Regex matching on attributes
    condition: IsMatch(attributes["path"], "^/api/") and not IsMatch(attributes["path"], "^/api/health")

  - type: <processor type>
    # Regex matching on body (case-insensitive)
    condition: IsMatch(body, "(?i)error")
Common Mistakes to Avoid
# WRONG - Cannot use OR/AND with values directly
condition: attributes["log_type"] != "TRAFFIC" OR "THREAT"

# CORRECT - Must repeat the full comparison
condition: attributes["log_type"] != "TRAFFIC" and attributes["log_type"] != "THREAT"

# WRONG - Uppercase operators
condition: attributes["status"] == "error" AND attributes["level"] == "critical"

# CORRECT - Lowercase operators
condition: attributes["status"] == "error" and attributes["level"] == "critical"

# WRONG - Multi-line conditions
condition: |
  attributes["level"] == "ERROR" and
  attributes["status"] >= 500

# CORRECT - Single line (even if long)
condition: attributes["level"] == "ERROR" and attributes["status"] >= 500
Rules
Each rule in the aggregate_metric_rules array defines how to create a rolled-up metric.
Metric name
The name metric is a child of the metric definition. It defines the metric name. It is specified in the YAML as a string and is required.
It is defined in YAML as follows:
- name: _multiprocessor
  type: sequence
  processors:
  - type: <processor type>
    aggregate_metric_rules:
    - name: <metric name>
Aggregation Type
The mathematical operation to perform on the metric values:
- Count - Total number of metric data points
- Distinct Count - Number of unique values
- Last - Most recent value within the interval. Useful for gauge-type metrics such as memory usage, queue depth, and connection counts. Requires agent version v2.12.0 or higher.
- Maximum - Highest metric value in the interval
- Mean - Average of all metric values
- Median - Middle value when sorted
- Minimum - Lowest metric value in the interval
- p90 - 90th percentile value
- p95 - 95th percentile value
- p99 - 99th percentile value
- Sum - Sum of all metric values
Batching Interval
The interval parameter is a child of the metric definition. It defines the duration of the period between taking samples for the parent metric. A 1 minute interval will aggregate metrics each minute. It is specified as a duration and is required.
It is defined in YAML as follows:
- name: _multiprocessor
  type: sequence
  processors:
  - type: <processor type>
    aggregate_metric_rules:
    - name: <metric name>
      interval: 1m0s
Final
Determines whether successfully processed data items should continue through the remaining processors in the same processor stack. If final is set to true, data items output by this processor are not passed to subsequent processors within the node—they are instead emitted to downstream nodes in the pipeline (e.g., a destination). Failed items are always passed to the next processor, regardless of this setting.
The UI provides a slider to configure this setting. The default is false. It is defined in YAML as follows:
- name: multiprocessor
  type: sequence
  processors:
    - type: <processor type>
    final: true
Use Cases
Total System Throughput
Roll up all request metrics from multiple services into a single throughput metric:
- type: aggregate_metric
  metadata: '{"type":"rollup_metric","name":"System Throughput"}'
  data_types:
  - metric
  condition: name =~ ".*_requests"
  aggregate_metric_rules:
  - name: system_total_requests
    interval: 5m0s
    aggregation_type: sum
Average Response Time Across All Endpoints
Calculate the overall average response time regardless of endpoint or status:
- type: aggregate_metric
  metadata: '{"type":"rollup_metric","name":"Overall Response Time"}'
  data_types:
  - metric
  condition: name == "http_response_time"
  aggregate_metric_rules:
  - name: average_response_time_all_endpoints
    interval: 1m0s
    aggregation_type: mean
Peak Load Detection
Track the maximum concurrent connections across all services:
- type: aggregate_metric
  metadata: '{"type":"rollup_metric","name":"Peak Connections"}'
  data_types:
  - metric
  condition: name == "active_connections"
  aggregate_metric_rules:
  - name: peak_connections_per_hour
    interval: 1h0s
    aggregation_type: maximum
Configuration Wizard
Use this interactive wizard to generate a starter configuration:
What summary do you need?
Choose how to aggregate your metrics within each time interval.
See Also
- For an overview and to understand processor sequence flow, see Processors Overview
- To learn how to configure a processor, see Configure a Processor.
- For optimization strategies, see Best Practices for Edge Delta Processors.
- If you’re new to pipelines, start with the Pipeline Quickstart Overview or learn how to Configure a Pipeline.
- Looking to understand how processors interact with sources and destinations? Visit the Pipeline Overview.