RUM Data Reference
9 minute read
Overview
The RUM SDK emits two signals. Views and requests are trace spans, while errors and messages are log records, so RUM data appears in two places and is sent at two different times:
| Signal | Carries | Sent |
|---|---|---|
| View spans | One documentLoad span per page load and one routeChange span per single page application navigation, with Core Web Vitals | When the visitor leaves, backgrounds the page, or the next view opens |
| Request spans | One client span per fetch or XHR request, when requestSpans is on | Batched, within about 5 seconds |
| Error logs | Uncaught errors, unhandled promise rejections, handled errors from addError, and messages from addMessage | Batched, within about 5 seconds |
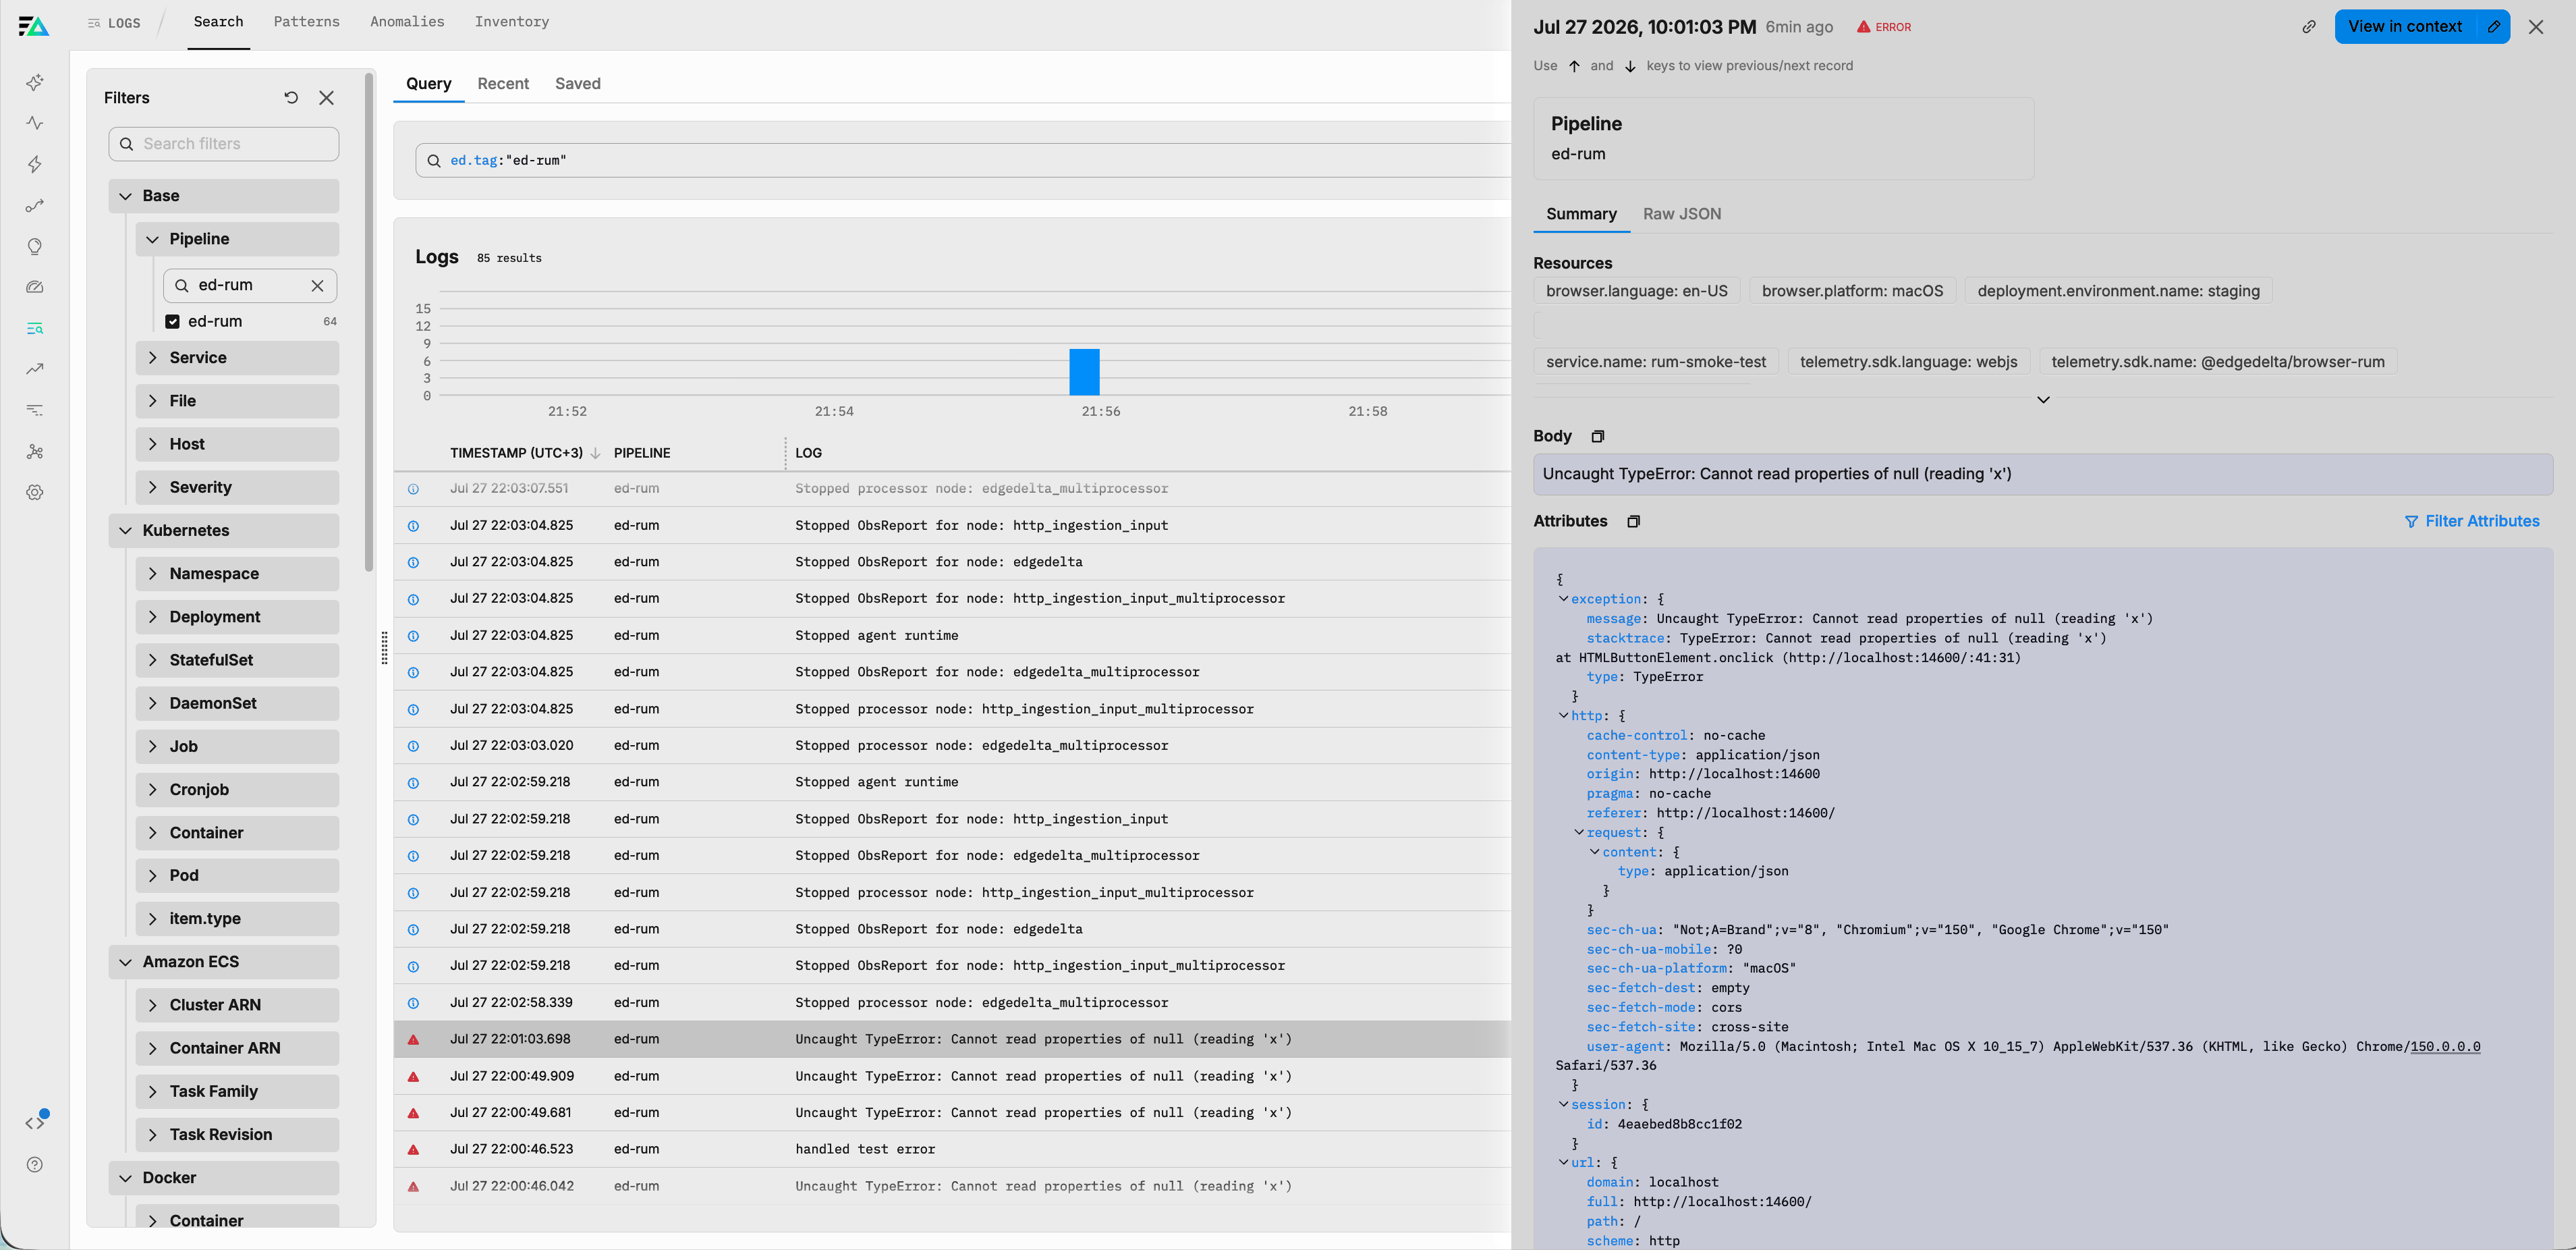
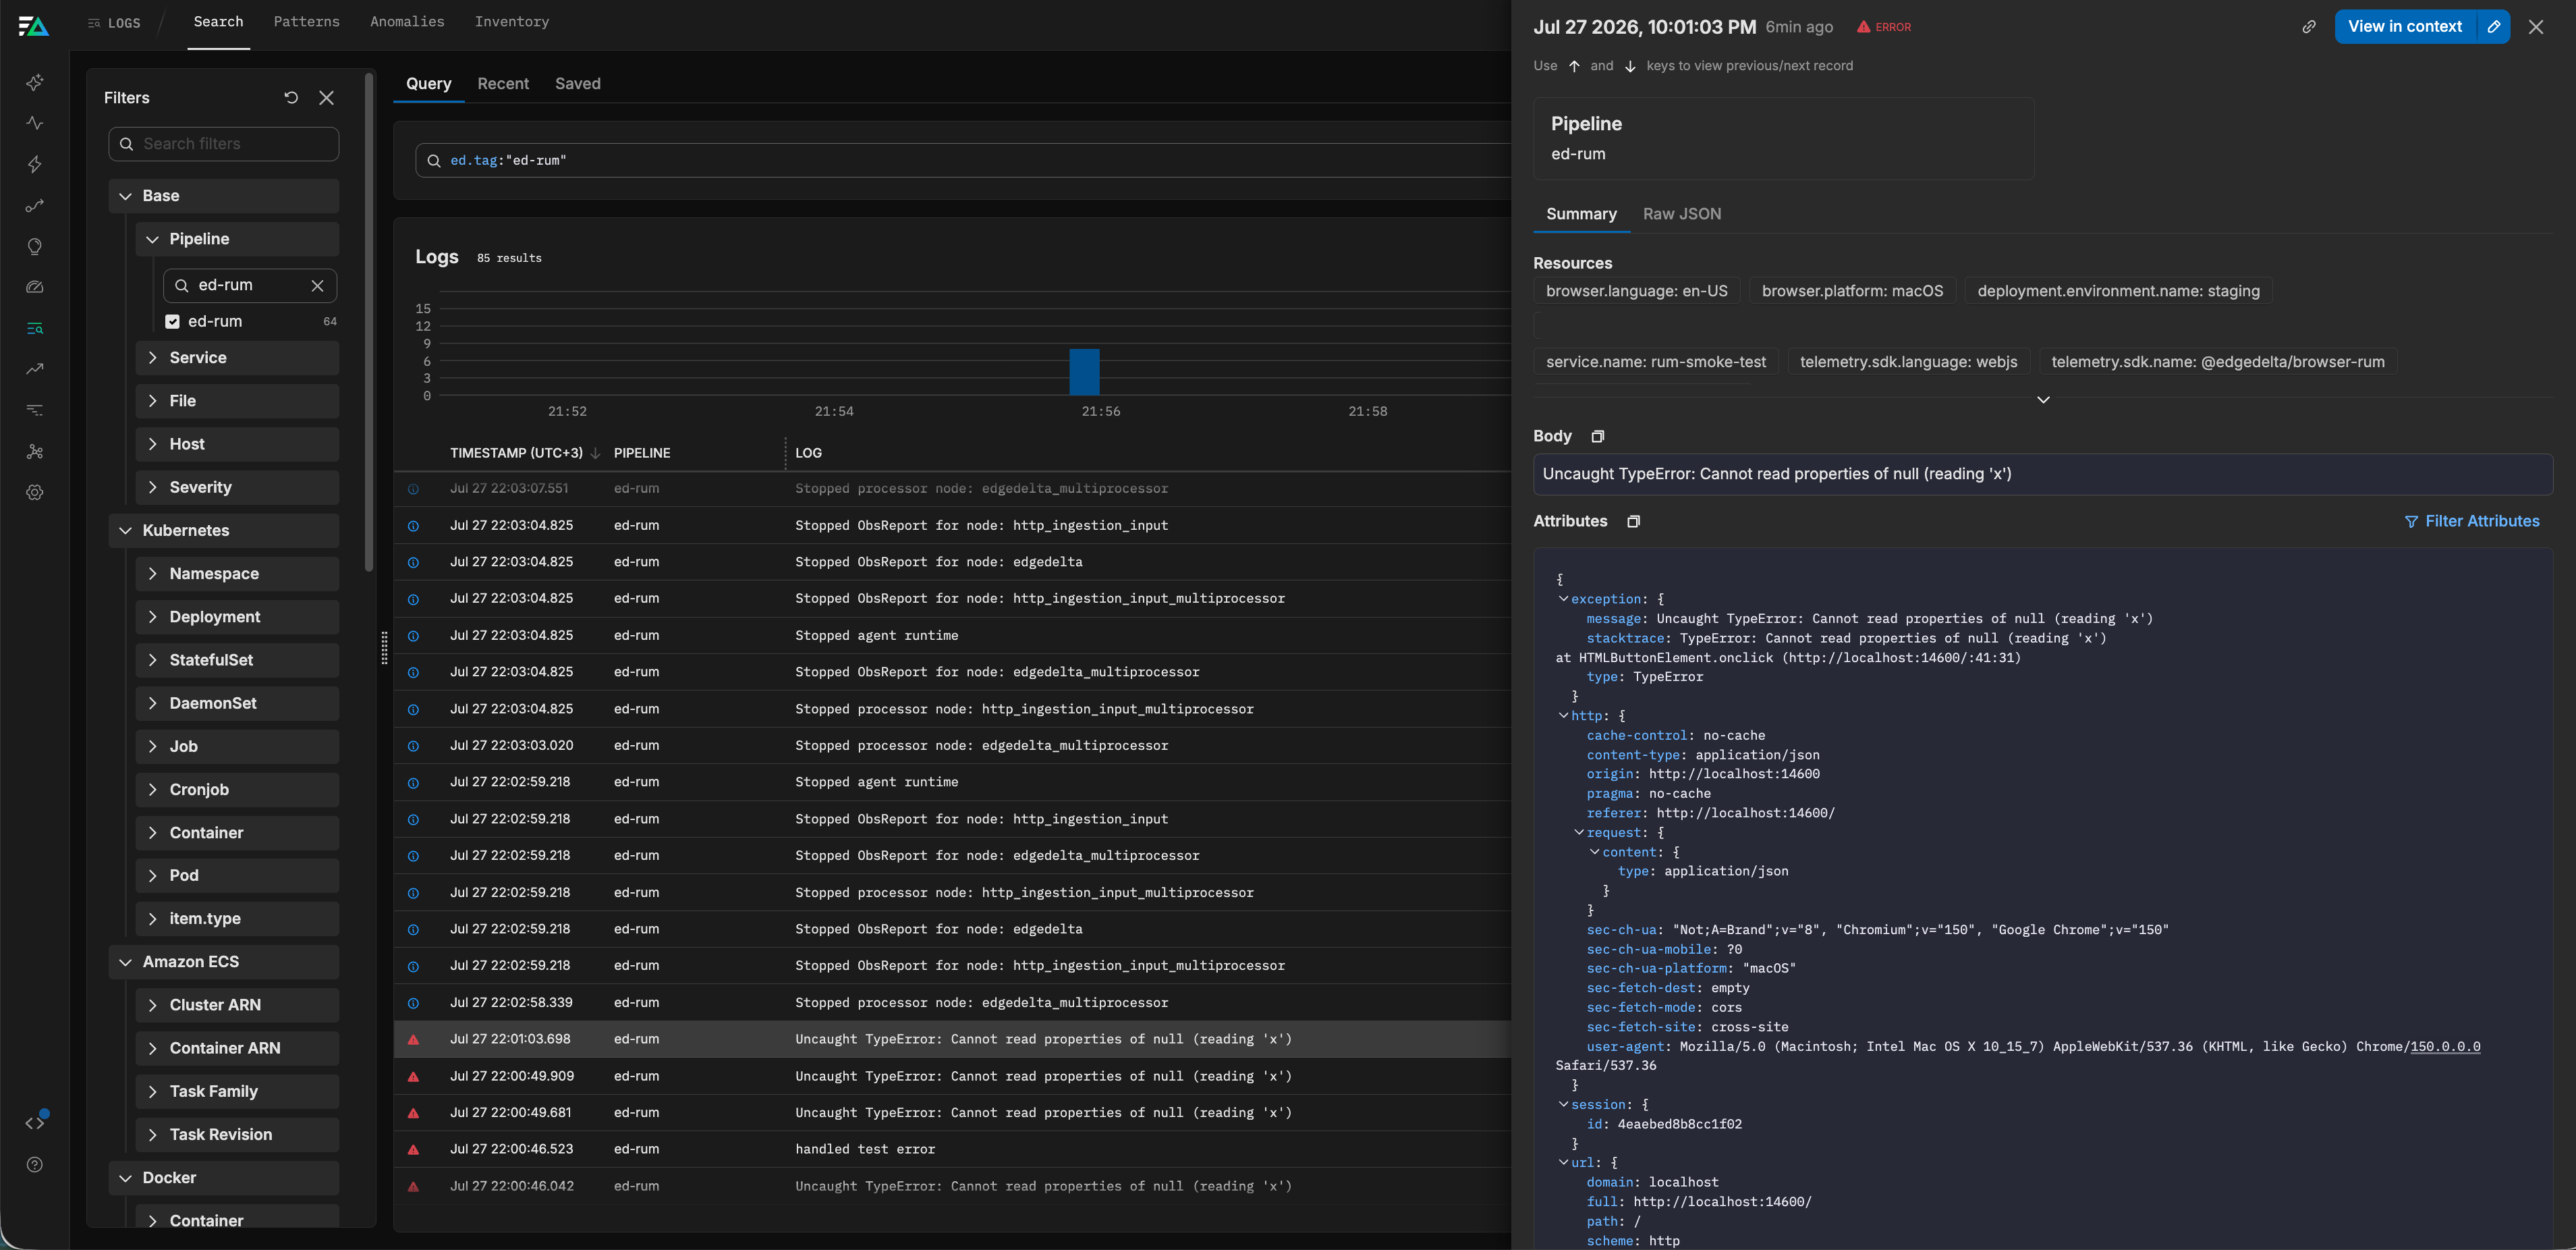
Errors are log records rather than spans because a browser error caught by a global handler has no span to attach an exception to. As logs, they also gain pattern grouping and full text search over messages and stacks in Log Search. The log drawer shows each error’s exception.* attributes along with the page and session context:
Views and sessions
A view is one trace: the document load, then one per route change. Each view carries its own span, its own Cumulative Layout Shift (CLS), and its own Interaction to Next Paint (INP), and every error reported while the view is open carries its trace ID. Views are joined to each other by session.id, not by trace ID, so a 40-minute single page session is many traces, not one.
A session groups the views and errors of one visit:
- A session ends after 15 minutes of inactivity and is capped at 4 hours.
- The session ID is stored in the browser’s
sessionStorageunder the keyed_rum_session. - The sampling decision (
sampleRate) is made once when the session starts and pinned for its lifetime, so sessions are never half-recorded. - When storage is unavailable, such as in some private browsing modes, sessions degrade to one per page view instead of persisting across pages.
Page load spans
Each page load produces one span named documentLoad, matching the OpenTelemetry document load instrumentation span name. The span starts at navigation start and ends at the load event, and it carries the load phase timings and Core Web Vitals as attributes.
The span is sent when the page is hidden (the visitor switches tabs, navigates away, or closes the page), not when the load finishes. CLS and INP keep changing while the visitor is on the page and are only final at that point. When testing, switch tabs or close the page before looking for the span.
Navigation phase child spans
By default, the load phases are attributes on the one documentLoad span, so query them as fields rather than expecting a waterfall. Setting navigationSpans: true in the SDK configuration emits the phases as child spans instead, so the trace draws as a waterfall:
documentLoad
├─ dnsLookup
├─ connect
│  └─ tls
├─ request
├─ response
├─ domProcessing
└─ loadEvent
The phases stay on the view span as attributes either way, and the attributes remain what you query. The child spans exist to be drawn and carry no attributes of their own. Phases that did not happen are skipped: a reused keep-alive connection reports no dnsLookup or connect span, and tls is absent over plain HTTP.
The option is off by default because it is a volume decision. Each span is a separate item downstream, so a page view goes from one trace item to as many as eight.
Route change spans
With routeChanges on (the default), each single page application navigation produces a span named routeChange and opens a new view. Only a change of path opens one; a router rewriting the query string on every filter change costs nothing.
The span covers the transition, by default from the URL change to the first paint after it. Its vitals cover the whole time the view was open, which is longer: a layout shift ten seconds in still belongs to the route the visitor was looking at. When the application names routes through endView or startView, the span carries the route pattern in ed.rum.route, for example /orgs/$orgId/logs rather than /orgs/42/logs, so spans group by route instead of by URL. Span names stay documentLoad and routeChange either way. See Views for wiring a router.
Request spans
With requestSpans: true, every fetch and XHR request the page makes produces one client span, named by method and host, for example GET api.acme.com. Request spans belong to the view’s trace, so a slow API call shows up inside the page view that made it.
| Attribute | Description |
|---|---|
http.request.method | The request method. |
url.full | Origin and path of the request. Query strings and fragments are stripped. |
http.response.status_code | The response status. Absent when the request failed at the network layer. |
ed.rum.route | The route pattern of the view the request happened in, when known. |
Three kinds of request are never reported: the SDK’s own ingestion requests (a span for an export would itself be exported, producing a loop), non-HTTP schemes such as blob: and data:, and URLs that do not parse.
requestSpans is off by default because it is the largest volume multiplier in the SDK: it adds one span for every HTTP request every recorded page makes. Turn it on deliberately, and consider sampleRate alongside it.
Error log records
Errors are exported as OTLP log records with severity ERROR. The record body is the error message, and the details are in attributes:
| Attribute | Description |
|---|---|
exception.type | The error name, for example TypeError or UnhandledRejection. |
exception.message | The error message, truncated to 1024 characters. |
exception.stacktrace | The stack trace when available, truncated to 8192 characters. |
ed.rum.breadcrumbs | A JSON array of the last 20 things that happened before the error, newest last. See Breadcrumbs. |
ed.rum.mechanism | Which React path reported a render error: react.boundary, react.root, or react.router. See React error reporting. |
ed.rum.error_id | The event ID a React error boundary can show to the user, so one quoted ID finds one exact error. |
Uncaught errors and unhandled promise rejections are captured automatically while captureErrors is enabled. Errors you handle yourself can be reported with addError, optionally with a fingerprint that groups unstable messages, and addMessage sends a log record with no exception.* attributes at all. The loader also buffers up to 20 errors thrown before the SDK bundle finishes loading and reports them once it arrives.
Correlating errors with page loads
Everything one view emits shares one trace ID, and each error log record carries it. In the log drawer, use the Search in Traces action on the trace ID to open the view span for the page load or route change the error happened in. Errors thrown while the page was still loading also carry the span ID of the documentLoad span.
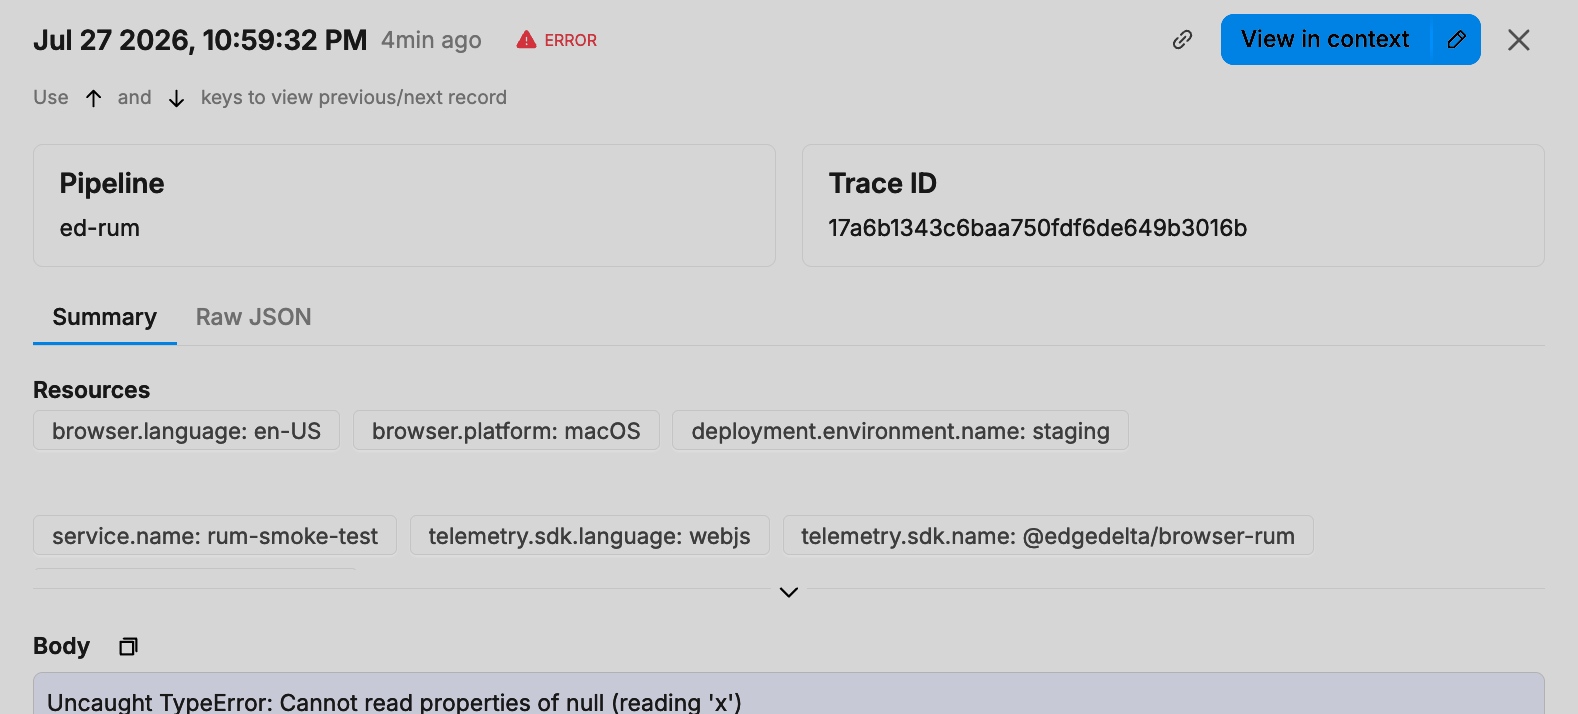
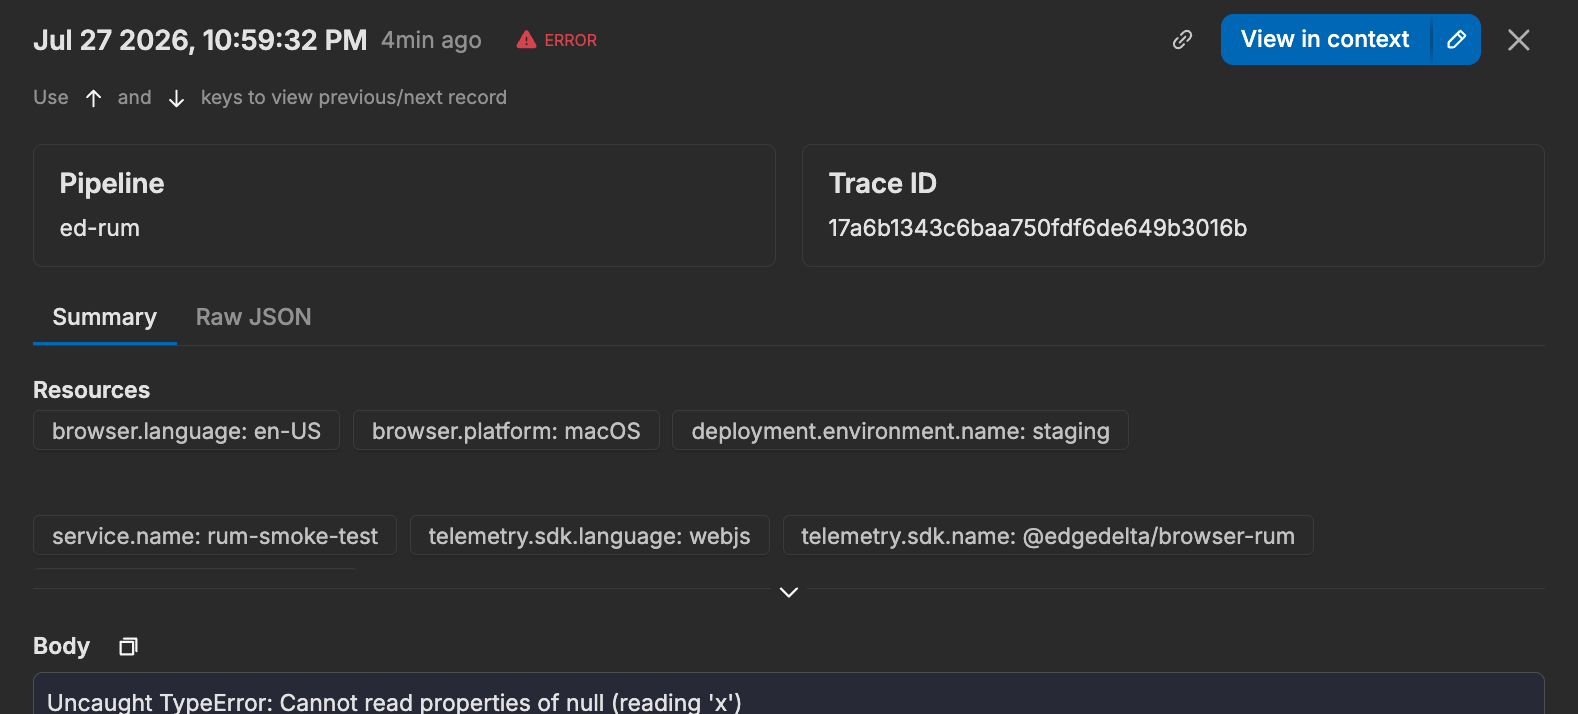
session.id and the url.* attributes are on both signals as well, which is how you widen from one error to everything else that visitor did.
Connect browser traces to backend traces
With requestSpans: true, the SDK sends a W3C traceparent header on the page’s HTTP requests, so the span your server records becomes a child of the browser’s request span and one trace covers the click and the query behind it. Your backend needs no new code: reading traceparent is default behavior in every OpenTelemetry SDK and in common vendor agents.
| Target | What it takes |
|---|---|
| Same-origin API | Nothing. No CORS is involved, so nothing can break. |
| Cross-origin API | traceparent in that server’s Access-Control-Allow-Headers, then the host in propagateTo. |
| The page load itself | A Server-Timing header on the document response. |
For cross-origin APIs, deploy the CORS change before listing the host. traceparent is not a CORS-safelisted header, so adding it makes the request preflighted, and a server that does not allow the header rejects the preflight, which means the request never leaves the browser. This fails hard, not quietly.
A string entry in propagateTo matches the whole host, and there are no wildcards: an entry matching more than it names hands the application’s trace topology to a third party. For a family of hosts, pass a RegExp or a predicate, and anchor the pattern; unanchored, /acme\.com/ also matches evil-acme.com:
propagateTo: [/\.acme\.com$/, (host) => ourServices.has(host)]
The page load itself cannot propagate: no script is running when the browser asks for the HTML. Have that response return its own trace context instead, and the documentLoad span links to it:
Server-Timing: traceparent;desc="00-<trace-id>-<span-id>-01"
A cross-origin document response also needs Timing-Allow-Origin for the browser to expose the value at all.
Attribute reference
Resource attributes
These attributes describe the application and browser, and appear on both signals:
| Attribute | Description |
|---|---|
service.name | The service value from the SDK configuration. |
service.version | The version value, when set. |
deployment.environment.name | The environment value, when set. |
user_agent.original | The browser’s user agent string, used for browser, OS, and device breakdowns. |
browser.language | The browser language, for example en-US. |
browser.platform | The operating system platform. Reported by Chromium-based browsers only. |
browser.mobile | Whether the device reports itself as mobile. Reported by Chromium-based browsers only. |
telemetry.sdk.name | @edgedelta/browser-rum. |
telemetry.sdk.version | The SDK version. |
View and session attributes
These attributes appear on view spans and on every error log record:
| Attribute | Description |
|---|---|
session.id | Groups a visitor’s views and errors. |
url.full | The page origin and path. Query strings and fragments are stripped, since they often carry tokens and personal data. |
url.path | The page path. |
url.domain | The page hostname. |
url.scheme | http or https. |
ed.rum.route | The route pattern, when the router supplied one through startView or endView. |
user.id, user.email, user.name | Present once setUser is called. |
Attributes added with setContext appear alongside these on everything sent after the call.
Core Web Vitals attributes
Vitals are attributes on view spans. Each view measures its own vitals, so a route change’s CLS and INP describe that view, not the whole visit. Timing vitals are reported in milliseconds; CLS is unitless. Each vital has a matching .rating attribute (for example ed.rum.lcp.rating) with the value good, needs-improvement, or poor:
| Attribute | Metric |
|---|---|
ed.rum.lcp | Largest Contentful Paint (LCP). |
ed.rum.cls | Cumulative Layout Shift (CLS). |
ed.rum.inp | Interaction to Next Paint (INP). |
ed.rum.fcp | First Contentful Paint (FCP). |
ed.rum.ttfb | Time to First Byte (TTFB). |
A vital that could not be measured is absent. For example, a view the visitor never interacted with reports no INP.
Load phase and navigation attributes
Load phases are reported in milliseconds on the documentLoad span. A phase that did not happen is absent, so a reused keep-alive connection reports no ed.rum.dns_ms or ed.rum.tcp_ms:
| Attribute | Description |
|---|---|
ed.rum.navigation_type | How the view was reached: navigate, reload, or back_forward. |
ed.rum.dns_ms | DNS lookup duration. |
ed.rum.tcp_ms | Connection establishment duration. |
ed.rum.tls_ms | TLS handshake duration. Absent over plain HTTP. |
ed.rum.request_ms | Time from request start to first response byte. |
ed.rum.response_ms | Response download duration. |
ed.rum.dom_interactive_ms | Time from navigation start until the DOM became interactive. |
ed.rum.dom_content_loaded_ms | Time from navigation start until DOMContentLoaded completed. |
ed.rum.transfer_size | Bytes transferred for the document, over the wire. |
Querying and monitoring
Views and requests are trace data, and errors are log data, so build queries and monitors accordingly:
- In the Trace Explorer, filter by your
service.nameand the span namesdocumentLoadandrouteChange, then facet byurl.path,ed.rum.route,ed.rum.lcp.rating, orbrowser.languageto find slow pages and affected users. - For performance alerting, build monitors over the trace data, for example LCP p75 by
url.path. - For error alerting, build monitors over the log data instead, filtered to records where
exception.typeis present.
See Also
- Install Browser RUM - Script tag and npm installation
- RUM Configuration and API - All SDK options, views, breadcrumbs, and middleware
- Troubleshooting RUM - Diagnose missing or partial data
- Edge Delta Trace Explorer - Explore and analyze trace data
- Monitors - Alert on RUM metrics and errors