Run Rehydrations
4 minute read
Once you have deployed the rehydration infrastructure, you can create and manage rehydration jobs from the Edge Delta UI.
Prerequisites
Before creating a rehydration, configure the required Legacy Integrations:
- Archive Source: Configure an S3, GCS, or MinIO integration pointing to your archived logs
- Destination: Configure the destination where rehydrated logs will be sent (Splunk, Elasticsearch, Dynatrace, or Google Cloud Logging)
To configure these integrations, navigate to Admin > Legacy Integrations and add the required source and destination configurations.
Create a Rehydration
To create a rehydration:
- Click Pipelines in the navigation bar.
- Select the Rehydrations tab.
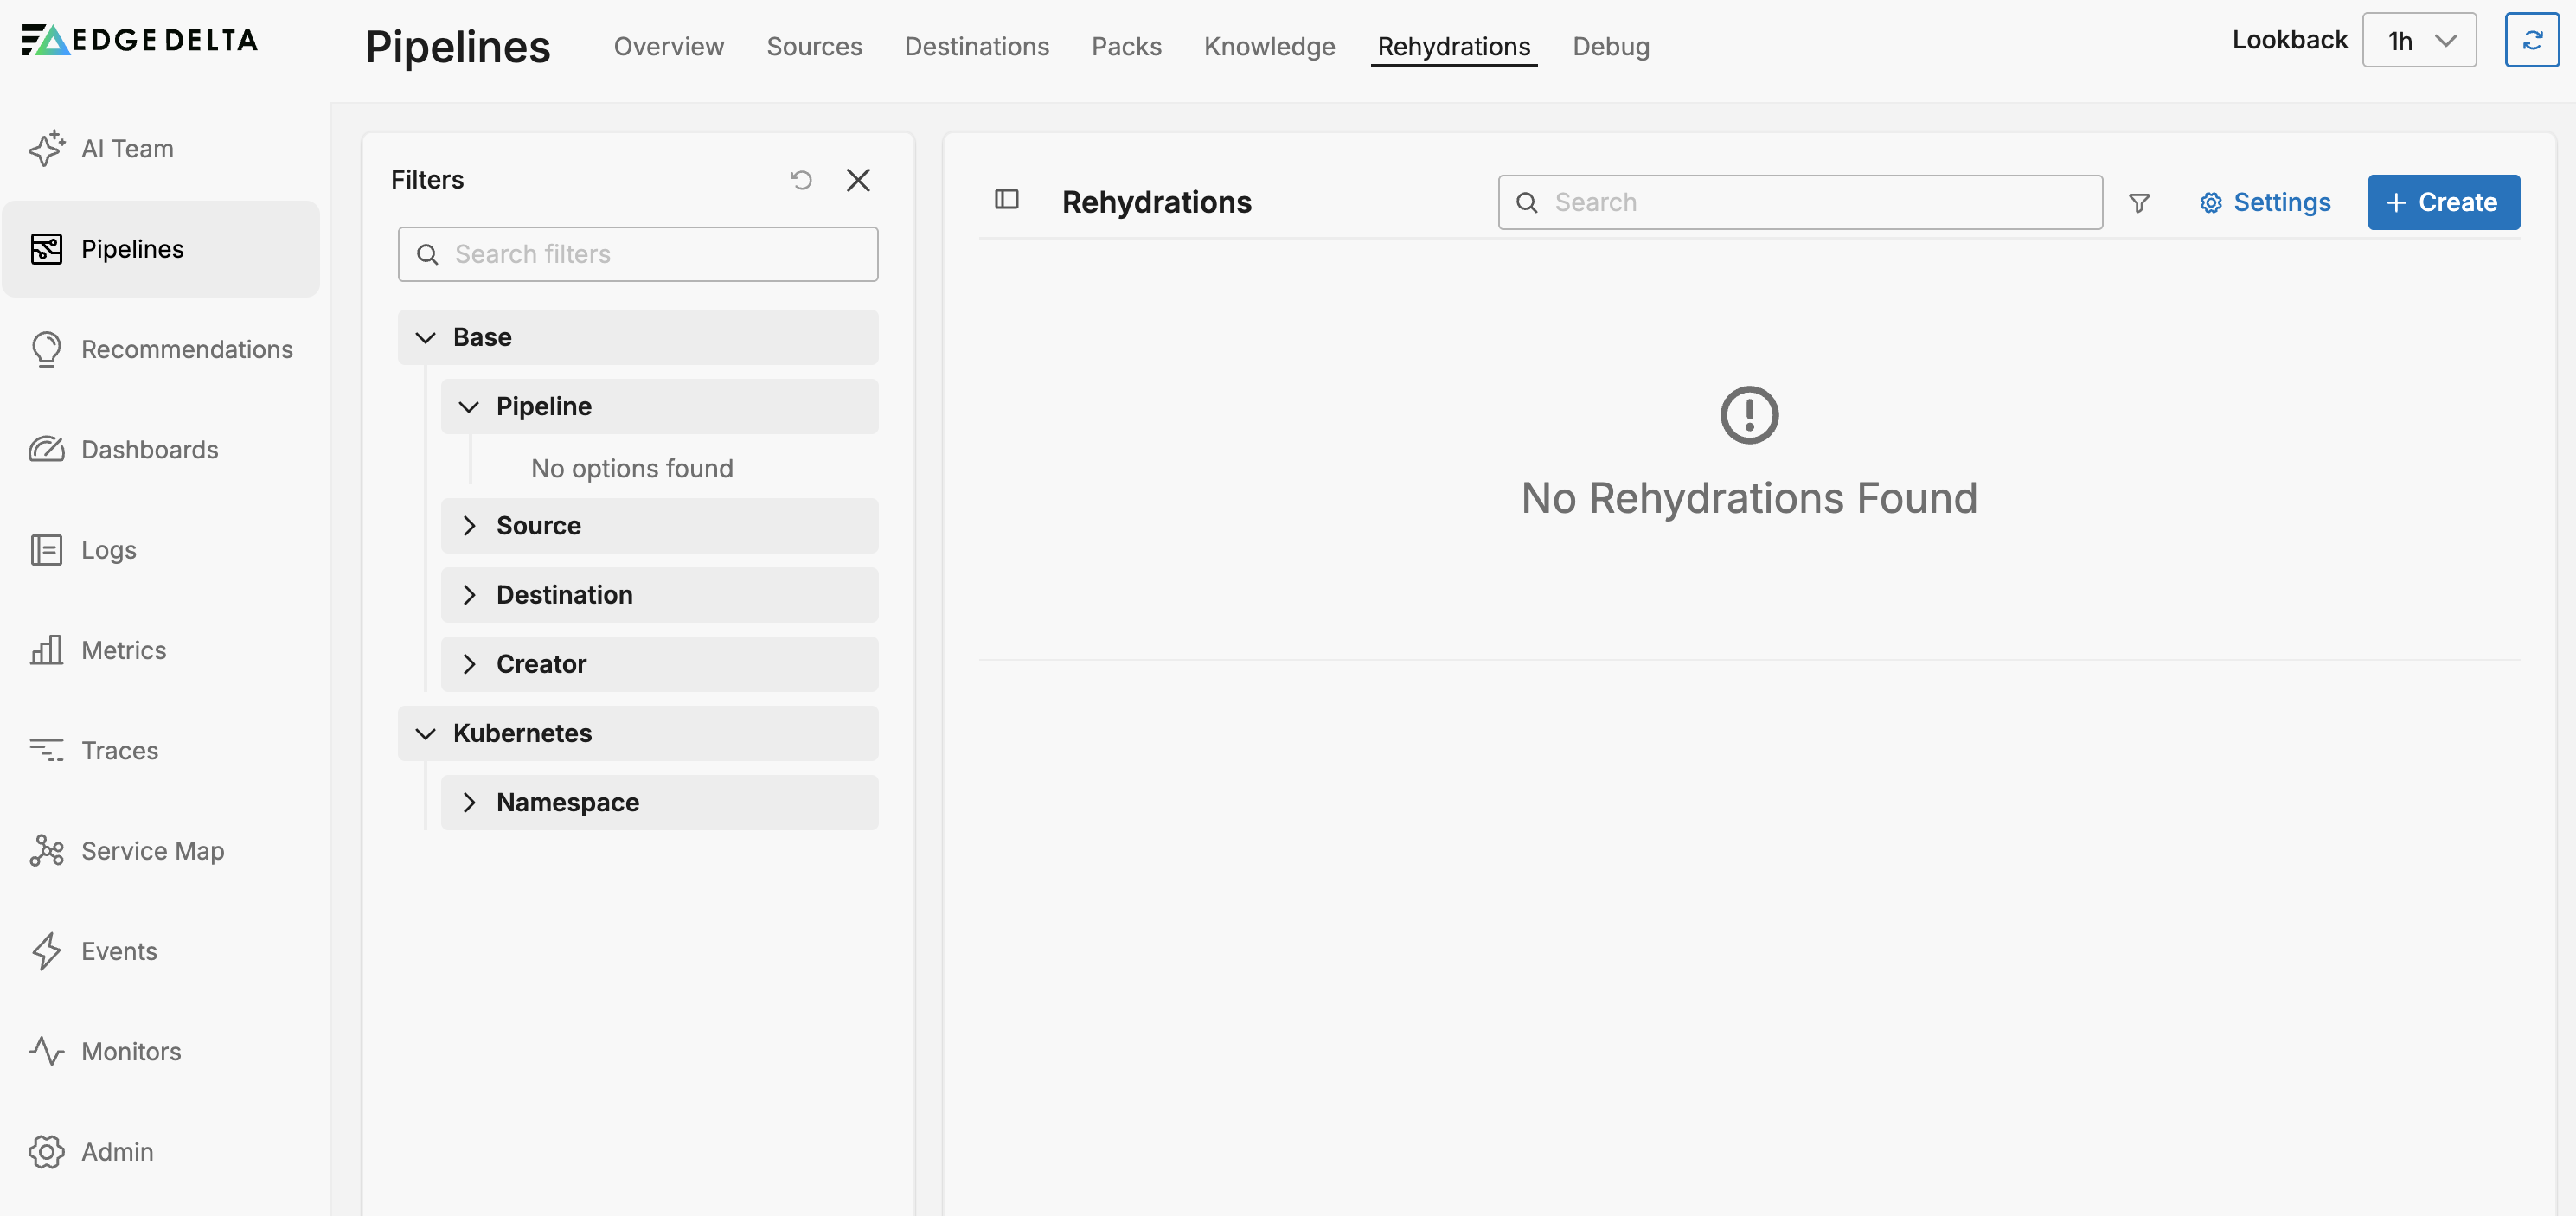

- Click Create.
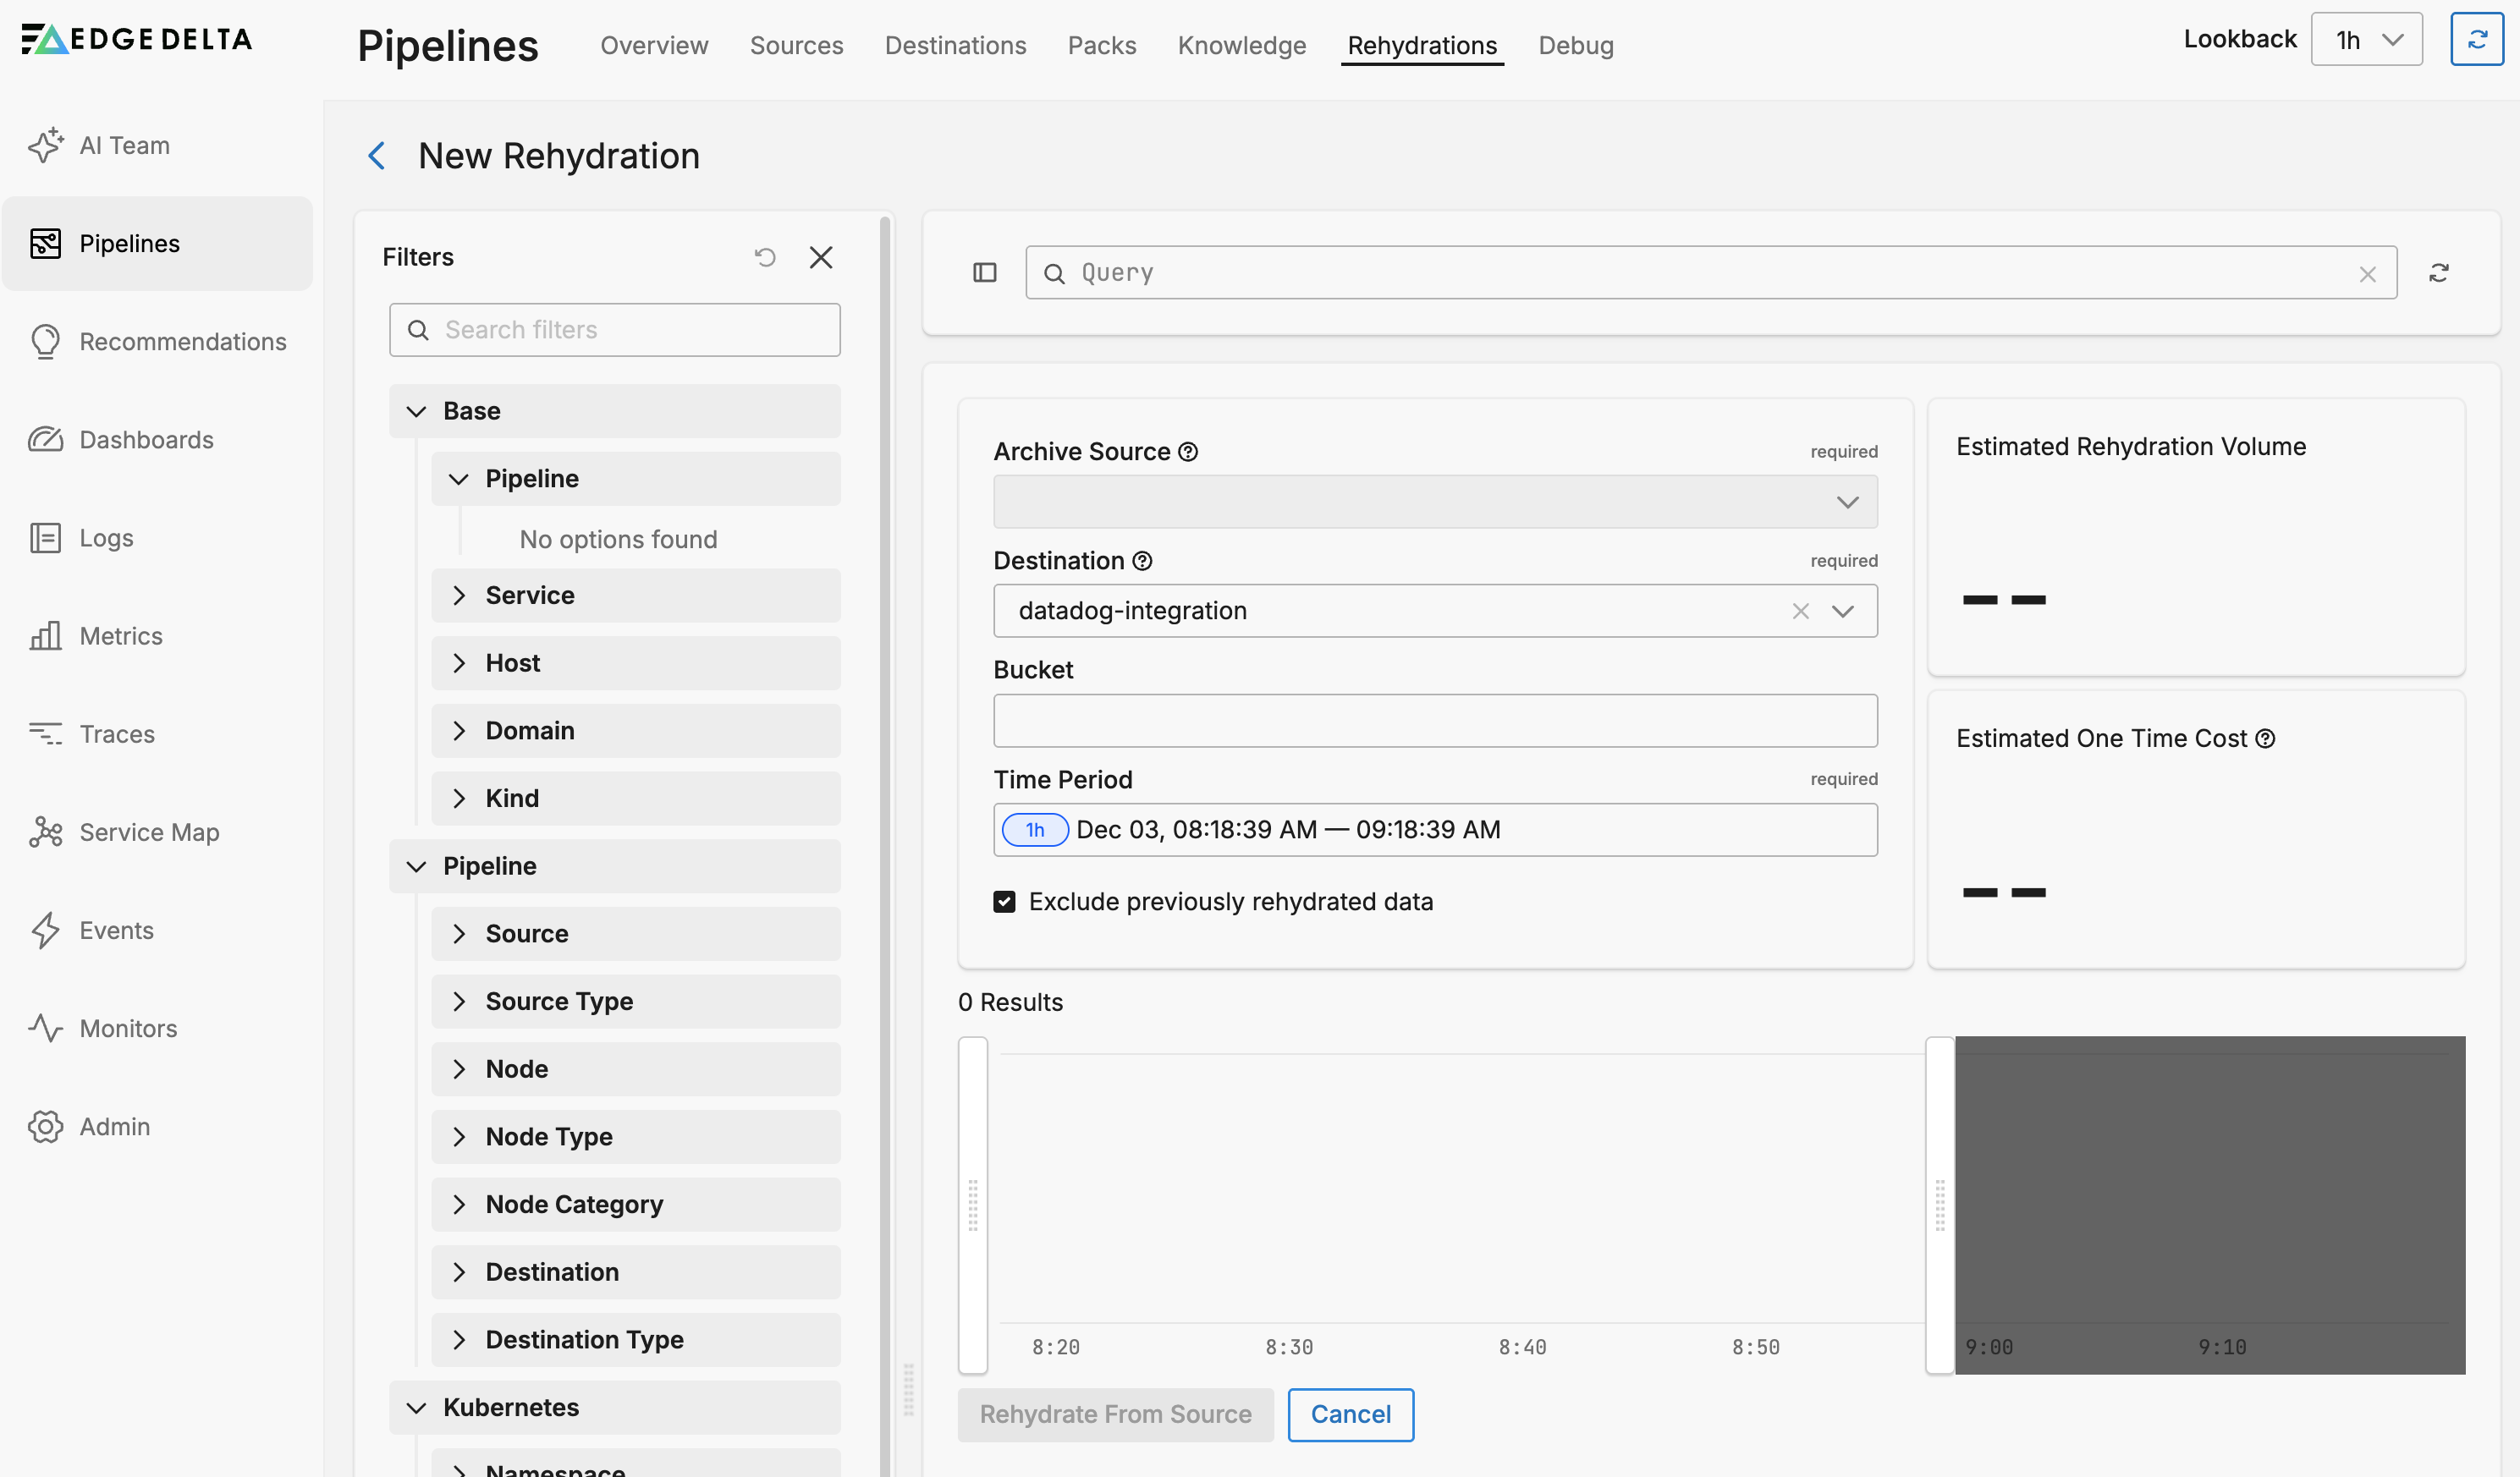
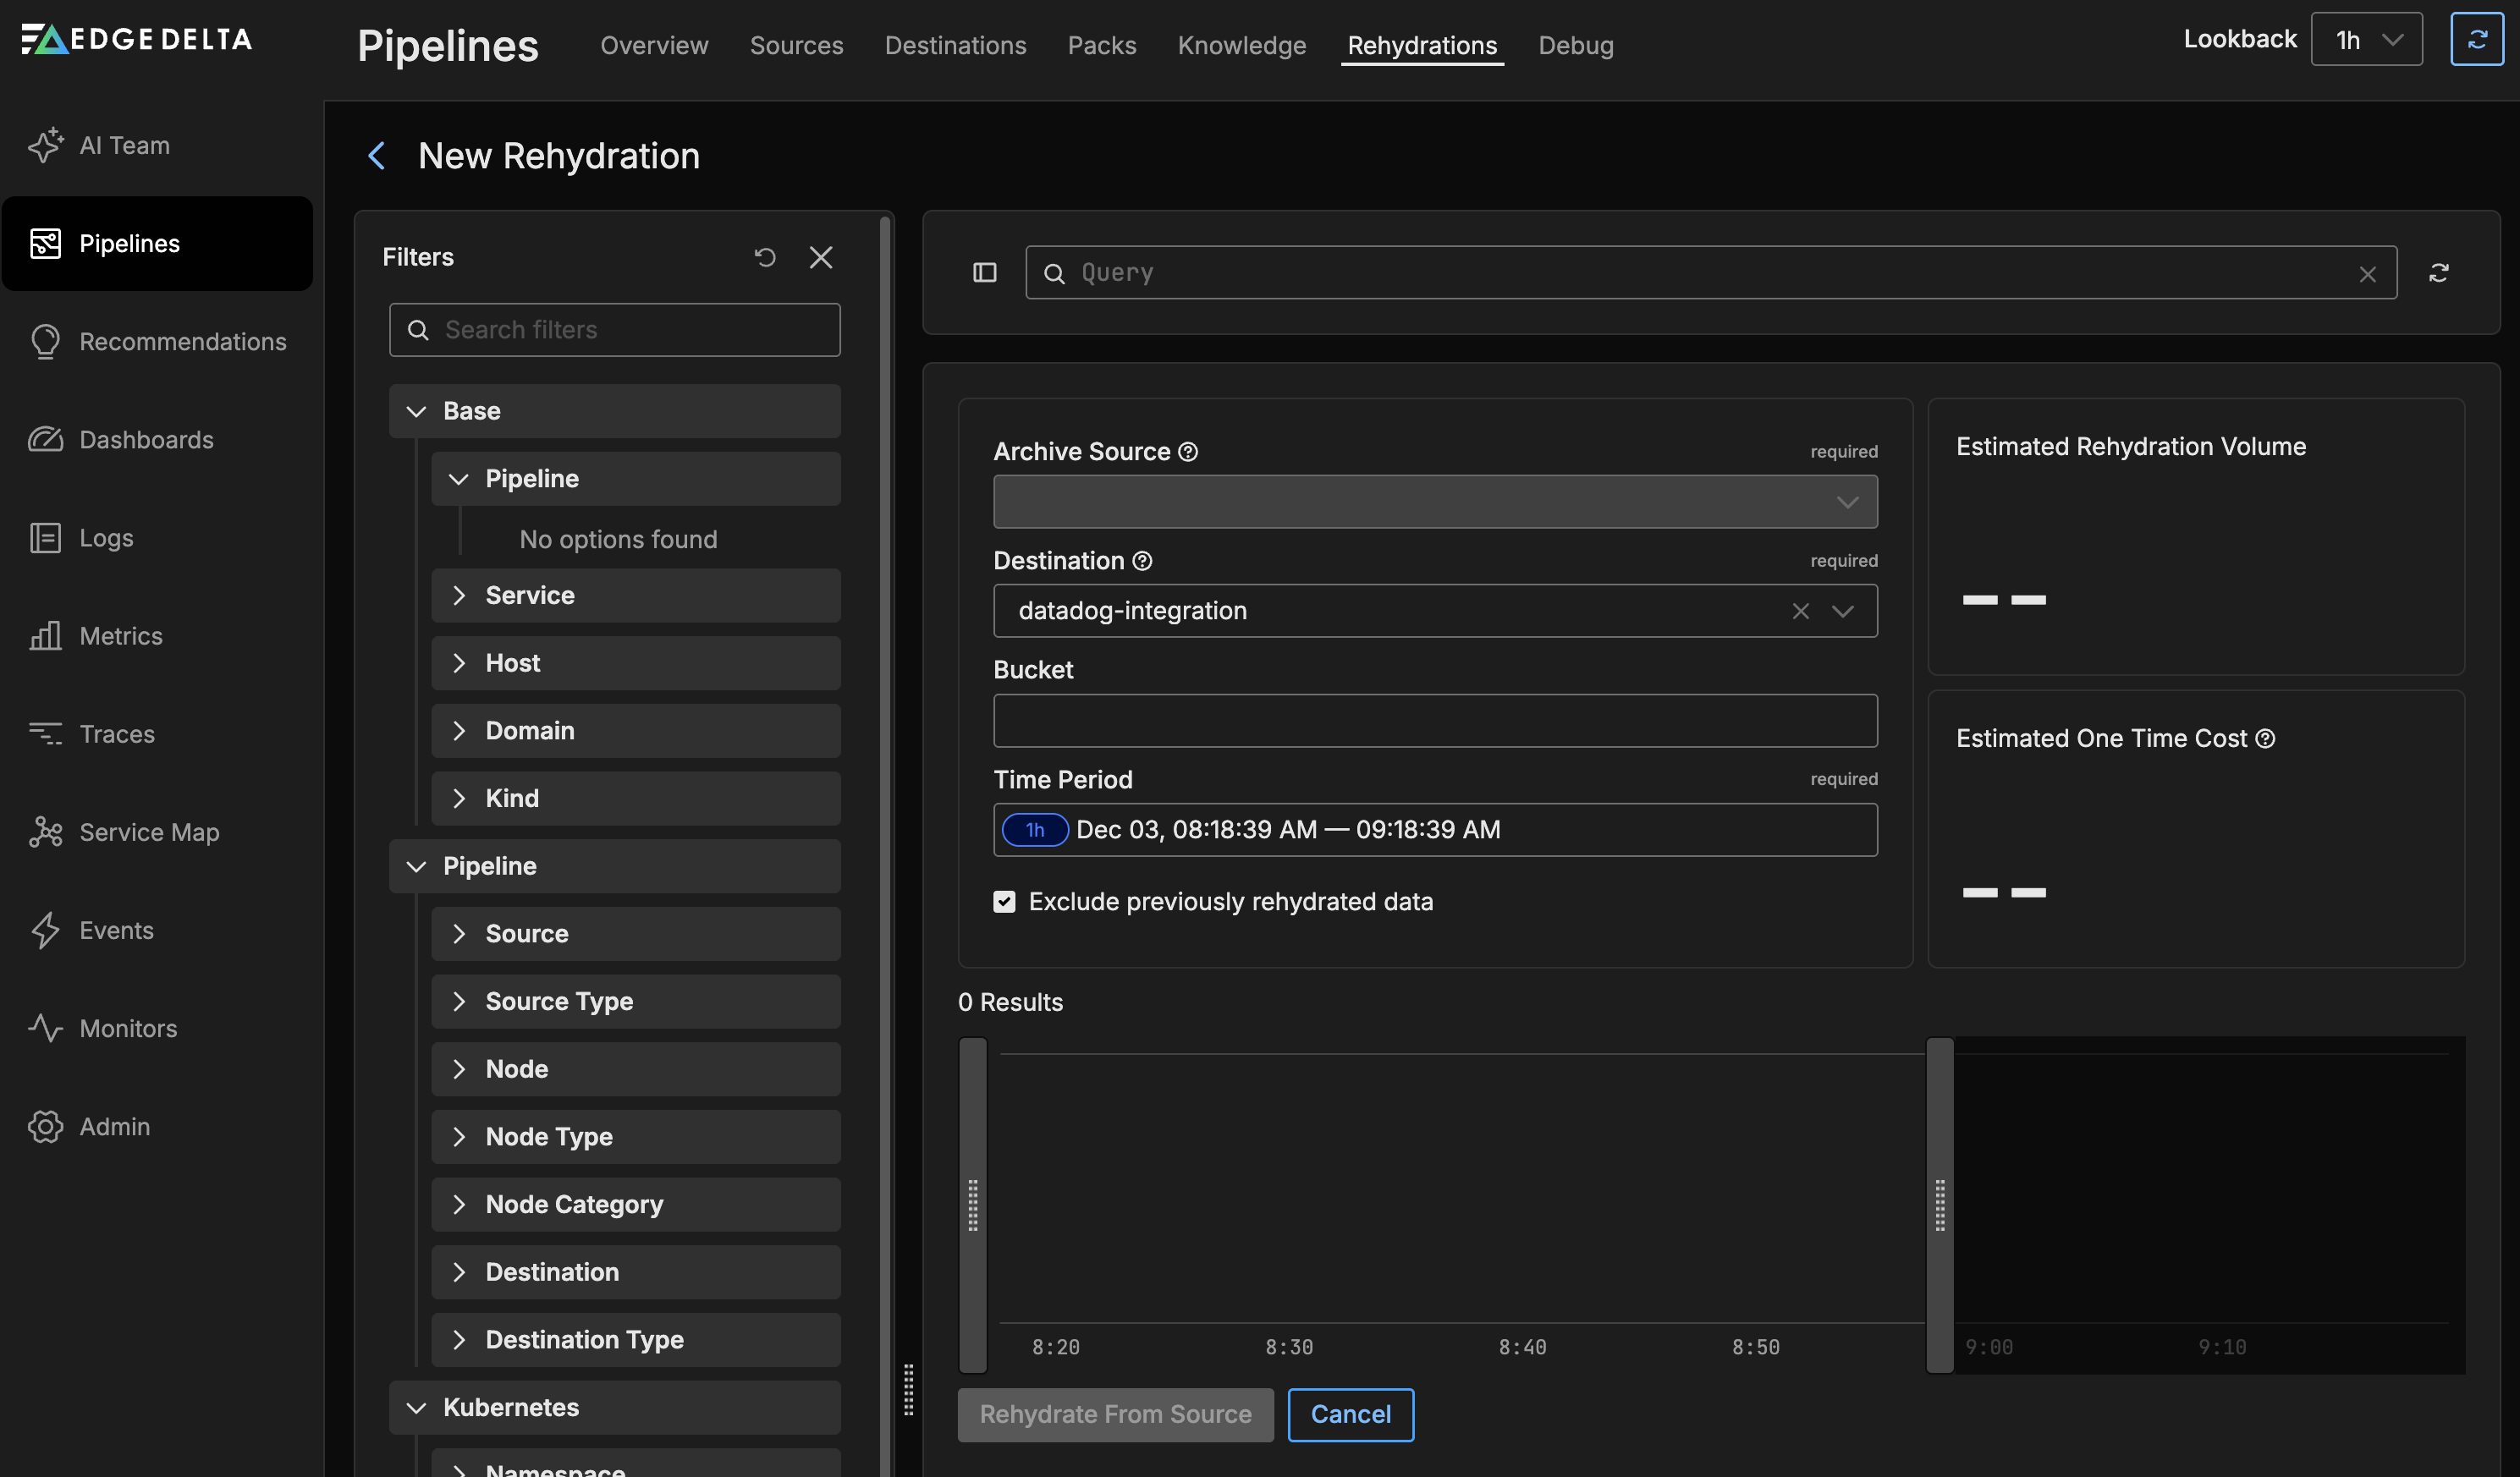
Configure the rehydration:
- Archive Source: Select the archive integration containing your historical logs (S3, GCS, or MinIO)
- Destination: Select where to send the rehydrated logs (Splunk, Elasticsearch, Dynatrace, or Google Cloud Logging)
- Bucket: Specify the storage bucket containing the archived data
- Time Period: Define the start and end time for the logs you want to rehydrate
Review the Estimated One Time Cost indicator. This shows the projected cost based on the rehydration volume multiplied by the pricing configured for the destination.
Optionally, select Exclude previously rehydrated data to skip data that has already been rehydrated in a previous job. This prevents duplicate data and reduces costs.
Click Rehydrate from Source.
Edge Delta begins processing your request. You can monitor progress on the Rehydrations tab.
Rehydration Status
Rehydrations progress through the following states:
| Status | Description |
|---|---|
| Created | Request submitted and queued for processing |
| Invoked | Rehydration Manager has claimed the request |
| In Progress | Workers are actively processing archive files |
| Completed | All files processed successfully |
| Failed | Processing encountered errors exceeding the failure threshold |
Monitor Progress
While a rehydration is running, you can view:
- Bytes Analyzed: Total data read from archive storage
- Bytes Streamed: Data sent to the destination
- Scanned Lines: Number of log lines processed
- Streamed Lines: Number of log lines sent to destination
- Run Time: Elapsed processing time
- Source Throughput: Read rate from archive storage
- Destination Throughput: Write rate to destination
Configure Rehydration Settings
Configure organization-wide rehydration limits to control resource usage and costs.
To access settings:
- Click Pipelines in the navigation bar.
- Select the Rehydrations tab.
- Click Settings.
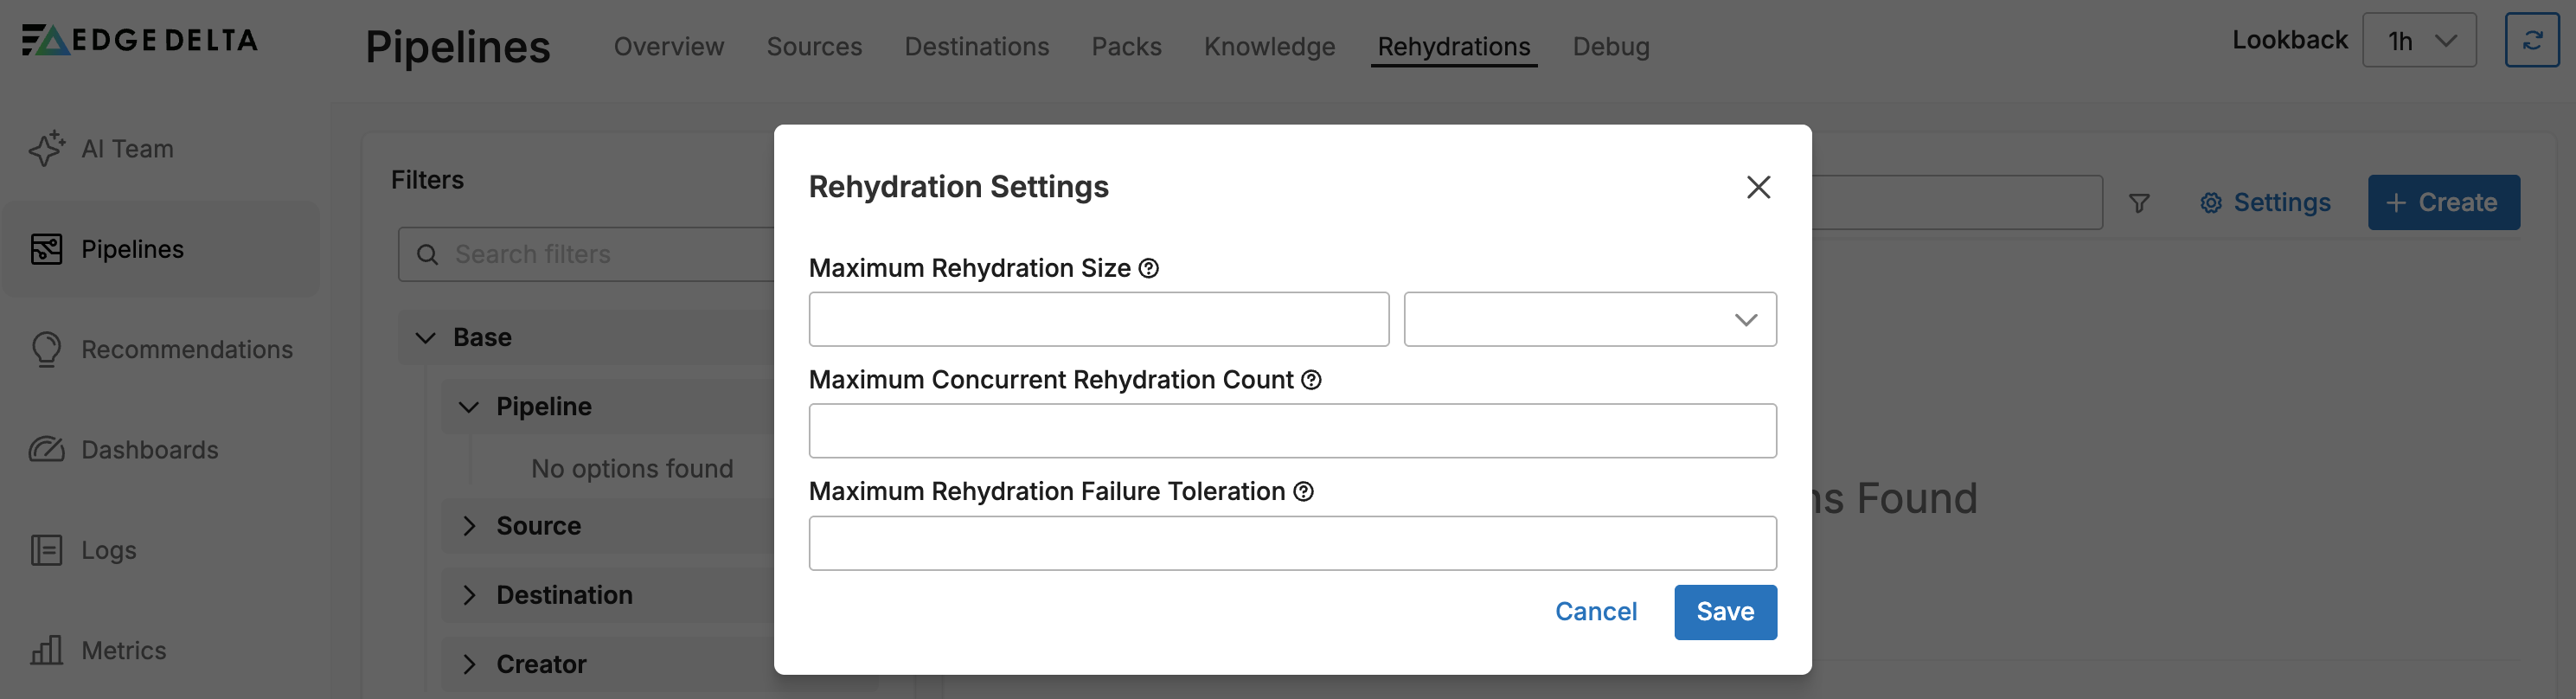
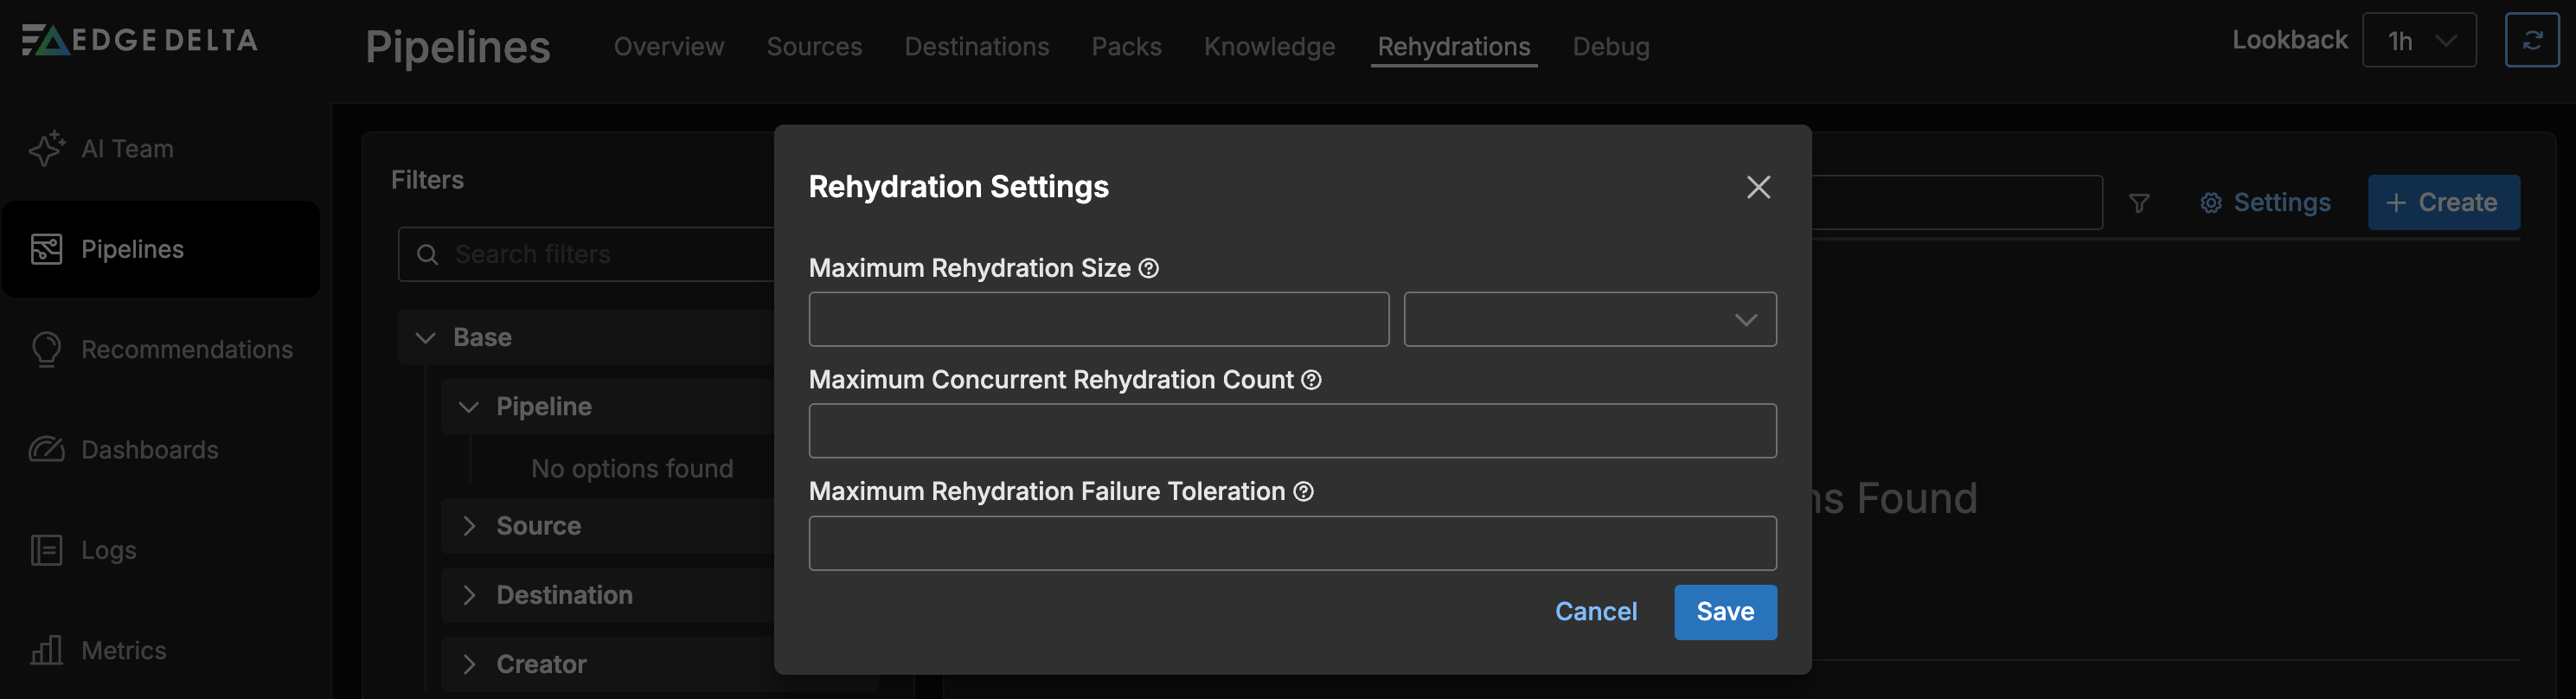
Available Settings
| Setting | Description |
|---|---|
| Maximum Rehydration Size | The maximum data size for a single rehydration job. Leave empty for no limit. |
| Maximum Concurrent Rehydration Count | The number of rehydration jobs that can run simultaneously across your organization. This is applied organization-wide. |
| Maximum Rehydration Failure Toleration | The failure percentage at which a rehydration is marked as failed. For example, if set to 10%, a rehydration with more than 10% failed tasks is considered a failure. |
You can also configure Mapping Rules to auto-populate source and destination fields based on your CQL query.
Best Practices
Use specific time ranges: Narrow time ranges reduce processing time and costs. If you need data from a long period, consider breaking it into multiple smaller rehydrations.
Leverage the exclude option: When re-running rehydrations or extending time ranges, use “Exclude previously rehydrated data” to avoid duplicates and reduce processing time.
Review the cost estimate: Before starting large rehydrations, review the estimated cost to ensure it aligns with your budget.
Monitor destination capacity: Large rehydrations can generate significant traffic to your destination. Ensure your Splunk, Elasticsearch, or other destination can handle the incoming data volume.
Schedule during off-peak hours: For very large rehydrations, consider running them during periods of lower system usage.
Start small and scale up: When first using rehydration, start with a small time range to verify the configuration works correctly before processing larger datasets.
Troubleshooting
Rehydration Stuck in Created State
The rehydration manager may not be running or may not be able to connect to the Edge Delta API. Check:
kubectl logs -n edgedelta-rehydration deployment/rehydration-manager
Rehydration Fails Quickly
Check worker logs for errors reading from archive storage or pushing to destination:
kubectl logs -n edgedelta-rehydration -l app=rehydration-worker --tail=100
Common issues:
- Invalid archive credentials
- Destination endpoint unreachable
- Destination API token expired
Slow Performance
If rehydration is running slower than expected:
- Check if workers are scaling up:
kubectl get pods -n edgedelta-rehydration -l app=rehydration-worker - Verify KEDA is monitoring the queue:
kubectl get scaledobjects -n edgedelta-rehydration - Review worker resource utilization to identify bottlenecks
- Consider increasing
maxReplicaCountin the autoscaler configuration
High Failure Rate
If many tasks are failing:
- Check worker logs for specific error messages
- Verify destination is accepting data and not rate-limiting
- Check for network connectivity issues between workers and destination
- Review the Maximum Rehydration Failure Toleration setting