Edge Delta Logs
Explore log management options in the Edge Delta web application, including search, sharing, and facet creation.
5 minute read
Overview
Edge Delta’s Logs page provides tools for searching, filtering, and analyzing your log data. Queries are powered by the Common Query Language (CQL).
Query Language
See the CQL Reference for complete documentation on search syntax, including:
- Full text and attribute search
- Boolean operators (AND, OR, NOT)
- Wildcards and exact matching
- Comparison operators for numeric values
Search Page
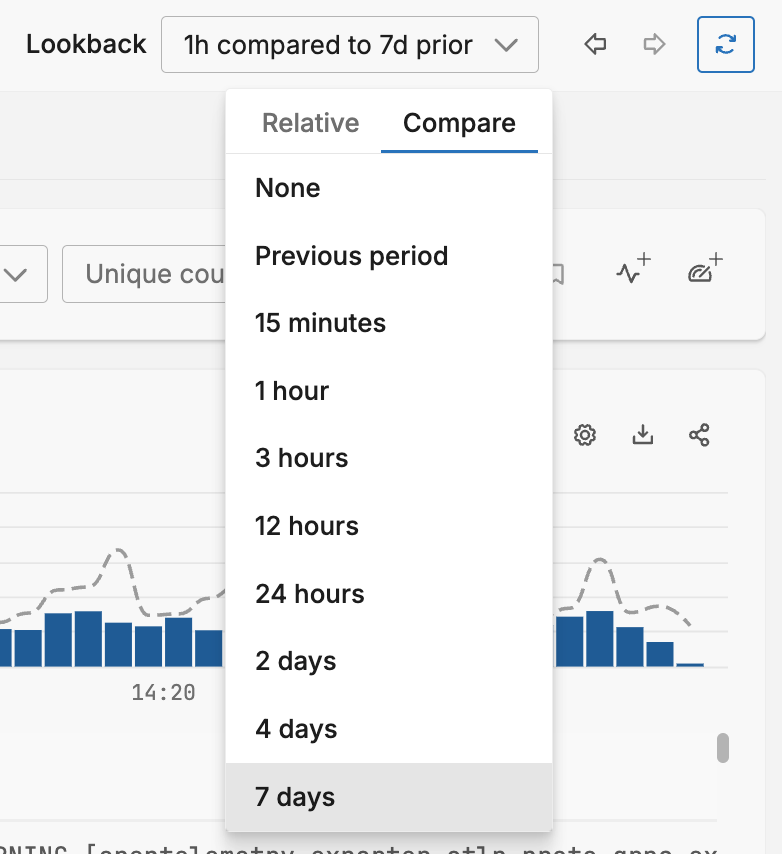
To view logs you click Logs and the Search tab opens.
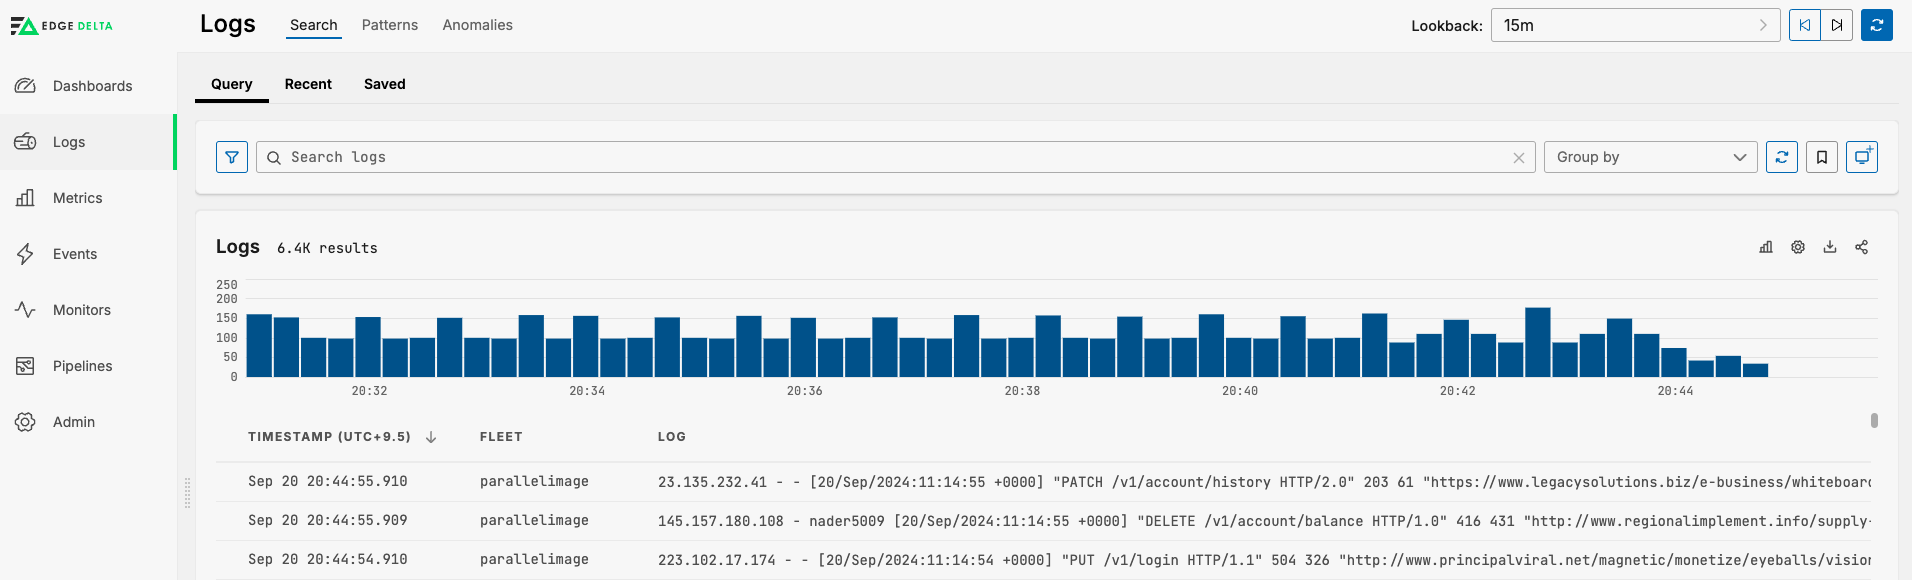
You can select the Lookback period and the comparison period. The comparison period takes the average of lookback intervals for the given period and this is rendered as the line in the graph:
Search Tips
Use the Filters Panel
The Filters panel on the left side of the Logs page lists indexed fields organized by category: Base, Kubernetes, Amazon ECS, and Docker. Click a filter value to build the correct CQL query automatically. This ensures proper field names and delivers faster results than free-text searches.
Use Indexed Field Names
When you write CQL queries manually, use the indexed field names listed in the Filters panel. These fields are optimized for search performance.
| Instead of | Use |
|---|---|
@kubernetes.namespace | k8s.namespace.name |
@kubernetes.container.name | k8s.container.name |
@kubernetes.pod.name | k8s.pod.name |
Fields listed under Base, Kubernetes, Amazon ECS, and Docker in the Filters panel are indexed. Queries against indexed fields return results faster than free-text searches or queries against non-indexed attributes.
Refine Broad Searches
Start with a broad full-text search, then narrow your results using facet filters or field-based CQL syntax. For guidance on creating and using custom facets, see Effectively Using Facets.
Share Queries
Click the Share button to copy a shortened URL to the clipboard that you can share with others to view the same query. If you have a relative Lookback filter selected, such as the previous 15 minutes, the same relative duration will be shared. This means that someone viewing the shared query will see the previous 15 minutes from the moment they open the query. If you shared a query with a custom lookback period, the same period will be shared. Someone viewing this type of query will view the same log results from that particular time window, for example during a critical outage event.

Download Results
Click the Download button to download up to 20,000 rows of the log search page as a CSV file or a JSON formatted file.

If you select CSV, only the currently visible columns are downloaded. If you select JSON, all columns are downloaded.
Save Queries
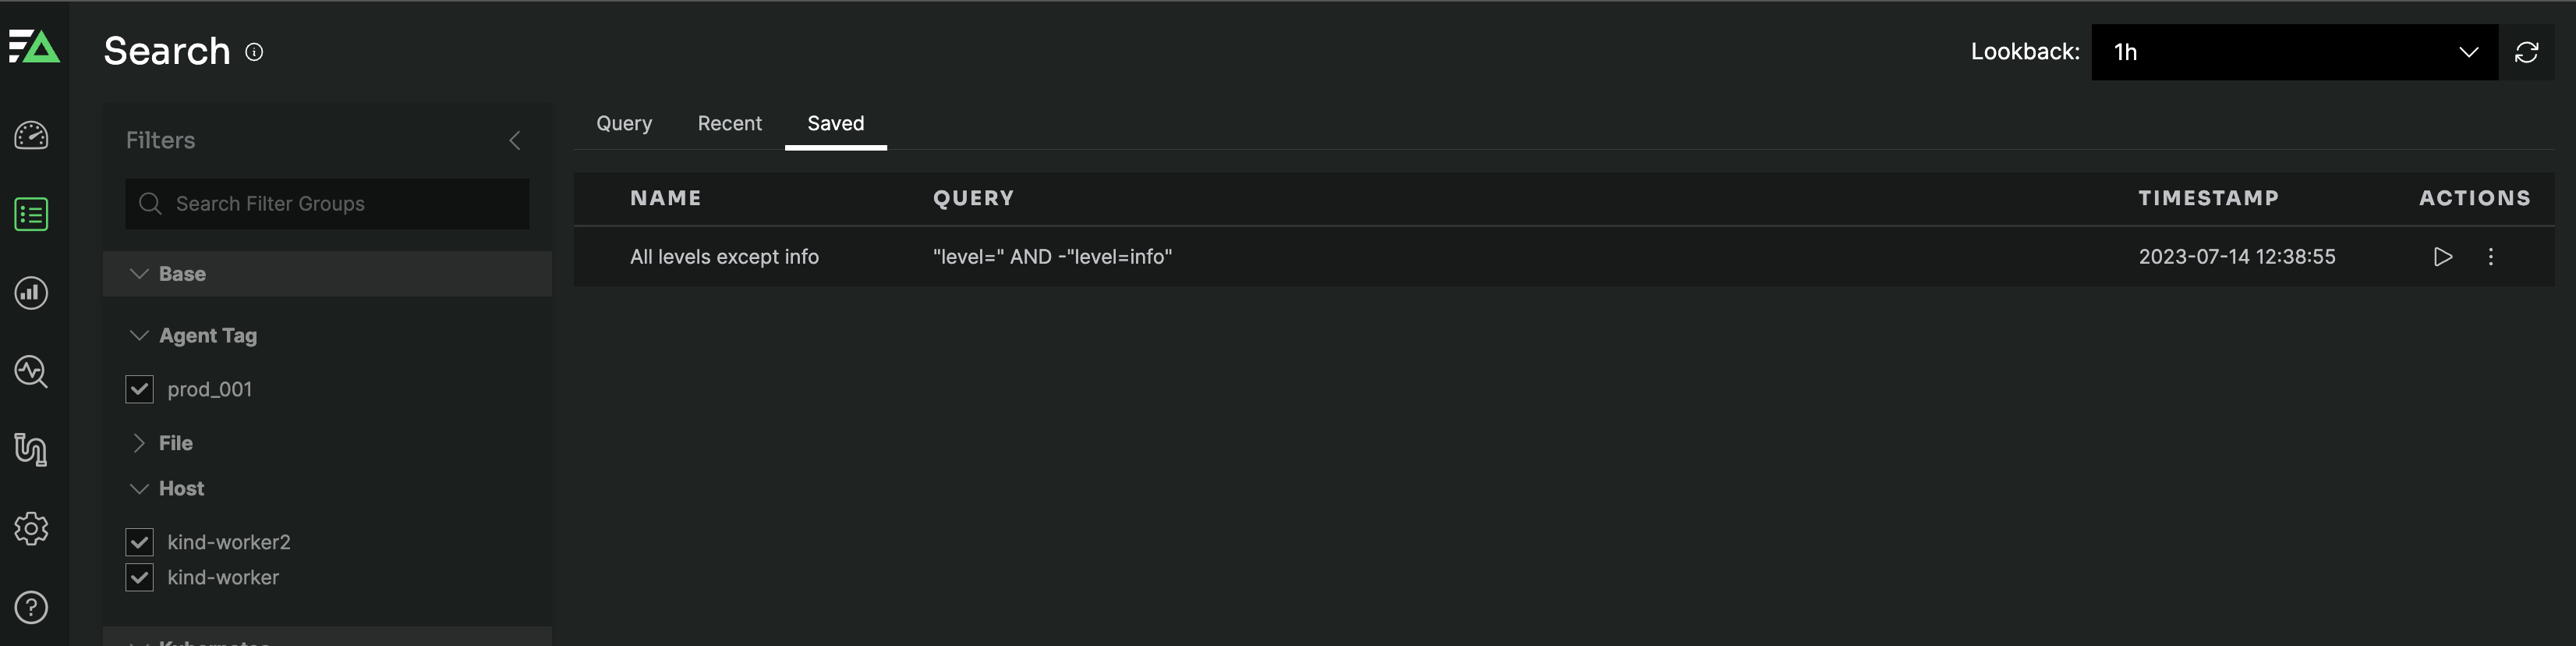
Click the Save Query button next to the search button to save your query. You provide a name and click Save.

Saved queries and queries shared by users in your organization are listed in the Saved tab:
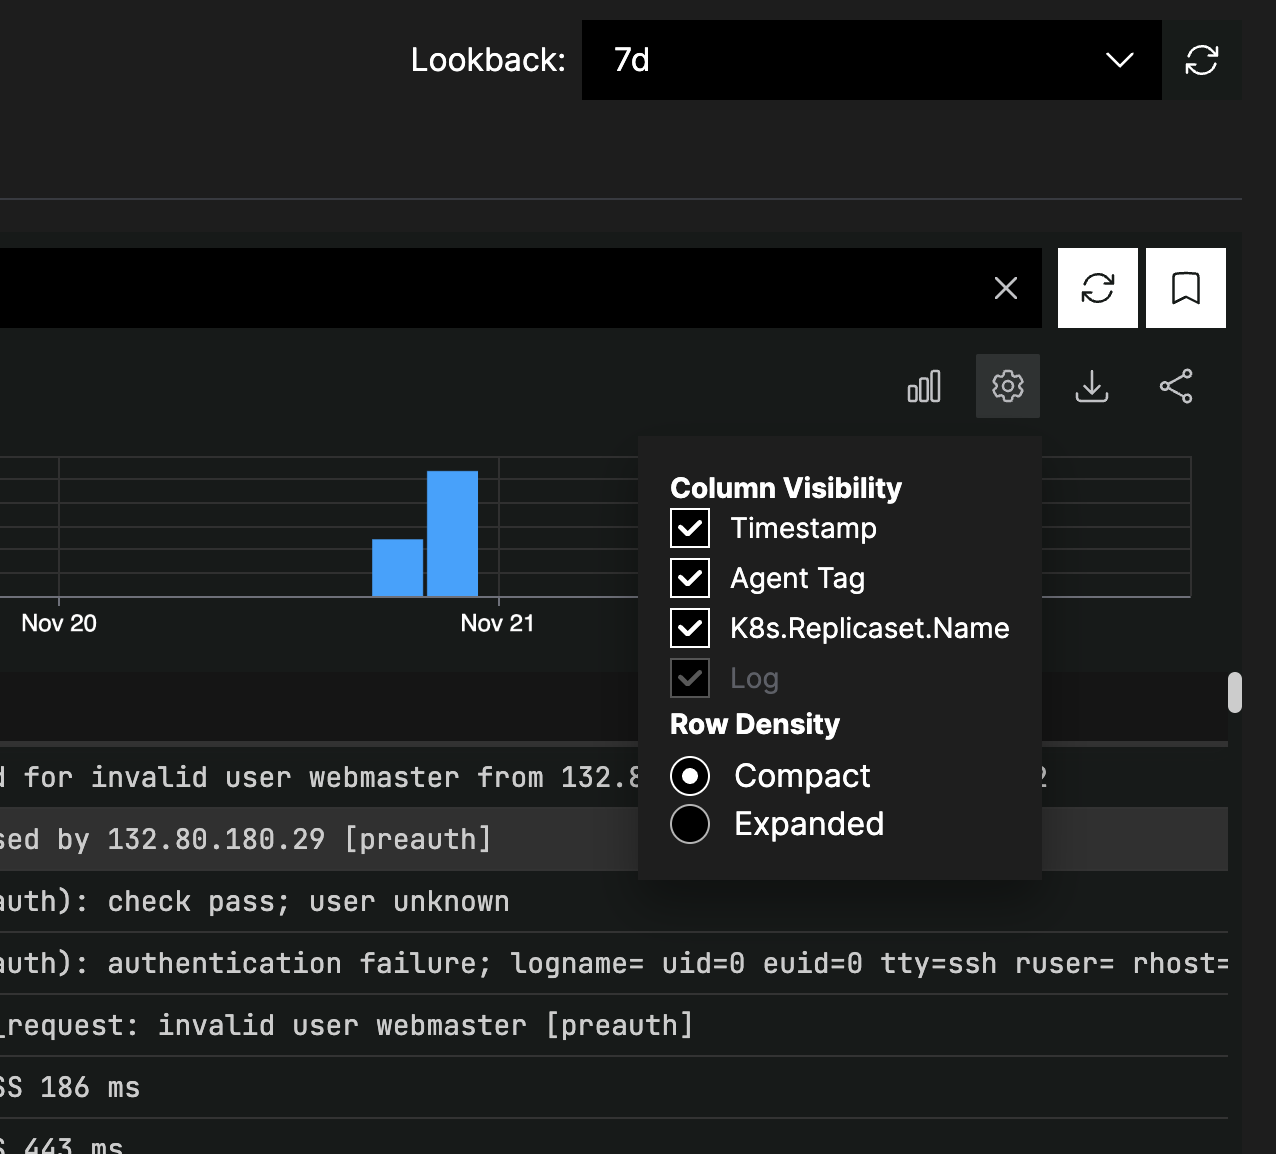
View Log Options
Click Settings and select the Expanded option to adjust the search results display method:
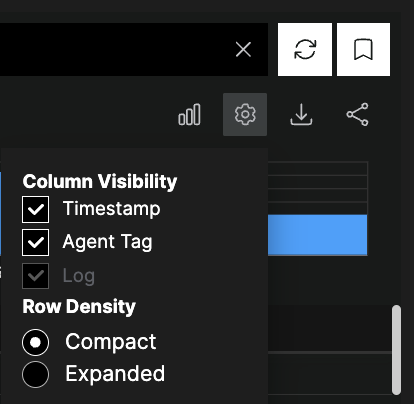
Expanded shows the search results in an expanded style with the default line breaks and indentation:
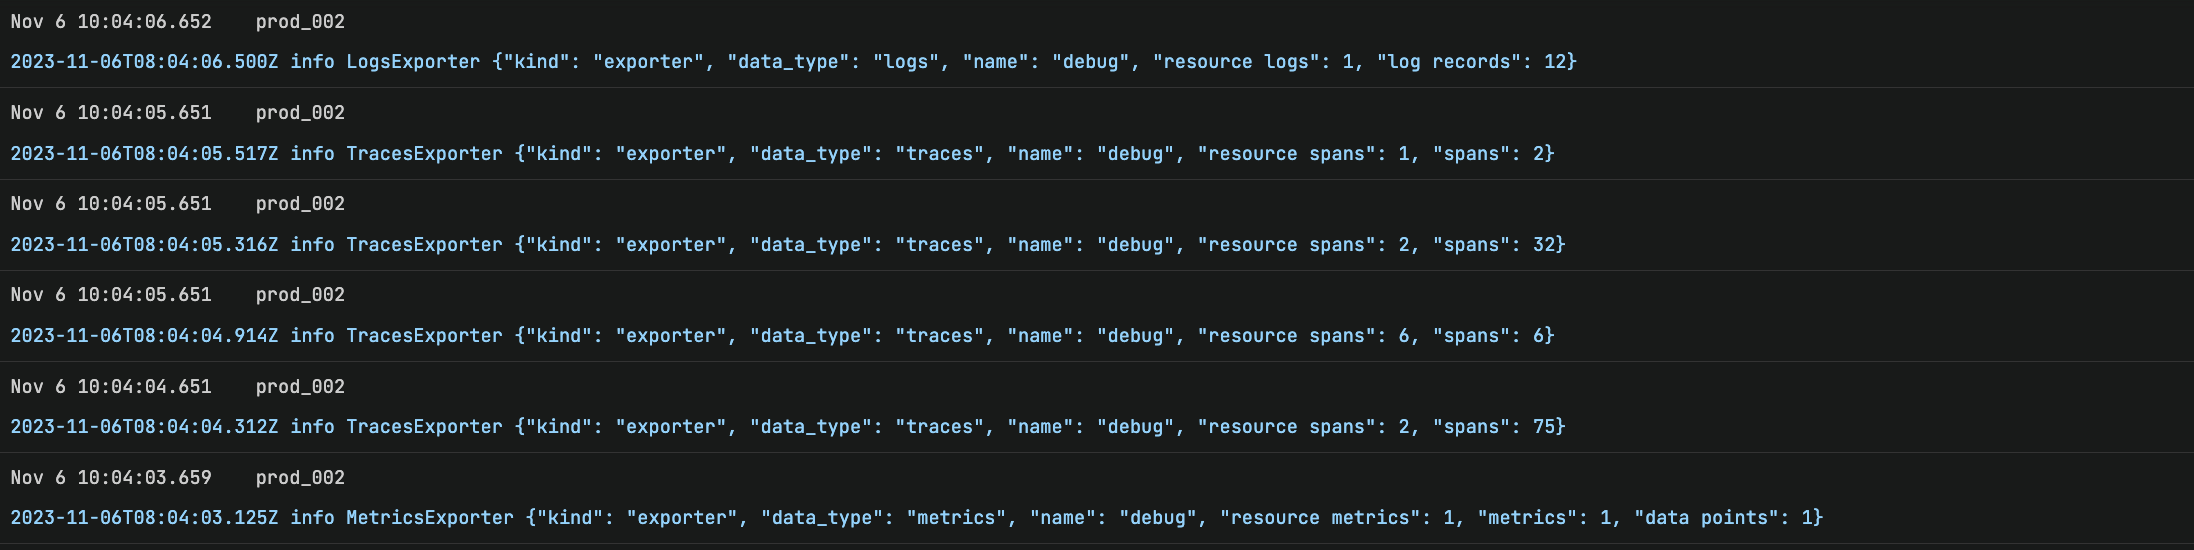
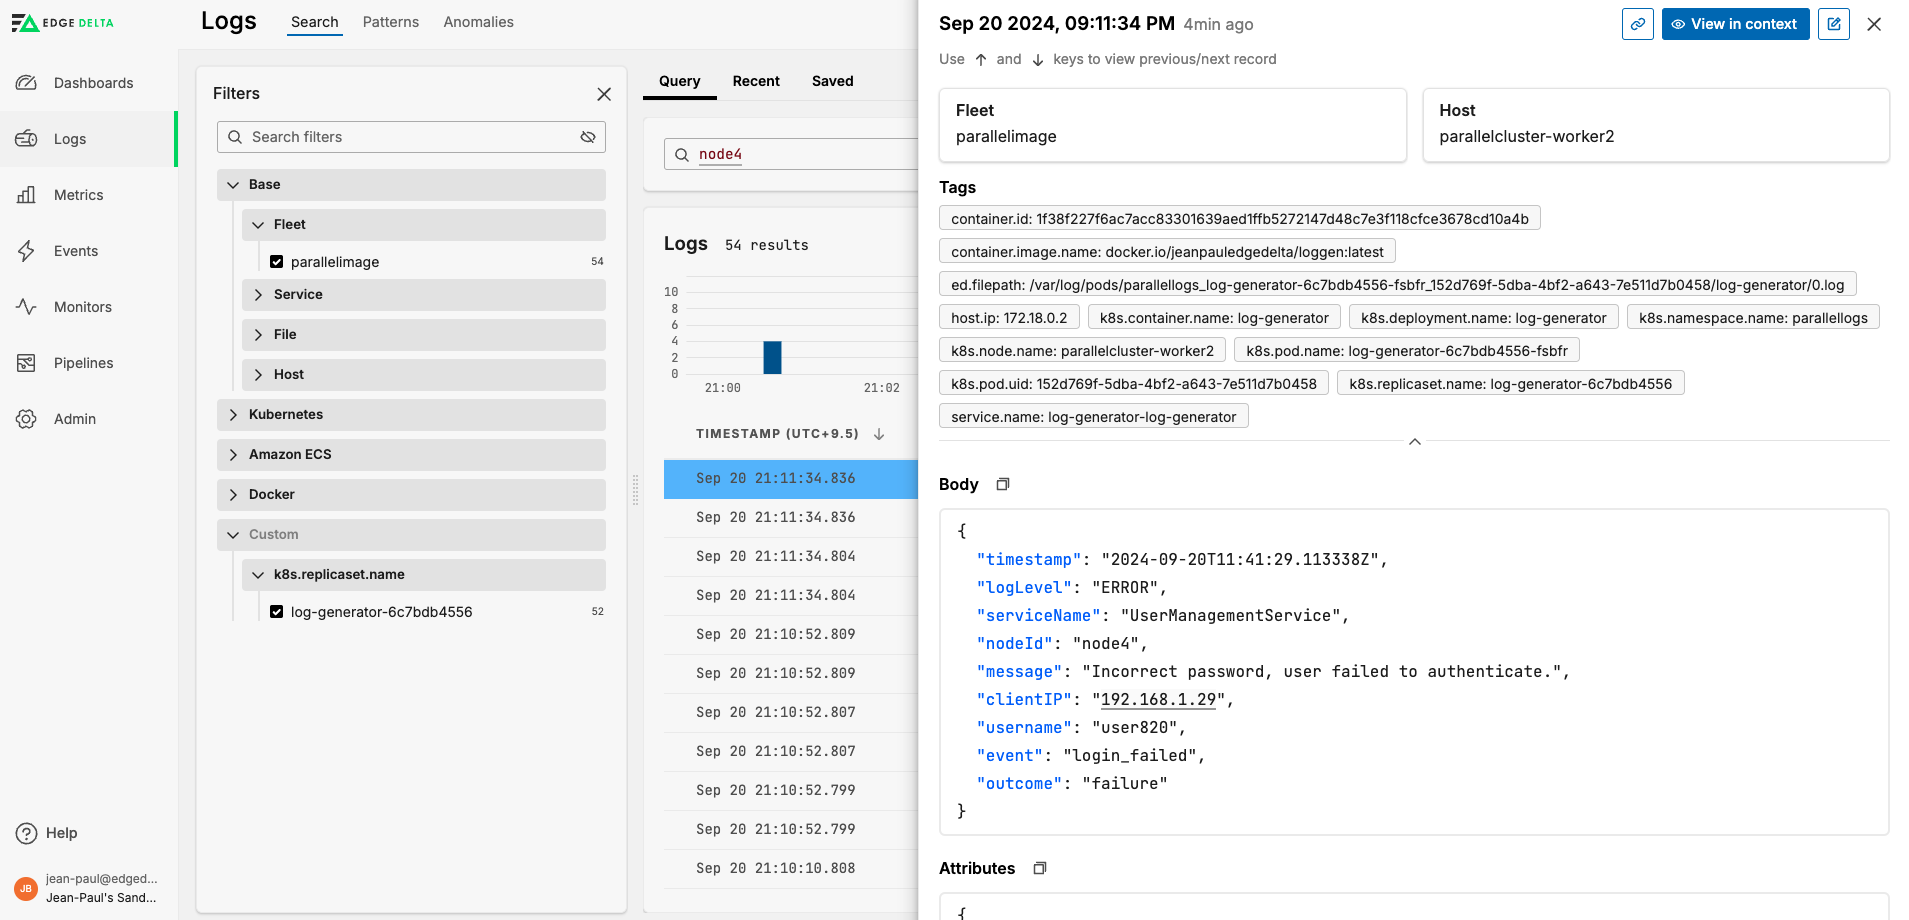
Click a log in the search results to see more details about it in a side pane.
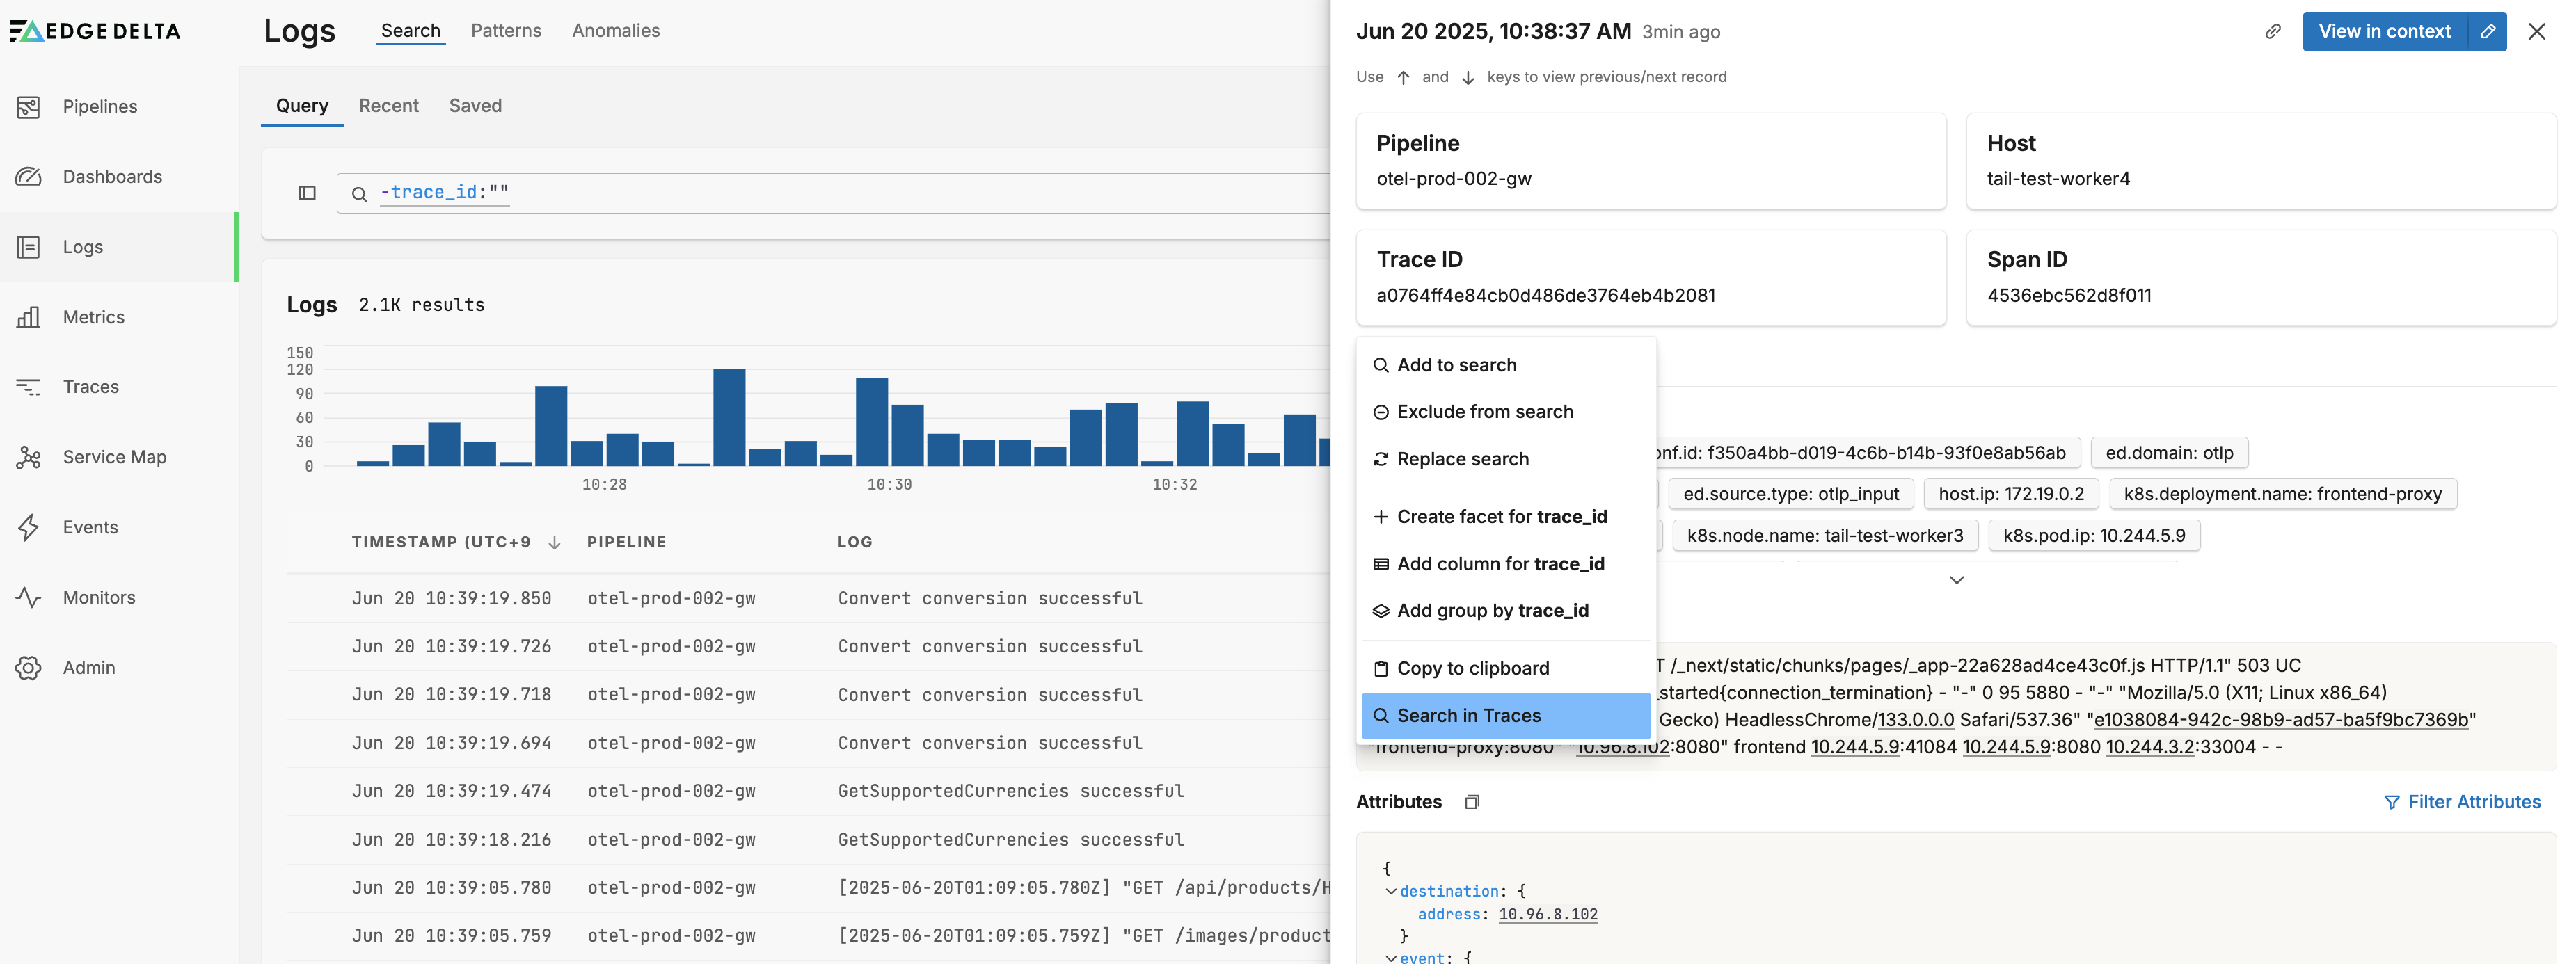
You can view associated traces by selecting the trace or span ID.
Add Facets
A facet is a lens through which you view your data.
It groups similar types of data to provide an overview at a glance. For example, if a metric you are analyzing has various attributes (or dimensions), such as HTTP methods (GET, POST, etc.), a facet allows you to group by this attribute to see metrics averaged or summed per method. In contrast, a dimension is an attribute or characteristic of data that can be segmented or filtered. For comprehensive guidance on implementing and optimizing facets, see Effectively Using Facets.
Add Facet from Item Details
You can add a custom facet to the filter widget from the item details pane. In this example a log is open.
Select a tag and click Create facet.
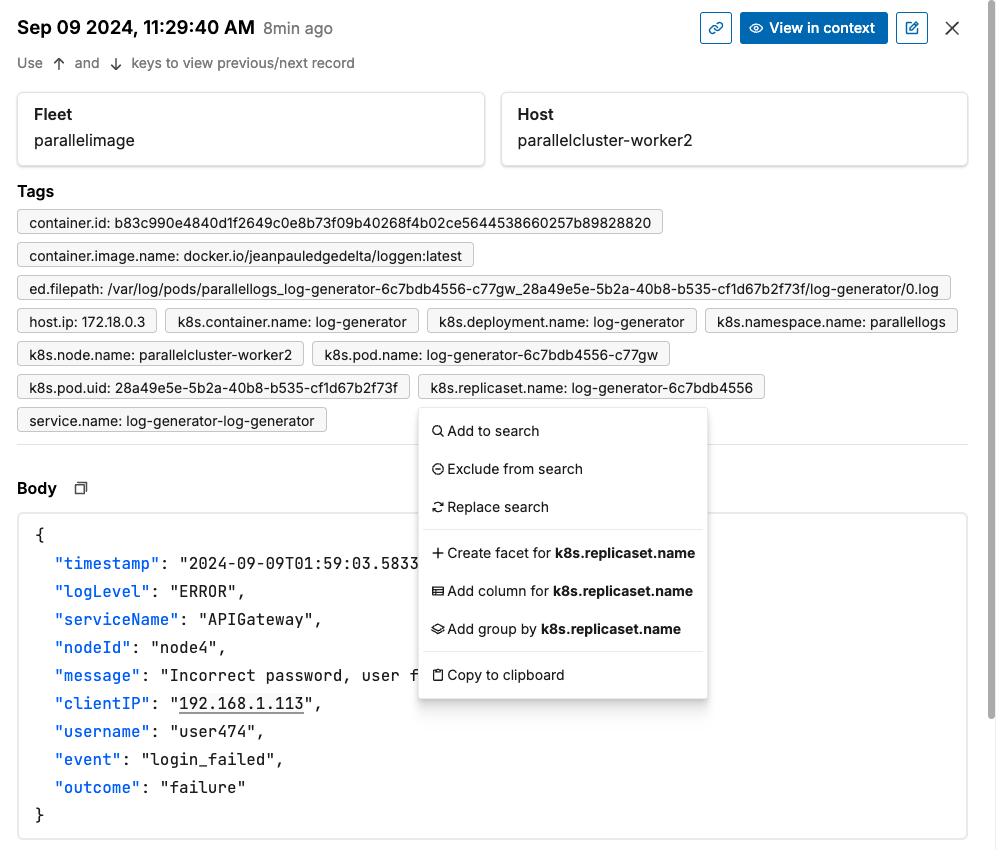
The new facet is added to a Custom group in the filter widget.
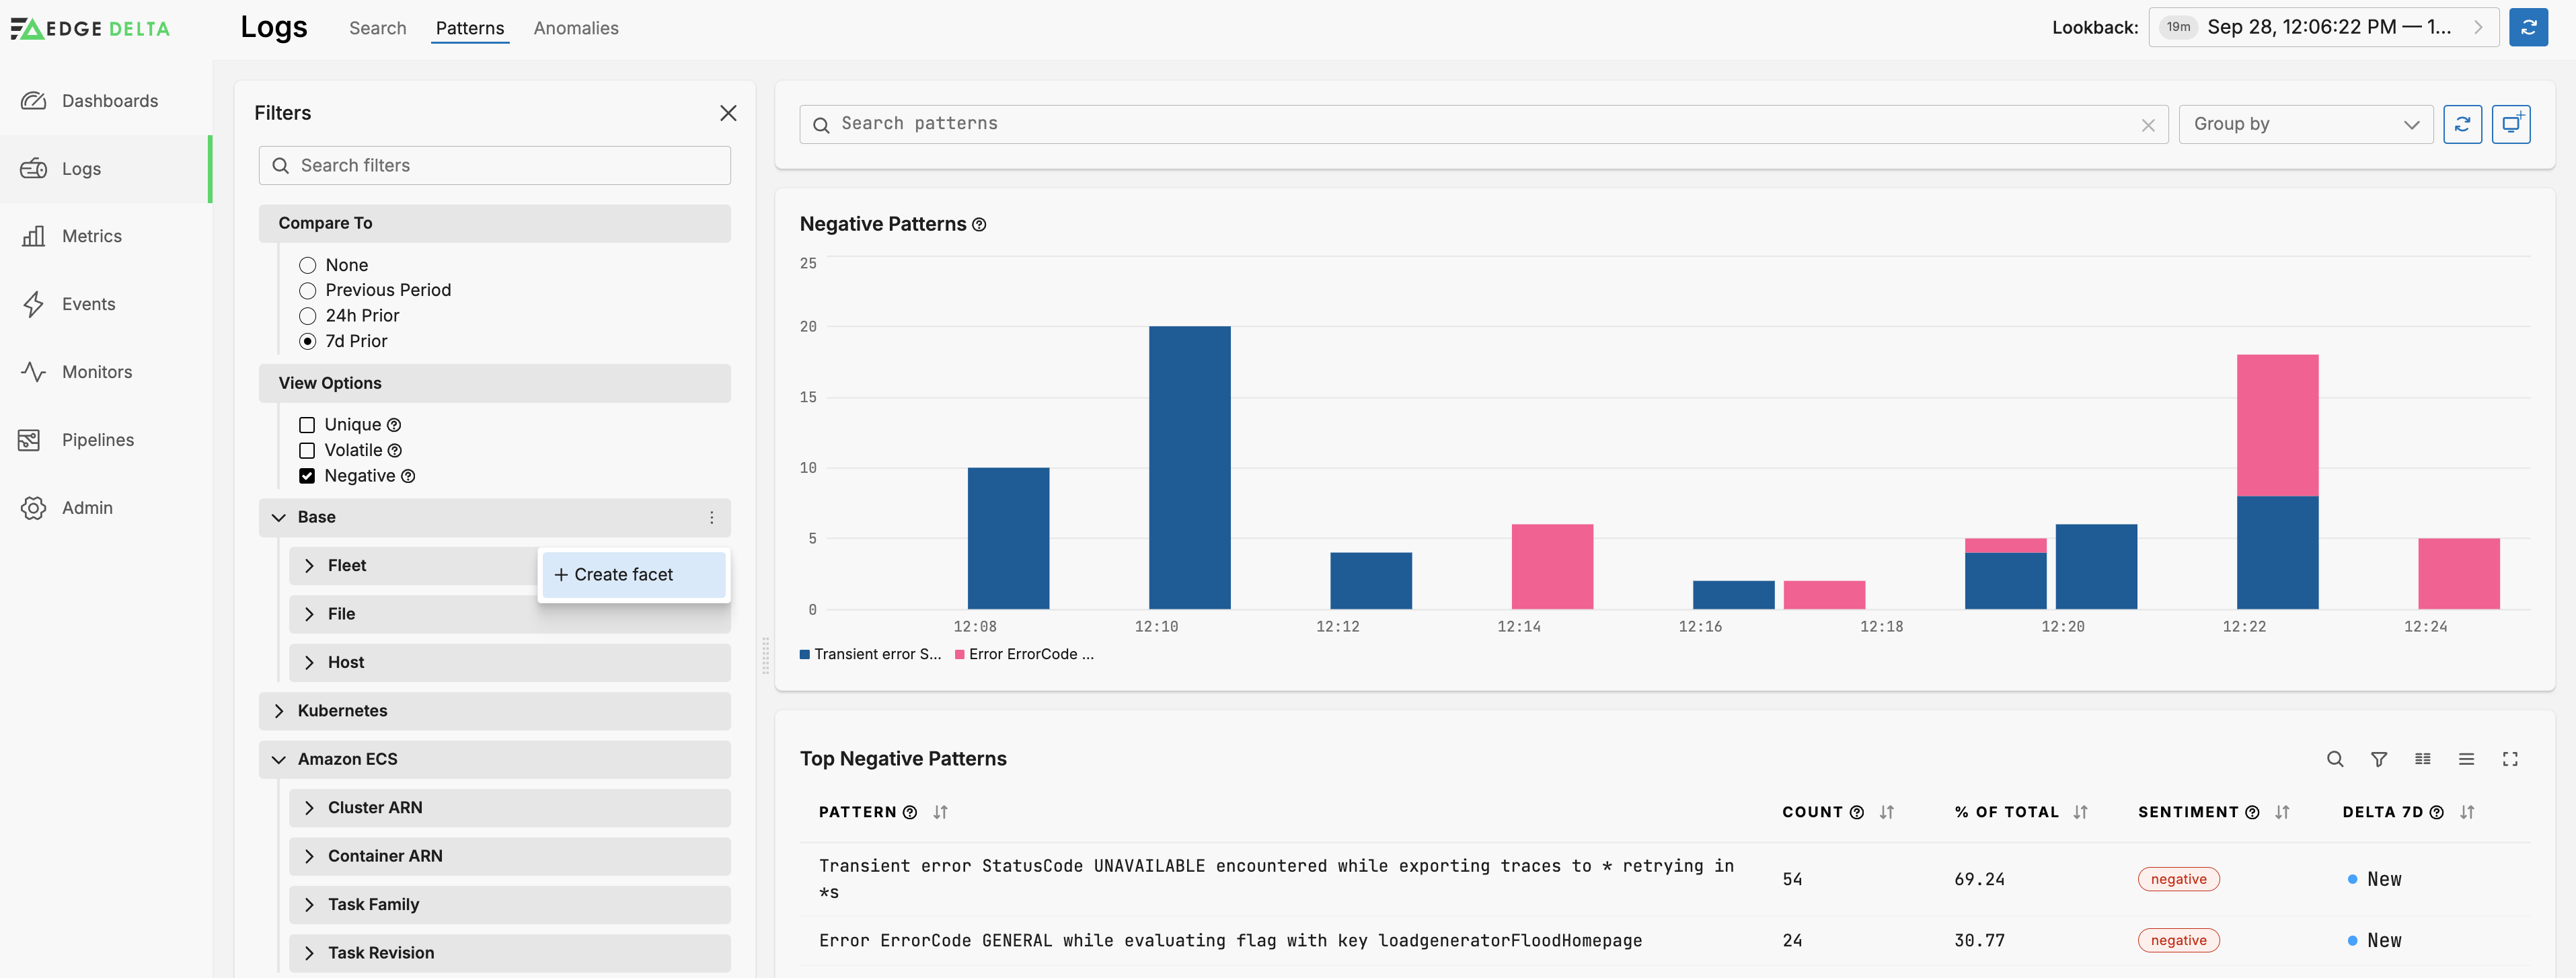
Add Facet from Filter Pane
You can add a custom facet to the filter widget from the Filter pane. In this example the Patterns Explorer is open.
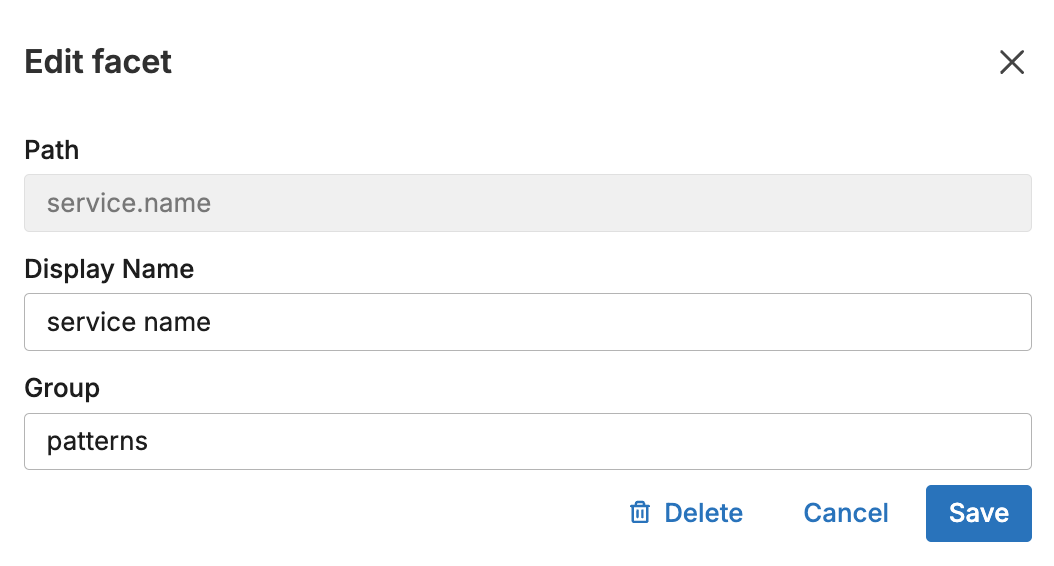
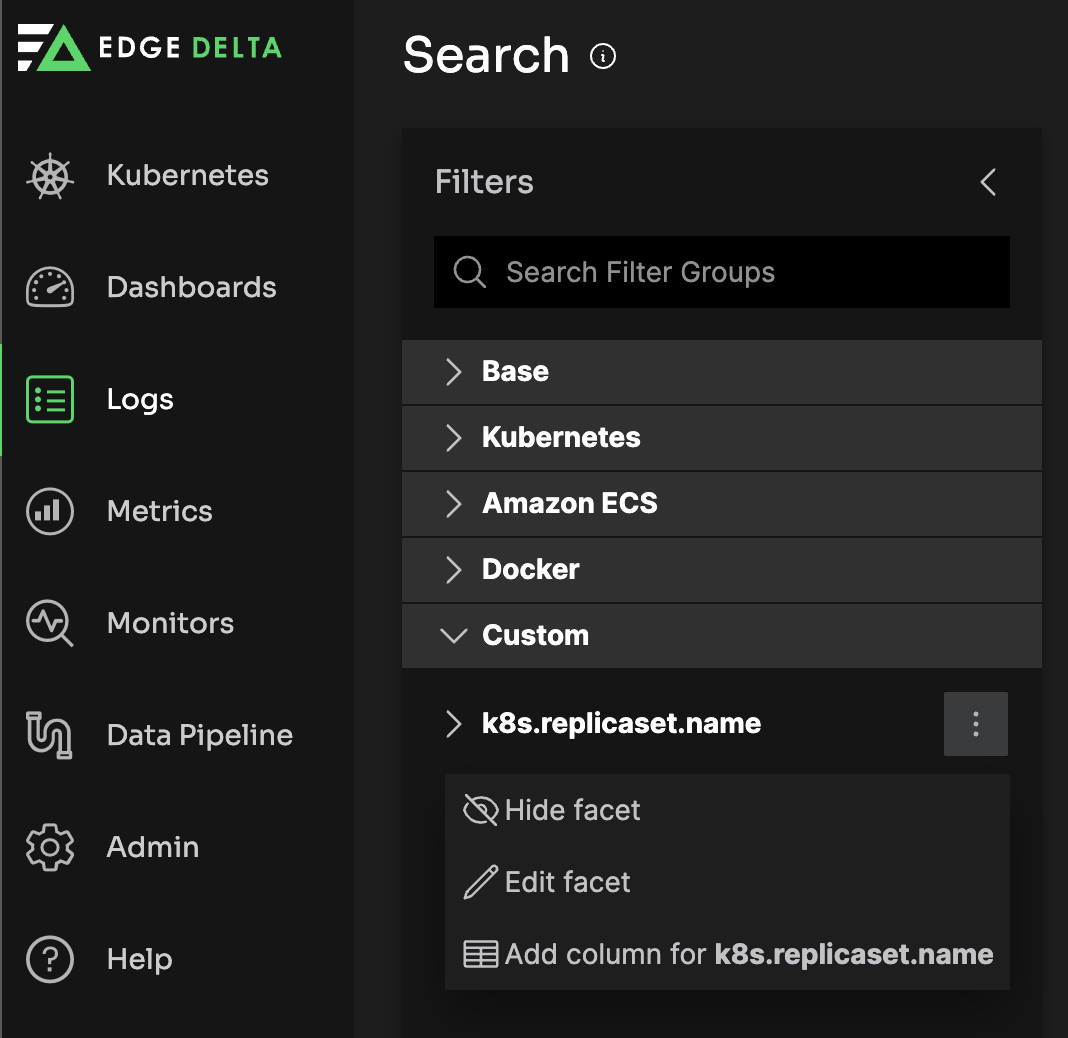
Click one of the kebab icons on a group and select Create Facet.
You specify a dimension, for example, the group by parameter you set in the Log to Pattern node.
Metric Facet Example
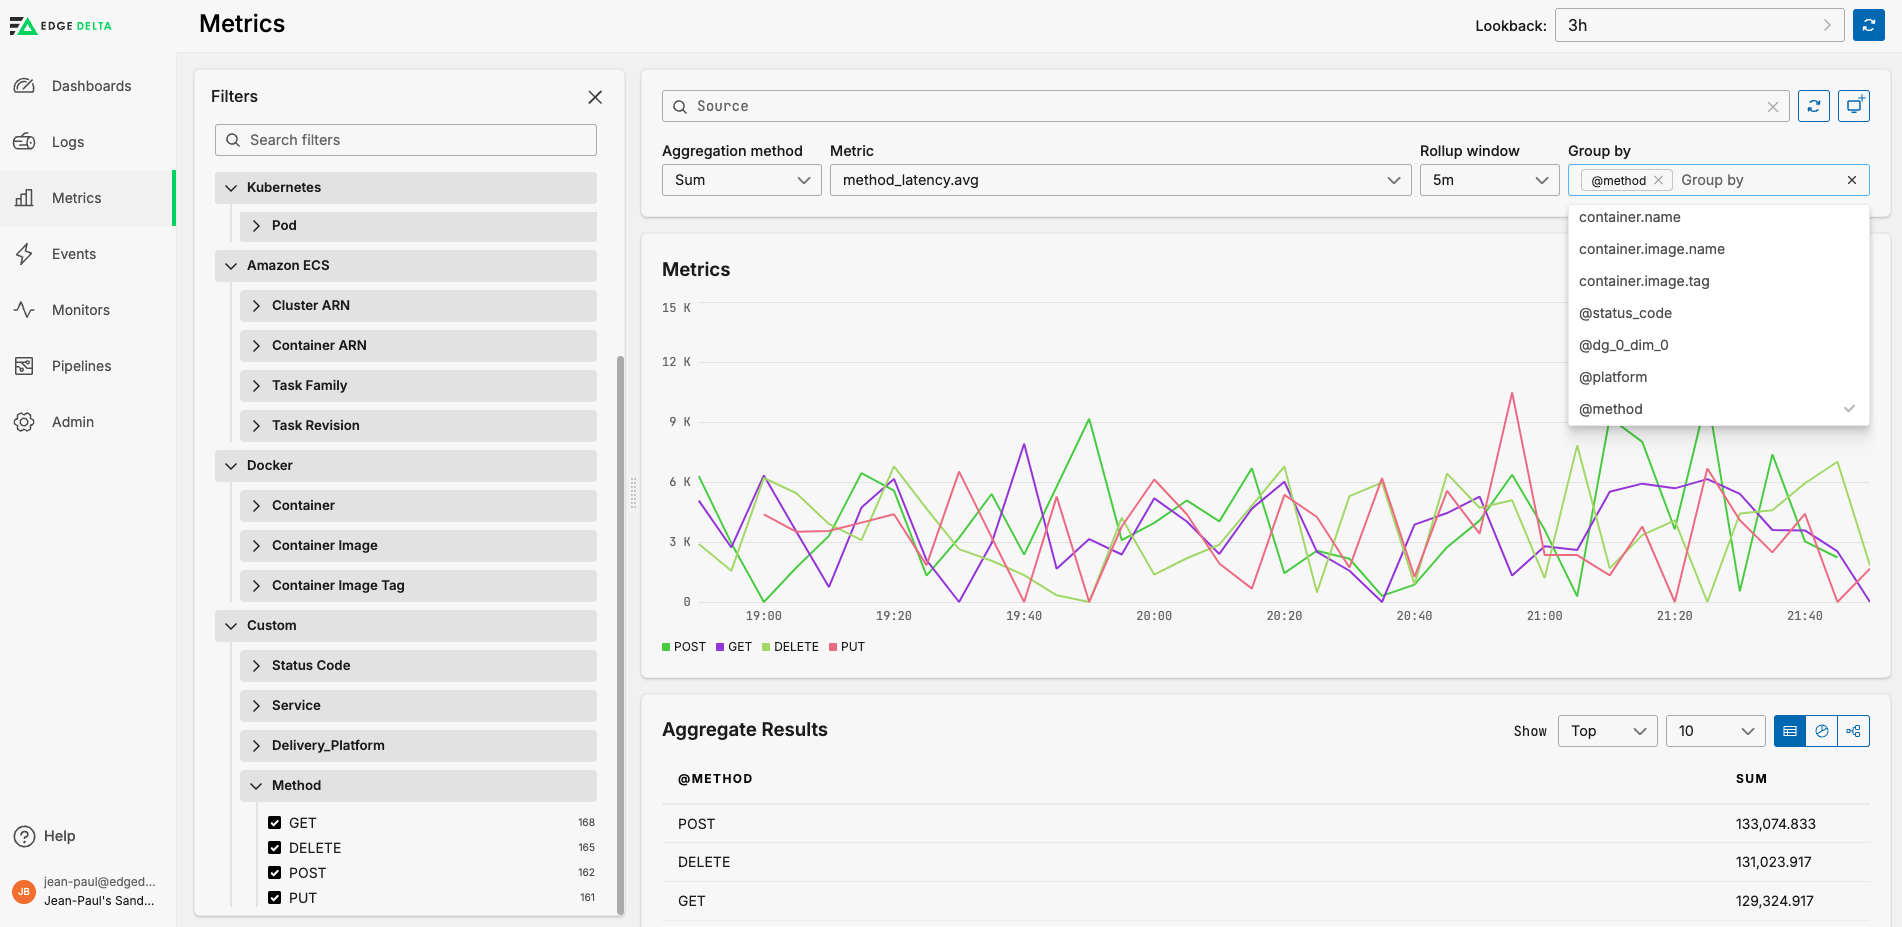
If the metric you select has multiple dimensions you can create a custom facet to group by. For example, suppose you have a log to metric node that captures the average latency per HTTP method and generates a metric like the following:
{
  "_stat_type": "avg"
  "_type": "metric"
  "attributes": {
    "method": "GET"
  }
  "gauge": {
    "value": 1051
  }
  "kind": "gauge"
  "name": "latency_per_method_latency.avg"
  "resource": {...}
  "start_timestamp": 1714124367305
  "timestamp": 1714124427305
  "unit": "1"
}
The dimension method is captured as an attribute, and in this instance the average latency is for the GET method.
- Click the three dots on any facet group and select Create Facet.
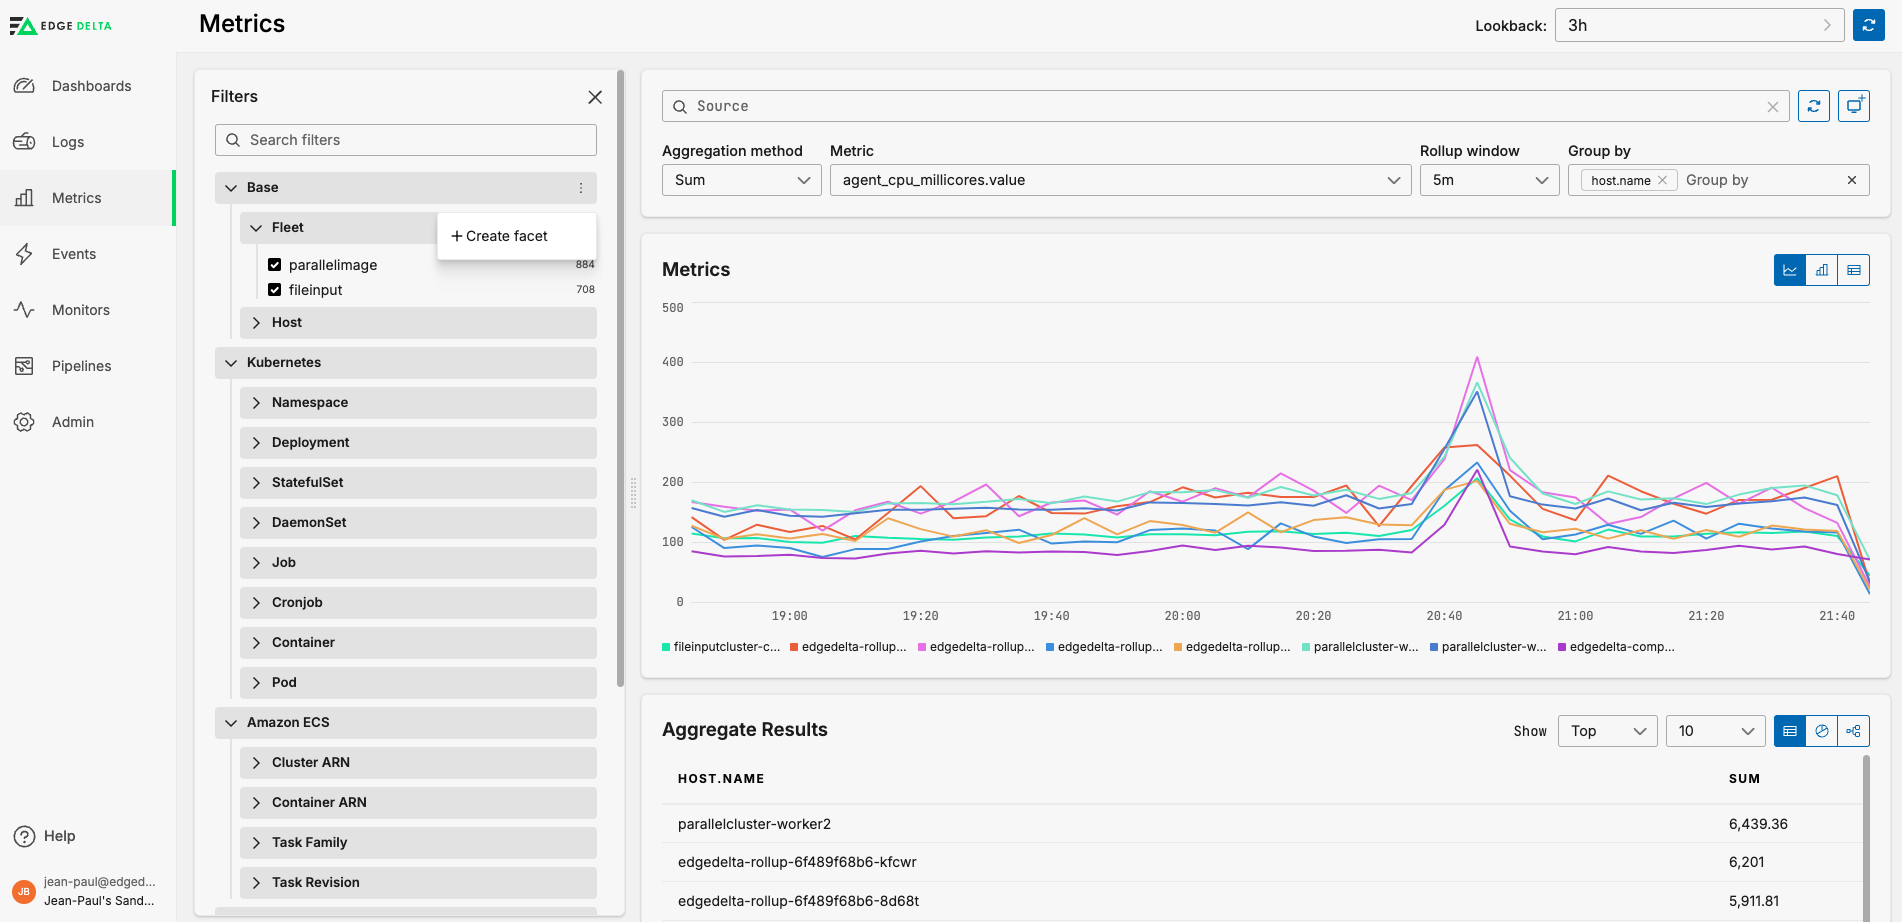
- Specify the dimension name prefixed with an
@character, in this instance@method.
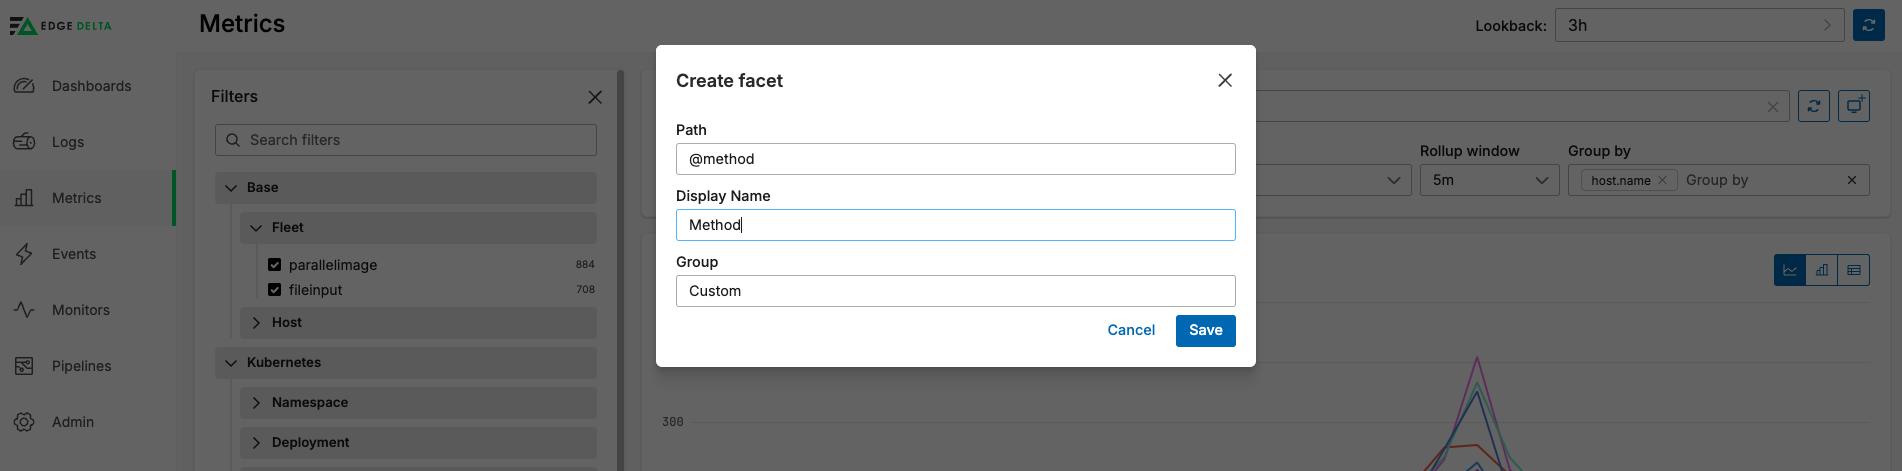
With the multi-dimension metric specified in the Metric field, you can select the facet in the Group By list, and you can filter by the facet in the Filters pane.
Group by
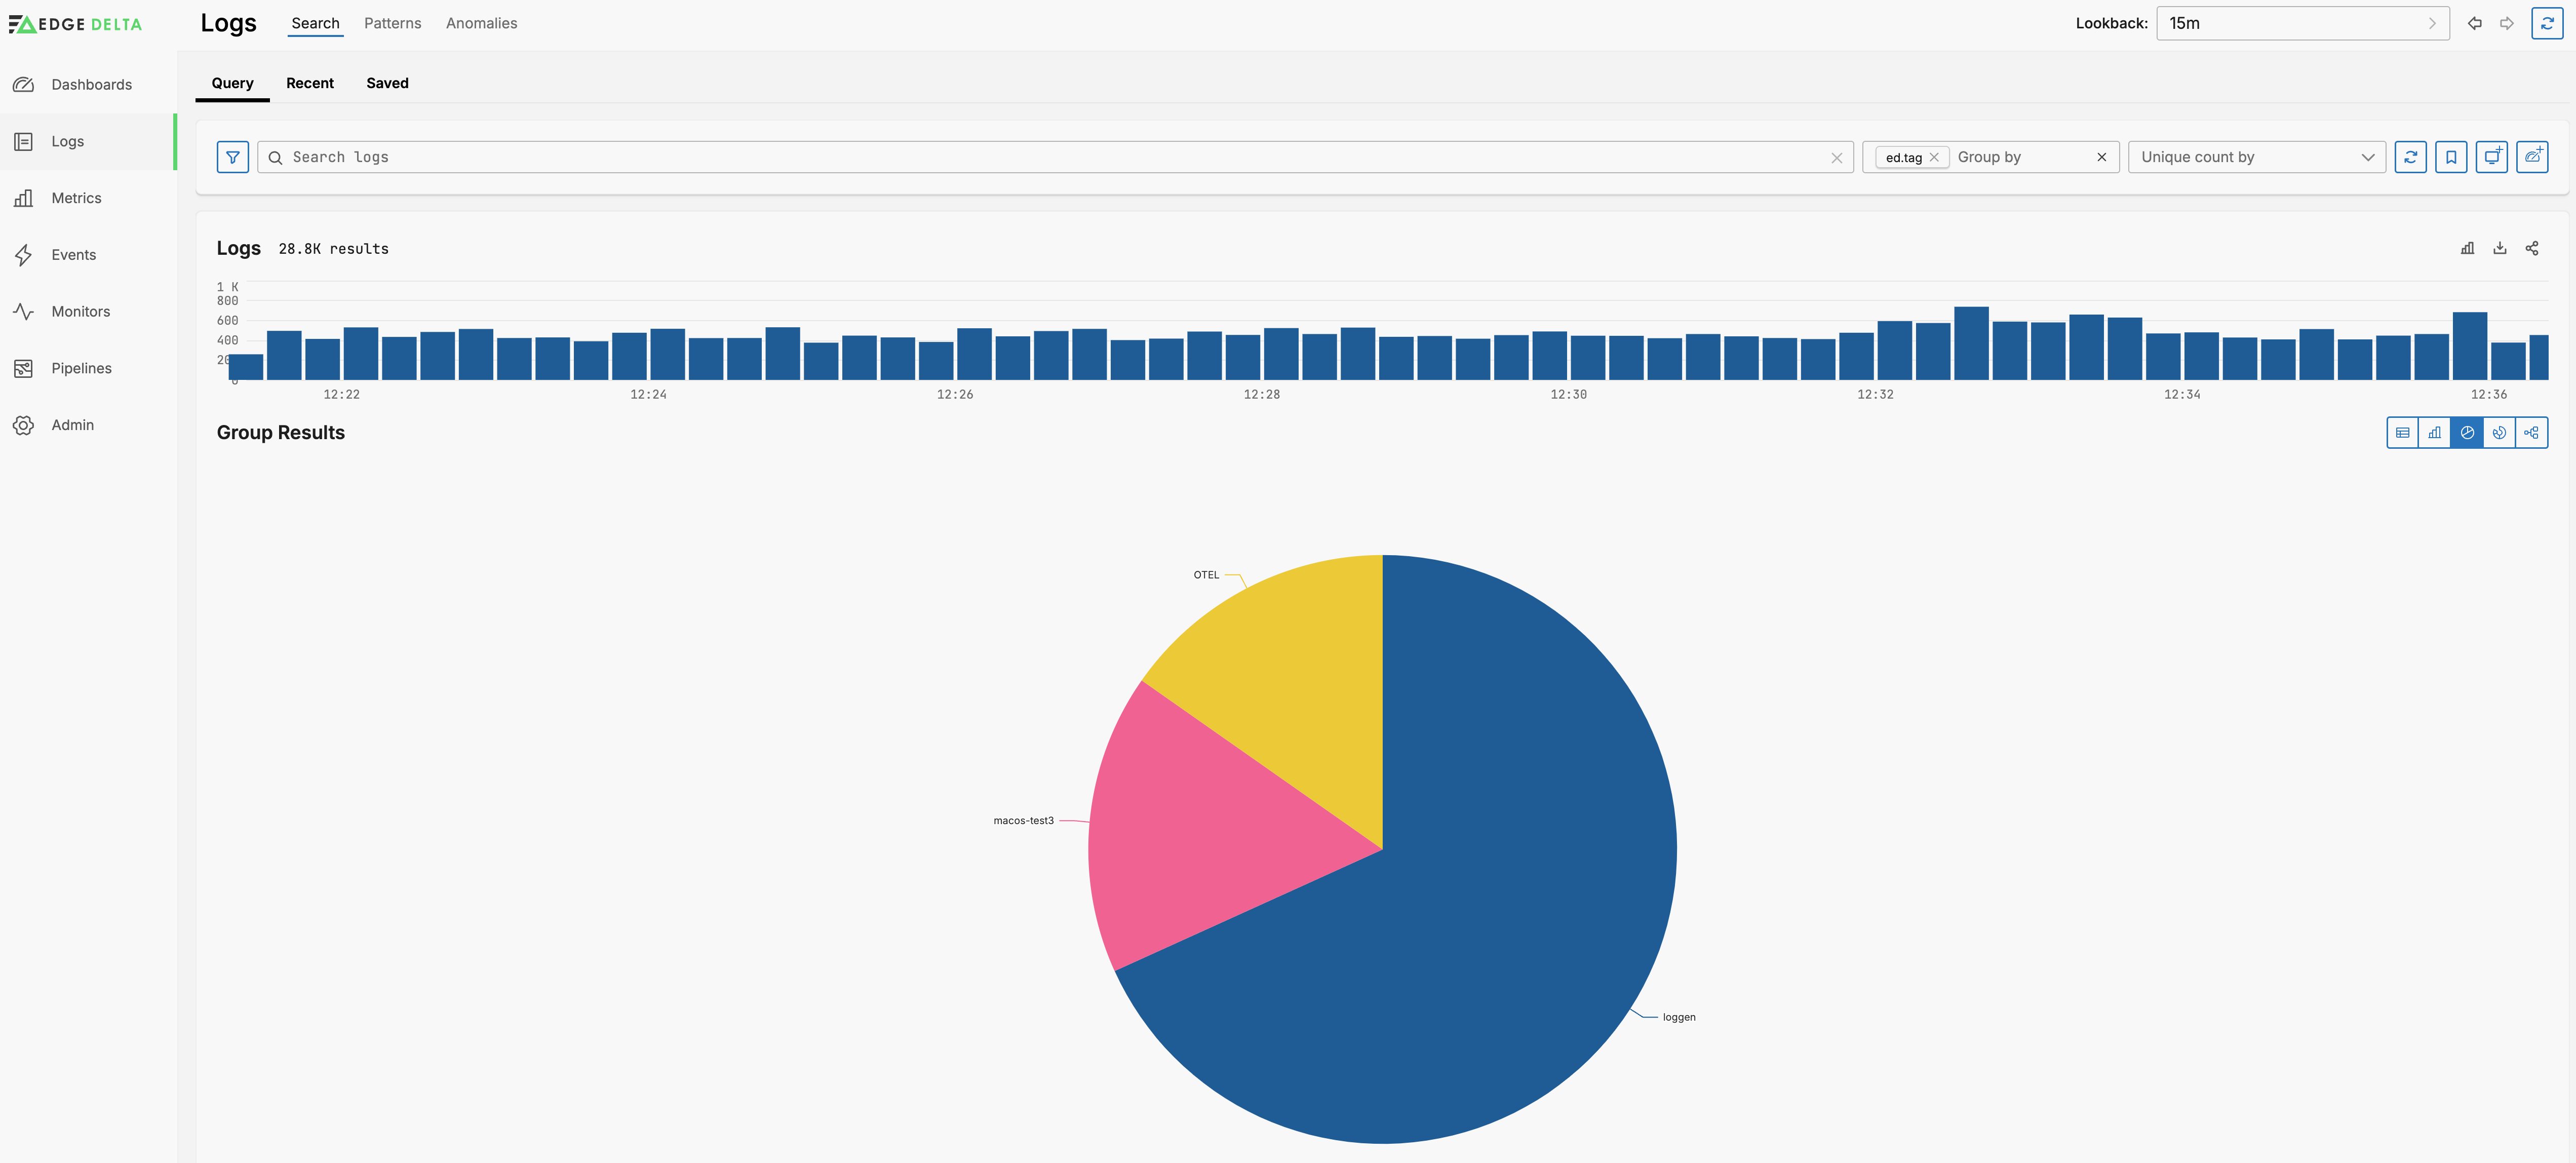
You can group the graph by any of the facets listed in the Filter Pane using the Group By option. For example, you may want to see logs with a particular attribute from all sources, and viewed as series on a single graph.
With a group selected you can view the table as a pie chart:
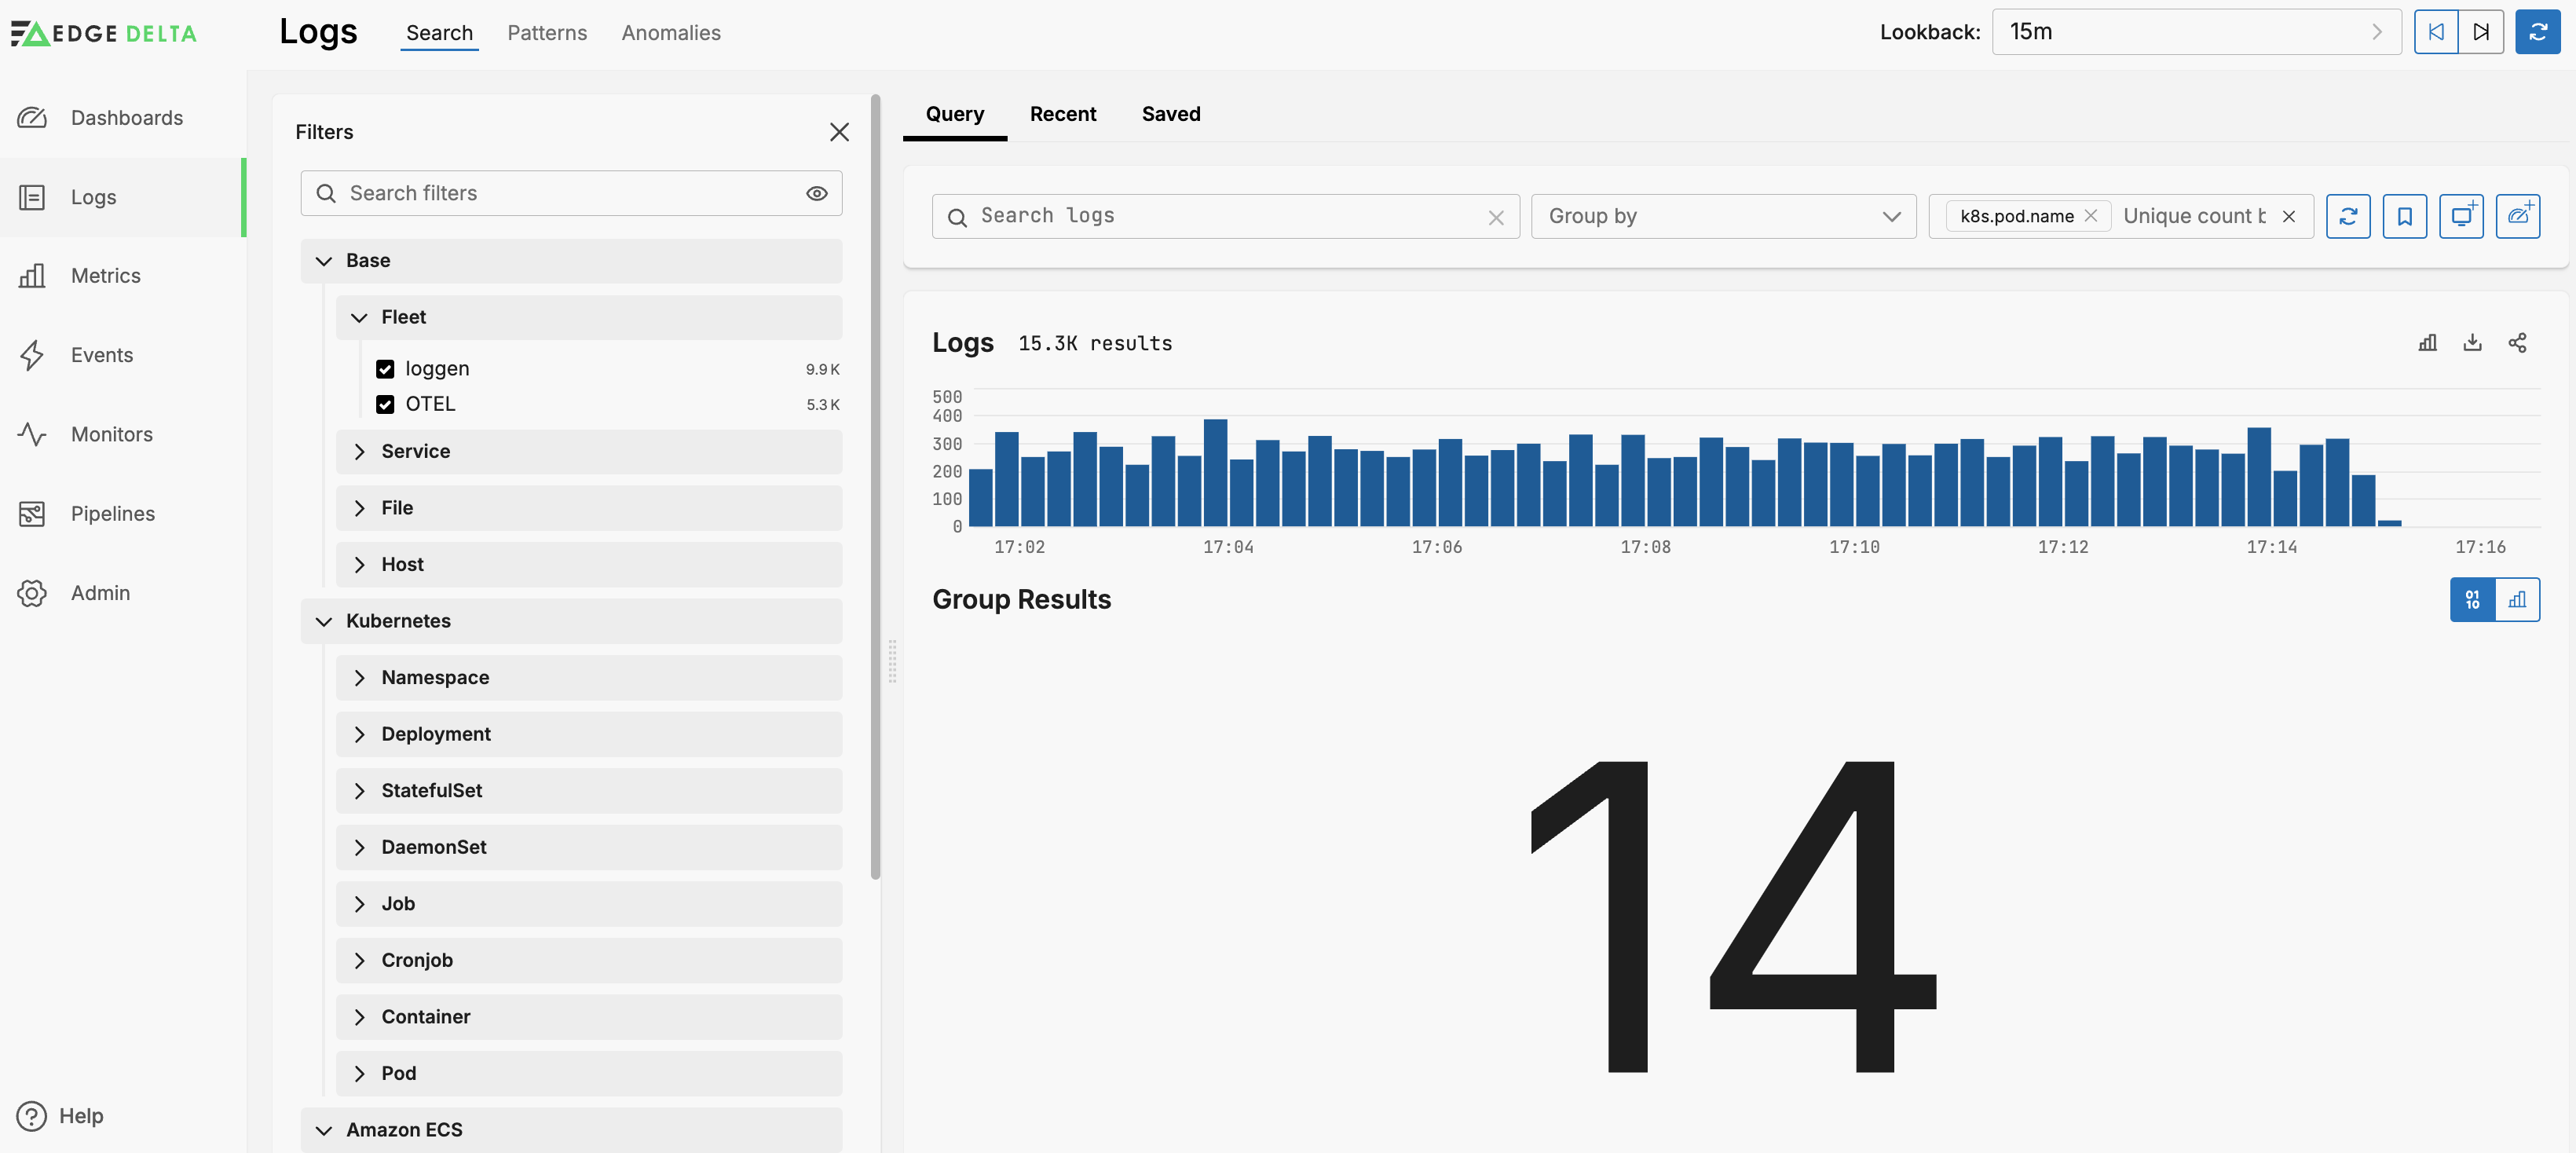
Unique Count
You can view a count of unique dimension values by selecting the dimension in the Unique count by list. For example, 87 pods have generated logs in the past 15 minutes:
Add Column
You can add a column to the search results pane. Click a log in the log search pane to open it. Select a tag and click Add Column.
You can also add a column from the filters widget.
Added columns will be included if you share the search results, and they will be included if they are visible and you download the results.