Send Events from Edge Delta Monitors to Dynatrace
5 minute read
Overview
You can send Edge Delta monitor alert events to Dynatrace using a webhook legacy integration. When a monitor changes state, Edge Delta sends an event to the Dynatrace Events API v2, which appears on the Dynatrace Problems page or in custom event feeds.
This guide covers the webhook legacy integration approach for monitor notifications. For streaming logs, metrics, and traces from a pipeline, see the Dynatrace destination node instead.
The webhook payload uses $EVENT_* variables that are populated from monitor event metadata at trigger time. For the complete list of available variables, see Event Variables.
Prerequisites
Before you begin, ensure you have the following:
- A Dynatrace environment (SaaS or Managed) with the environment ID (the subdomain in your Dynatrace URL, for example
abc12345inabc12345.live.dynatrace.com) - A Dynatrace API token with the events.ingest (Ingest events) permission scope
- Access to Edge Delta with permissions to configure Legacy Integrations and monitors
Step 1: Create a Dynatrace API token
Create an API token in your Dynatrace environment with the Ingest events (events.ingest) scope. You can generate tokens from the Access tokens page in Dynatrace settings. Copy the token value and store it securely.
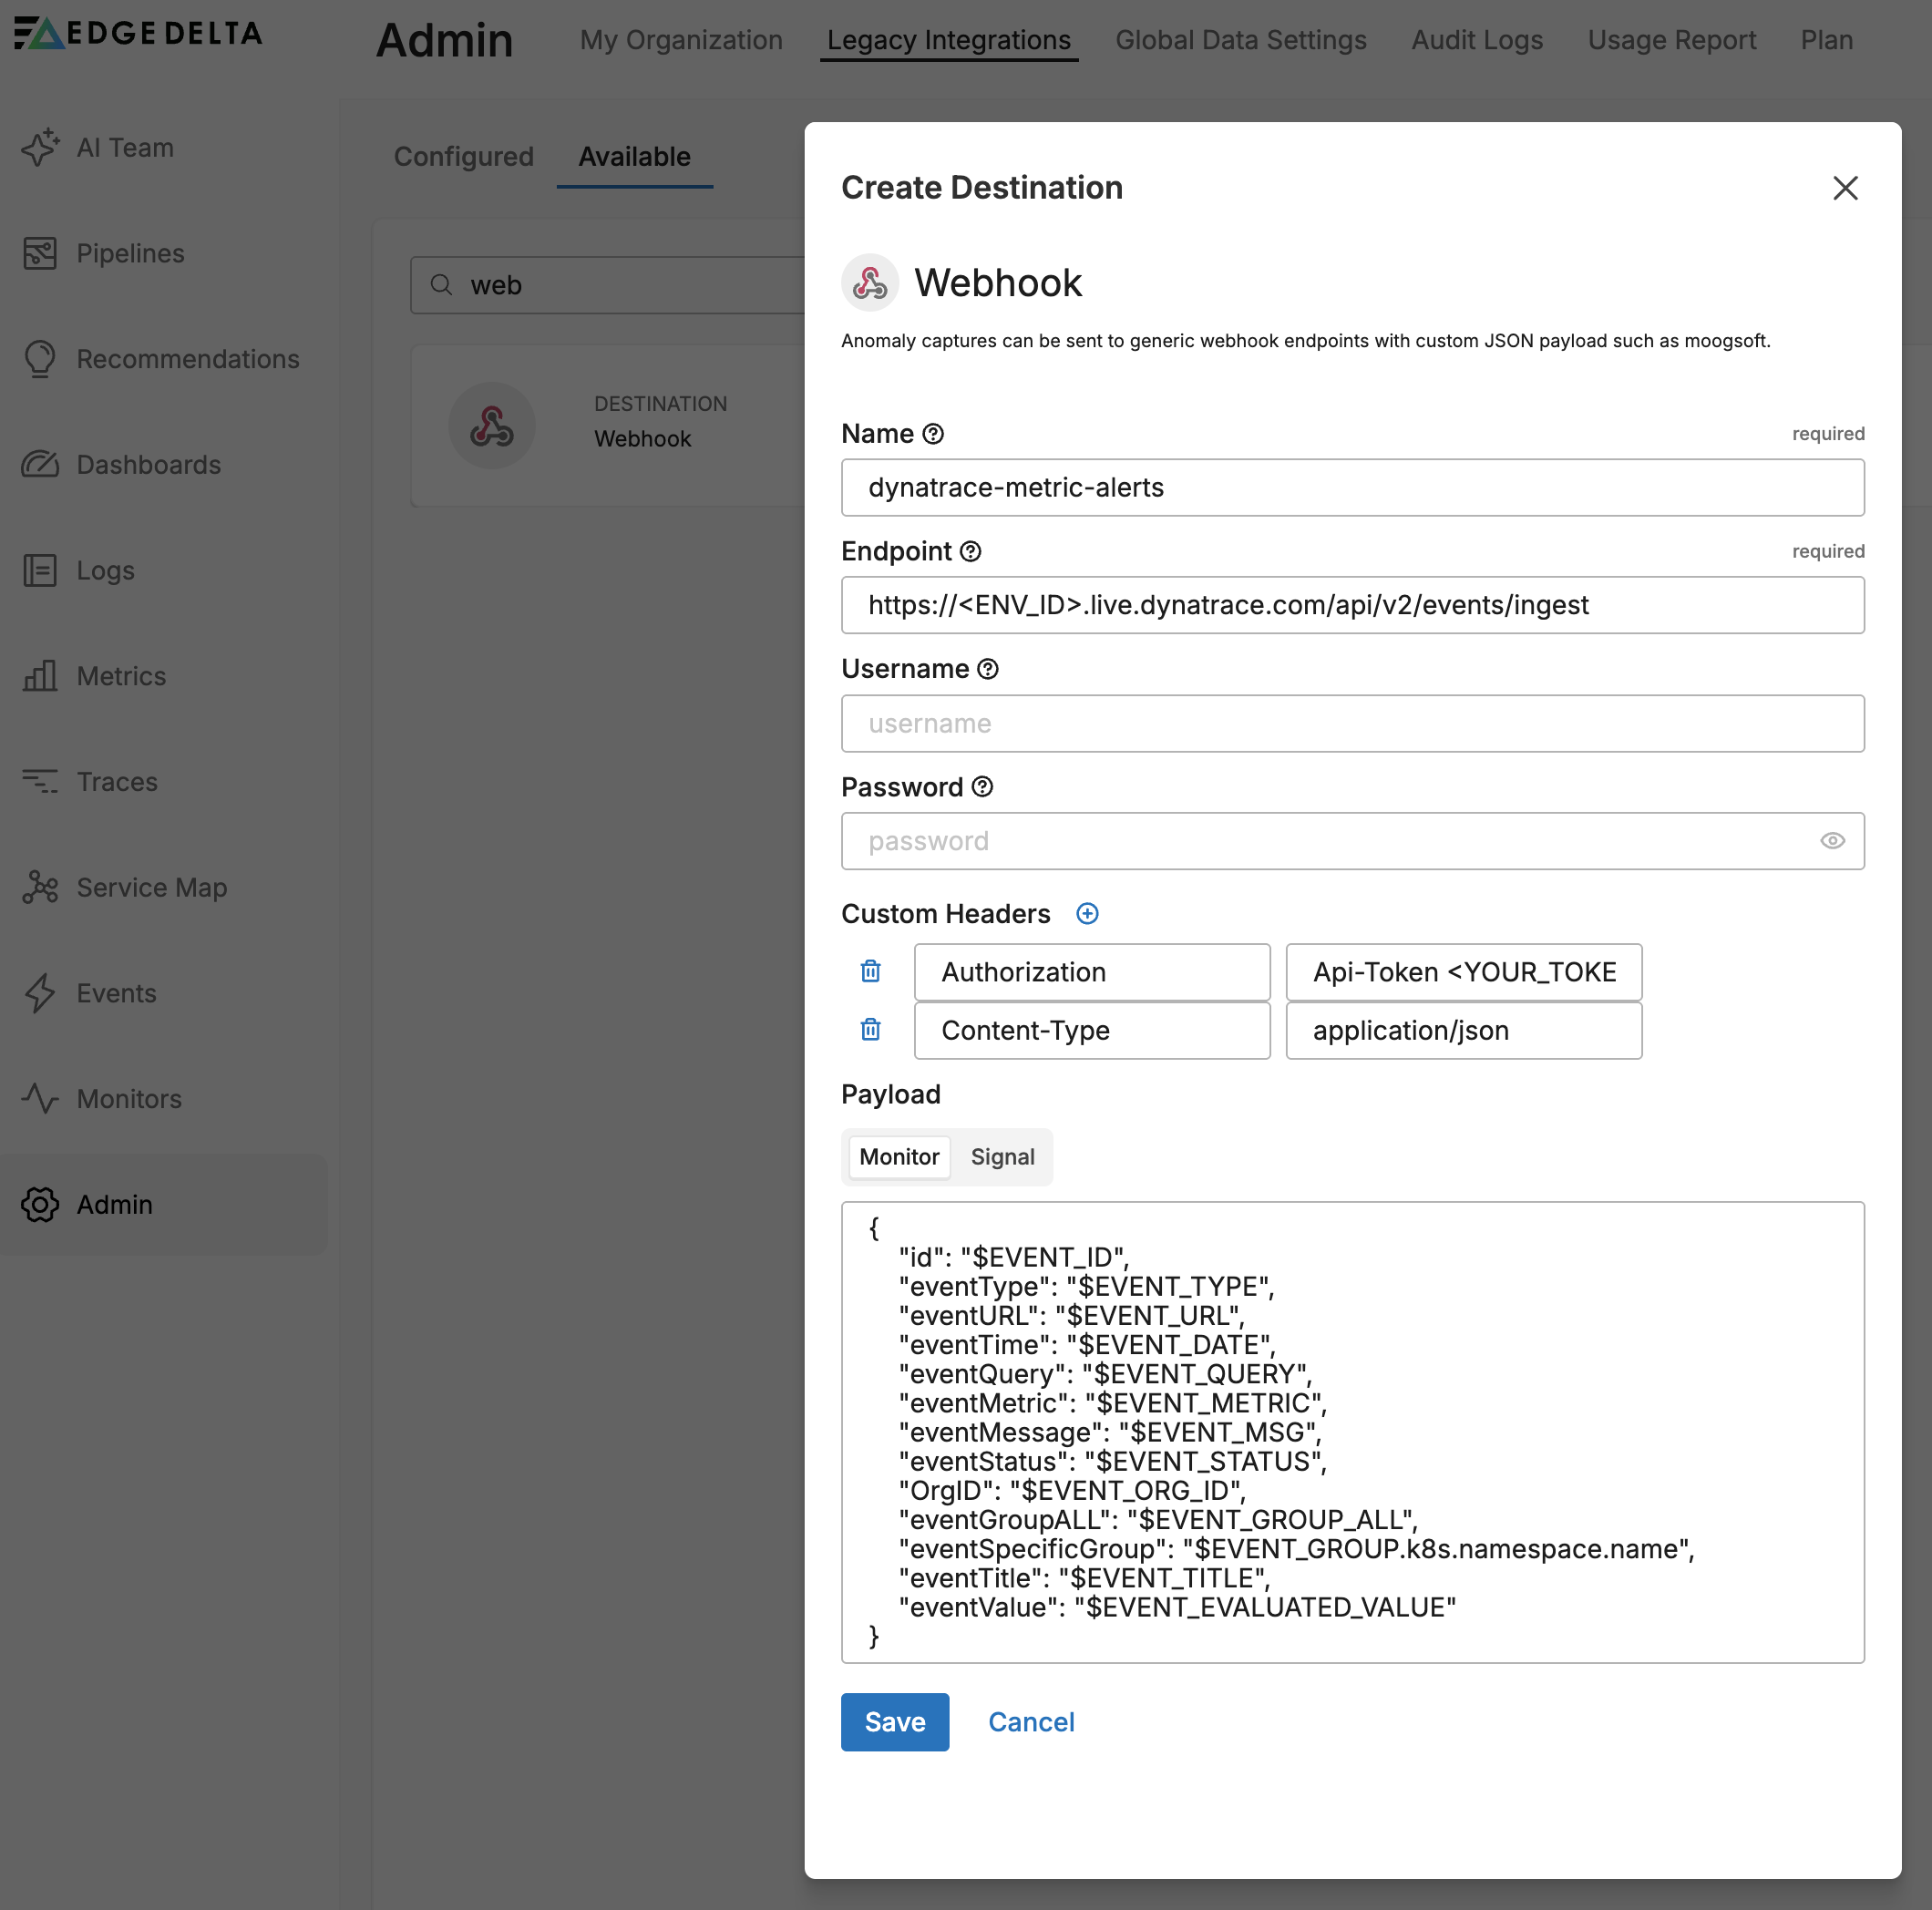
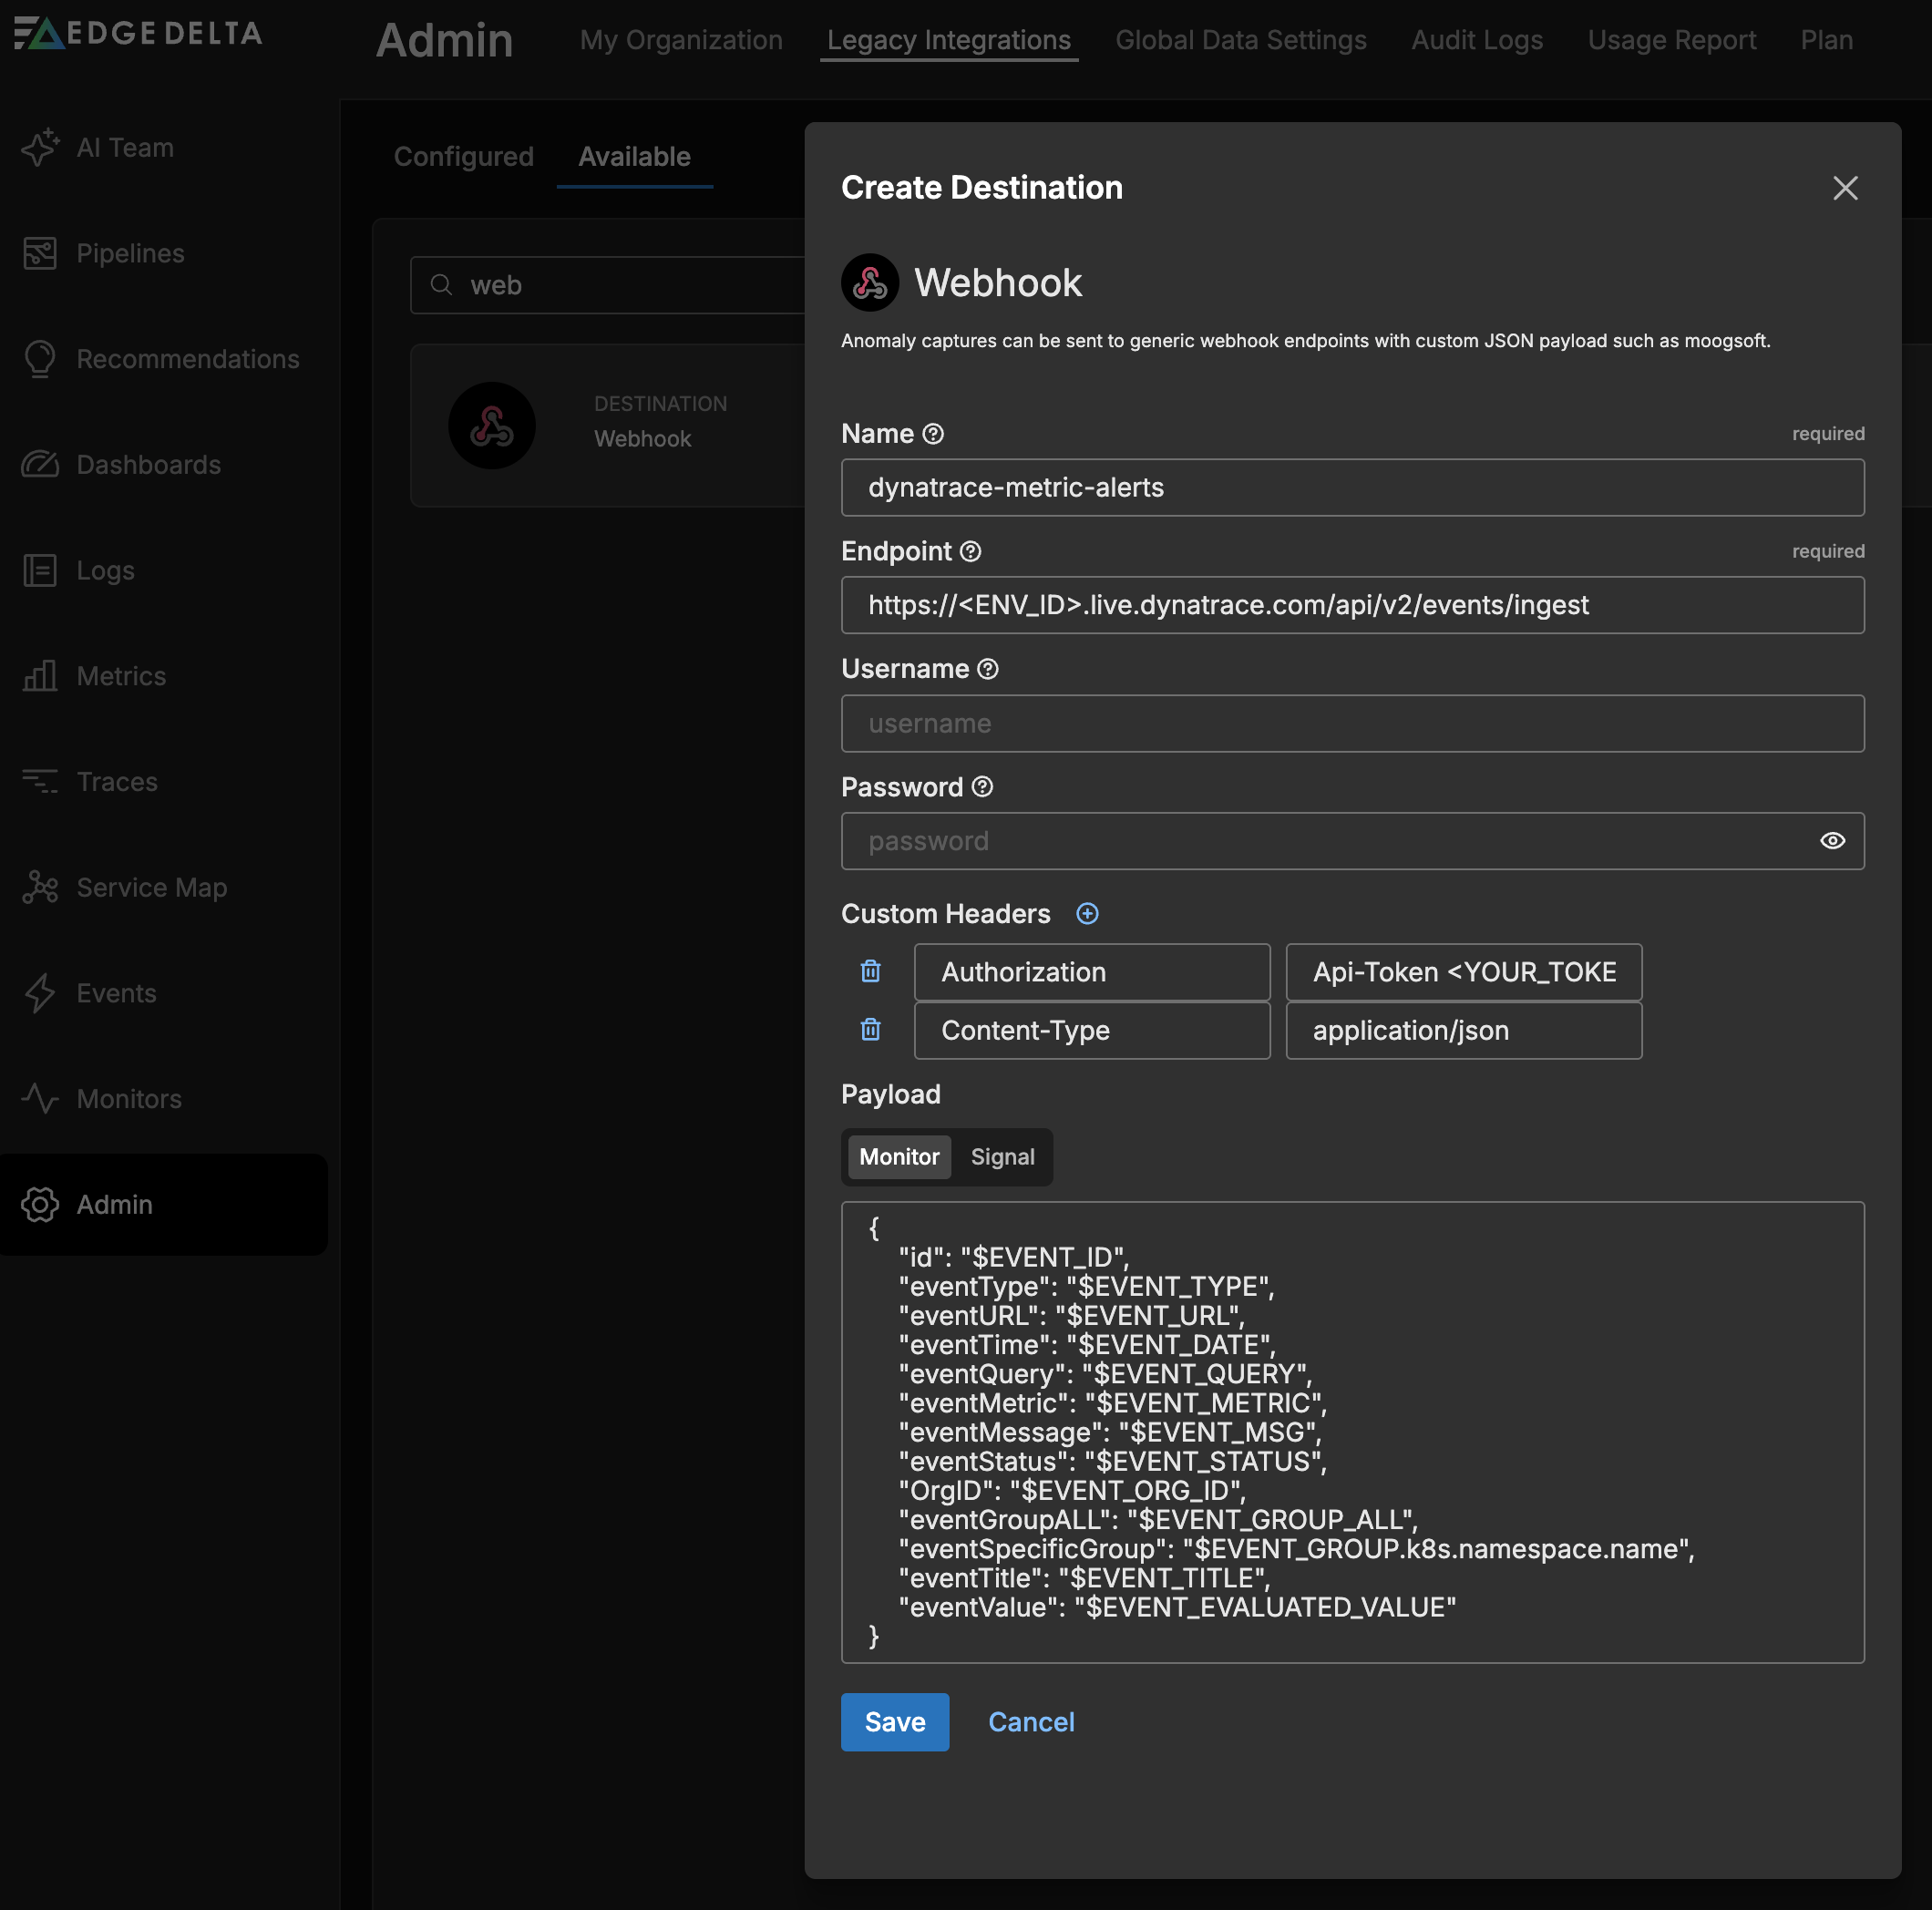
Step 2: Create the webhook integration in Edge Delta
- In Edge Delta, click Admin.
- Click Legacy Integrations.
- Open the Available tab.
- Search for Webhook and select it.
Configure the webhook with the following settings:
Name: Enter a descriptive name (for example,
dynatrace-metric-alerts). Integration names cannot contain periods.Endpoint:
https://<ENV_ID>.live.dynatrace.com/api/v2/events/ingestReplace
<ENV_ID>with your Dynatrace environment ID.Headers: Add two custom headers:
Name Value AuthorizationApi-Token <YOUR_TOKEN>Content-Typeapplication/jsonPayload: Use one of the payload examples below.
You can add additional headers for traceability, such as
X-Event-Idwith the value$EVENT_ID.
Payload for metric monitors
Use this payload when the webhook is triggered by a metric threshold or metric change monitor. These monitor types populate $EVENT_METRIC and $EVENT_EVALUATED_VALUE:
{
    "eventType": "ERROR_EVENT",
    "title": "$EVENT_TITLE",
    "properties": {
        "edgedelta.event.url": "$EVENT_URL",
        "edgedelta.event.time": "$EVENT_DATE",
        "edgedelta.event.query": "$EVENT_QUERY",
        "edgedelta.event.metric": "$EVENT_METRIC",
        "edgedelta.event.status": "$EVENT_STATUS",
        "edgedelta.org.id": "$EVENT_ORG_ID",
        "edgedelta.event.group": "$EVENT_GROUP_ALL",
        "edgedelta.event.value": "$EVENT_EVALUATED_VALUE",
        "edgedelta.event.message": "$EVENT_MSG"
    }
}
Payload for pattern anomaly and log monitors
Pattern anomaly and log threshold monitors do not populate $EVENT_METRIC or $EVENT_EVALUATED_VALUE. Dynatrace rejects empty strings in the properties object, so these fields must be removed:
{
    "eventType": "ERROR_EVENT",
    "title": "$EVENT_TITLE",
    "properties": {
        "edgedelta.event.url": "$EVENT_URL",
        "edgedelta.event.time": "$EVENT_DATE",
        "edgedelta.event.query": "$EVENT_QUERY",
        "edgedelta.event.status": "$EVENT_STATUS",
        "edgedelta.org.id": "$EVENT_ORG_ID",
        "edgedelta.event.group": "$EVENT_GROUP_ALL",
        "edgedelta.event.message": "$EVENT_MSG"
    }
}
Dynatrace rejects payloads that contain empty string values in the
propertiesobject. If a variable such as$EVENT_METRICresolves to an empty string for your monitor type, remove it from the payload. Create separate webhook integrations for different monitor types as needed.
Dynatrace event types
The eventType field determines how Dynatrace categorizes the event. Choose a type based on the severity of the alert:
| eventType | Use case |
|---|---|
ERROR_EVENT | Errors or threshold breaches requiring attention |
CUSTOM_ALERT | Custom alerts for monitoring dashboards |
CUSTOM_INFO | Informational events such as recoveries or advisories |
CUSTOM_DEPLOYMENT | Deployment tracking |
MARKED_FOR_TERMINATION | Service teardown events |
entitySelector (optional)
The entitySelector field associates the event with a monitored entity in Dynatrace. Include this field only if Dynatrace OneAgent is deployed in your environment and is populating entity data.
For Linux hosts with OneAgent, use type(PROCESS_GROUP):
{
    "eventType": "ERROR_EVENT",
    "title": "$EVENT_TITLE",
    "entitySelector": "type(PROCESS_GROUP),entityName.startsWith(<process-name>)",
    "properties": {
        "edgedelta.event.url": "$EVENT_URL",
        "edgedelta.event.status": "$EVENT_STATUS",
        "edgedelta.event.message": "$EVENT_MSG"
    }
}
For Kubernetes environments with OneAgent, use type(CLOUD_APPLICATION):
{
    "eventType": "ERROR_EVENT",
    "title": "$EVENT_TITLE",
    "entitySelector": "type(CLOUD_APPLICATION)",
    "properties": {
        "edgedelta.event.url": "$EVENT_URL",
        "edgedelta.event.status": "$EVENT_STATUS",
        "edgedelta.event.message": "$EVENT_MSG"
    }
}
Replace <process-name> with the prefix of the process group name in Dynatrace.
If OneAgent is not deployed, do not include the
entitySelectorfield. Events sent with anentitySelectorthat does not match any known entity become hidden in Dynatrace and do not appear on the Problems page or in event feeds.
Step 3: Configure a monitor to use the webhook
Link the webhook integration to a monitor so alerts trigger notifications to Dynatrace.
- Create or edit a monitor (for example, a metric threshold monitor).
- In the Notifications section, type
@and select your webhook integration from the autocomplete list. The integration appears with the prefix@webhook-followed by the name you configured (for example,@webhook-dynatrace-metric-alerts). - Save the monitor.
See Monitor Notifications for details on conditional notification routing.
The following example sends an event to Dynatrace on alert and a separate informational event on recovery:
{{#is_alert}}
@webhook-dynatrace-metric-alerts
{{/is_alert}}

{{#is_recovery}}
@webhook-dynatrace-recovery
{{/is_recovery}}
This pattern requires two separate webhook integrations: one configured with eventType set to ERROR_EVENT for alerts, and another with eventType set to CUSTOM_INFO for recoveries.
Step 4: Test the integration
- In the monitor configuration, click Test Notifications to send a test event.
- In Dynatrace, navigate to the Events page to verify the event was received.
- Check that all property values are populated correctly.
If the test notification fails, Edge Delta displays a failure message. Check the Troubleshooting section for common causes.
Troubleshooting
| Symptom | Solution |
|---|---|
| 401 Unauthorized | Verify the API token has the events.ingest scope and is not expired. Confirm the Authorization header value uses the format Api-Token <token> (with a space, not Bearer). |
| 400 Bad Request | Check for empty string values in the properties object. Dynatrace rejects empty strings. Remove $EVENT_* variables that are not populated by your monitor type. Also verify the payload is valid JSON. |
| Events ingested but not visible | If using entitySelector, verify that OneAgent is deployed and the entity type matches your environment. Remove entitySelector if OneAgent is not in use. |
| Test notification succeeds but no event in Dynatrace | Check the Dynatrace Events page (not only the Problems page). Events without an entitySelector appear in the Events feed. Also verify you are looking at the correct time range. |
Related content
- Legacy Integrations
- Monitor Notifications
- Send Monitor Events to PagerDuty (includes
$EVENT_*variable reference) - Dynatrace Destination (pipeline node for logs, metrics, and traces)