Trigger AI Team Workflows from Monitors
3 minute read
Overview
You can trigger an AI Team workflow directly from a monitor. When the monitor fires, it triggers the workflow’s Start node, allowing you to automate multi-step responses such as AI-assisted triage, alert enrichment, or notification routing.
Unlike legacy integrations that forward alerts to external systems, workflows let you define conditional logic, invoke AI teammates, transform data, and chain multiple actions together.
Prerequisites
Before connecting a monitor to a workflow:
- Create and save a workflow in AI Team > Workflows
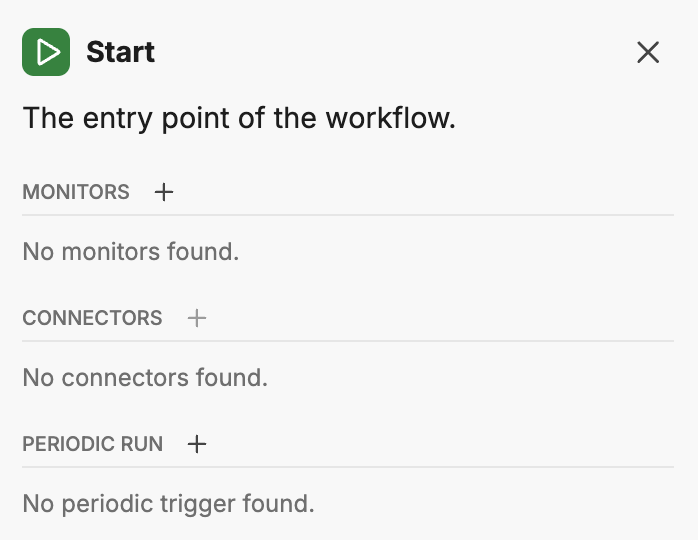
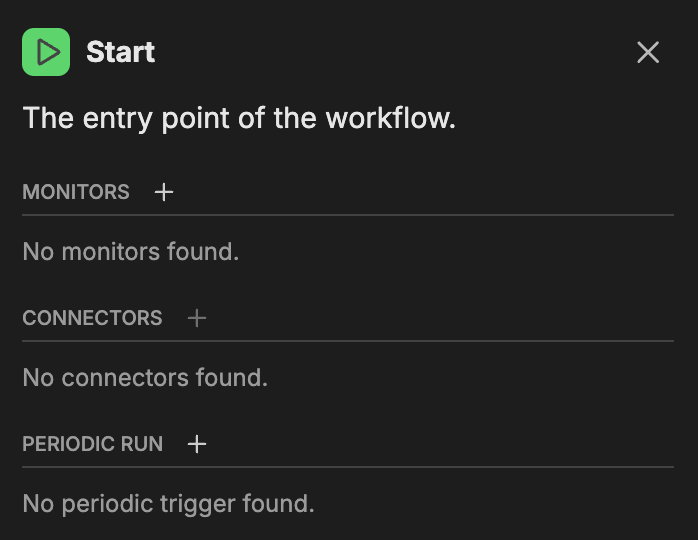
- Configure the workflow’s Start node
- Ensure the workflow Status toggle is enabled
Configure the monitor
To trigger a workflow from a monitor:
- Open an existing monitor or create a new one
- In the Notifications section, type
@to open autocomplete - Select the workflow (prefixed with
@ai>) from the list - Save the monitor
When the monitor changes state, it triggers the workflow and passes the monitor event data to the Start node.
Conditional workflow triggers
You can use conditional formatting to trigger workflows only for specific monitor states. Wrap the workflow mention in condition tags:
Trigger on alert only
{{#is_alert}}
@ai>alert-enrichment
{{/is_alert}}
Trigger on alert and recovery
{{#is_alert}}
@ai>incident-response
{{/is_alert}}

{{#is_recovery}}
@ai>incident-close
{{/is_recovery}}
Trigger based on service
{{#is_alert}}
  {{#is_exact_match "service.name" "payment-api,checkout-api"}}
@ai>revenue-alert-triage
  {{/is_exact_match}}

  {{^is_exact_match "service.name" "payment-api,checkout-api"}}
@ai>general-alert-triage
  {{/is_exact_match}}
{{/is_alert}}
Monitor event data in workflows
When a monitor triggers a workflow, the event data is available to workflow nodes. You can reference this data in Transform nodes, If/Else conditions, and AI prompts.
Available data includes:
- Monitor name and ID
- Alert severity and status
- Evaluated metric values and thresholds
- Group-by attributes (for example,
service.name,ed.tag,k8s.namespace.name) - Evaluation time window
- Observation URL linking to the relevant metrics
Use Transform nodes to extract specific fields or reshape the data for downstream actions.
Example: Alert enrichment workflow
This example demonstrates a workflow that enriches alerts before sending to Slack:
- Start node: Configured with Monitors trigger
- Teammate node: An AI teammate analyzes the alert context and suggests potential causes
- Transform node: Combines the original alert with the AI analysis
- Action node: Sends the enriched alert to a Slack channel
The monitor notification configuration:
{{#is_alert}}
@ai>alert-enrichment
{{/is_alert}}
When the monitor fires, the workflow:
- Receives the monitor event
- Passes it to the AI teammate for analysis
- Transforms the output into a structured message
- Posts the enriched alert to Slack with context and recommendations
Combining workflows with other notifications
You can include workflow triggers alongside other notification recipients:
{{#is_alert}}
Alert detected for {{service.name}} in {{ed.tag}}

@ai>alert-triage
@slack-ops-channel
@oncall@team.com
{{/is_alert}}
This configuration triggers the workflow for automated processing while also sending immediate notifications to Slack and email.
Troubleshooting
Workflow not triggering
- Verify the workflow Status toggle is enabled in the workflows list
- Check that the workflow’s Start node is configured with a Monitors trigger
- Confirm the workflow name in the notification section matches exactly
- Review the monitor’s conditional formatting to ensure the workflow mention is within the correct condition tags
Workflow errors
Click Runs in the workflow editor to view execution history. The run history shows:
- Execution status (completed, error, in progress)
- Runtime duration
- Error messages if the workflow failed
Review the run details to identify which node failed and why.
Related resources
- Workflows - Build and configure AI Team workflows
- Monitor Notifications - Configure notification recipients and conditional formatting
- AI Team Overview - Understand the AI Team ecosystem