SNMP Pull Connector
Configure the SNMP Pull connector to collect metrics from network devices, servers, and SNMP-enabled equipment for AI-powered analysis of infrastructure health and performance.
8 minute read
Overview
The SNMP Pull connector collects metrics from network devices, servers, and infrastructure equipment using SNMP (Simple Network Management Protocol) polling. SNMP is the standard protocol for monitoring routers, switches, firewalls, servers, environmental sensors, and other network-enabled equipment. Content streams into Edge Delta Pipelines for analysis by AI teammates through the Edge Delta MCP connector.
The connector supports SNMPv1, SNMPv2c, and SNMPv3 with flexible authentication options. It periodically polls configured OIDs (Object Identifiers) to collect interface statistics, resource utilization, environmental data, and custom metrics from any SNMP-enabled device.
When you add this streaming connector, it appears as a SNMP Pull source in your selected pipeline. AI teammates access this data by querying the Edge Delta backend with the Edge Delta MCP connector.
Add the SNMP Pull Connector
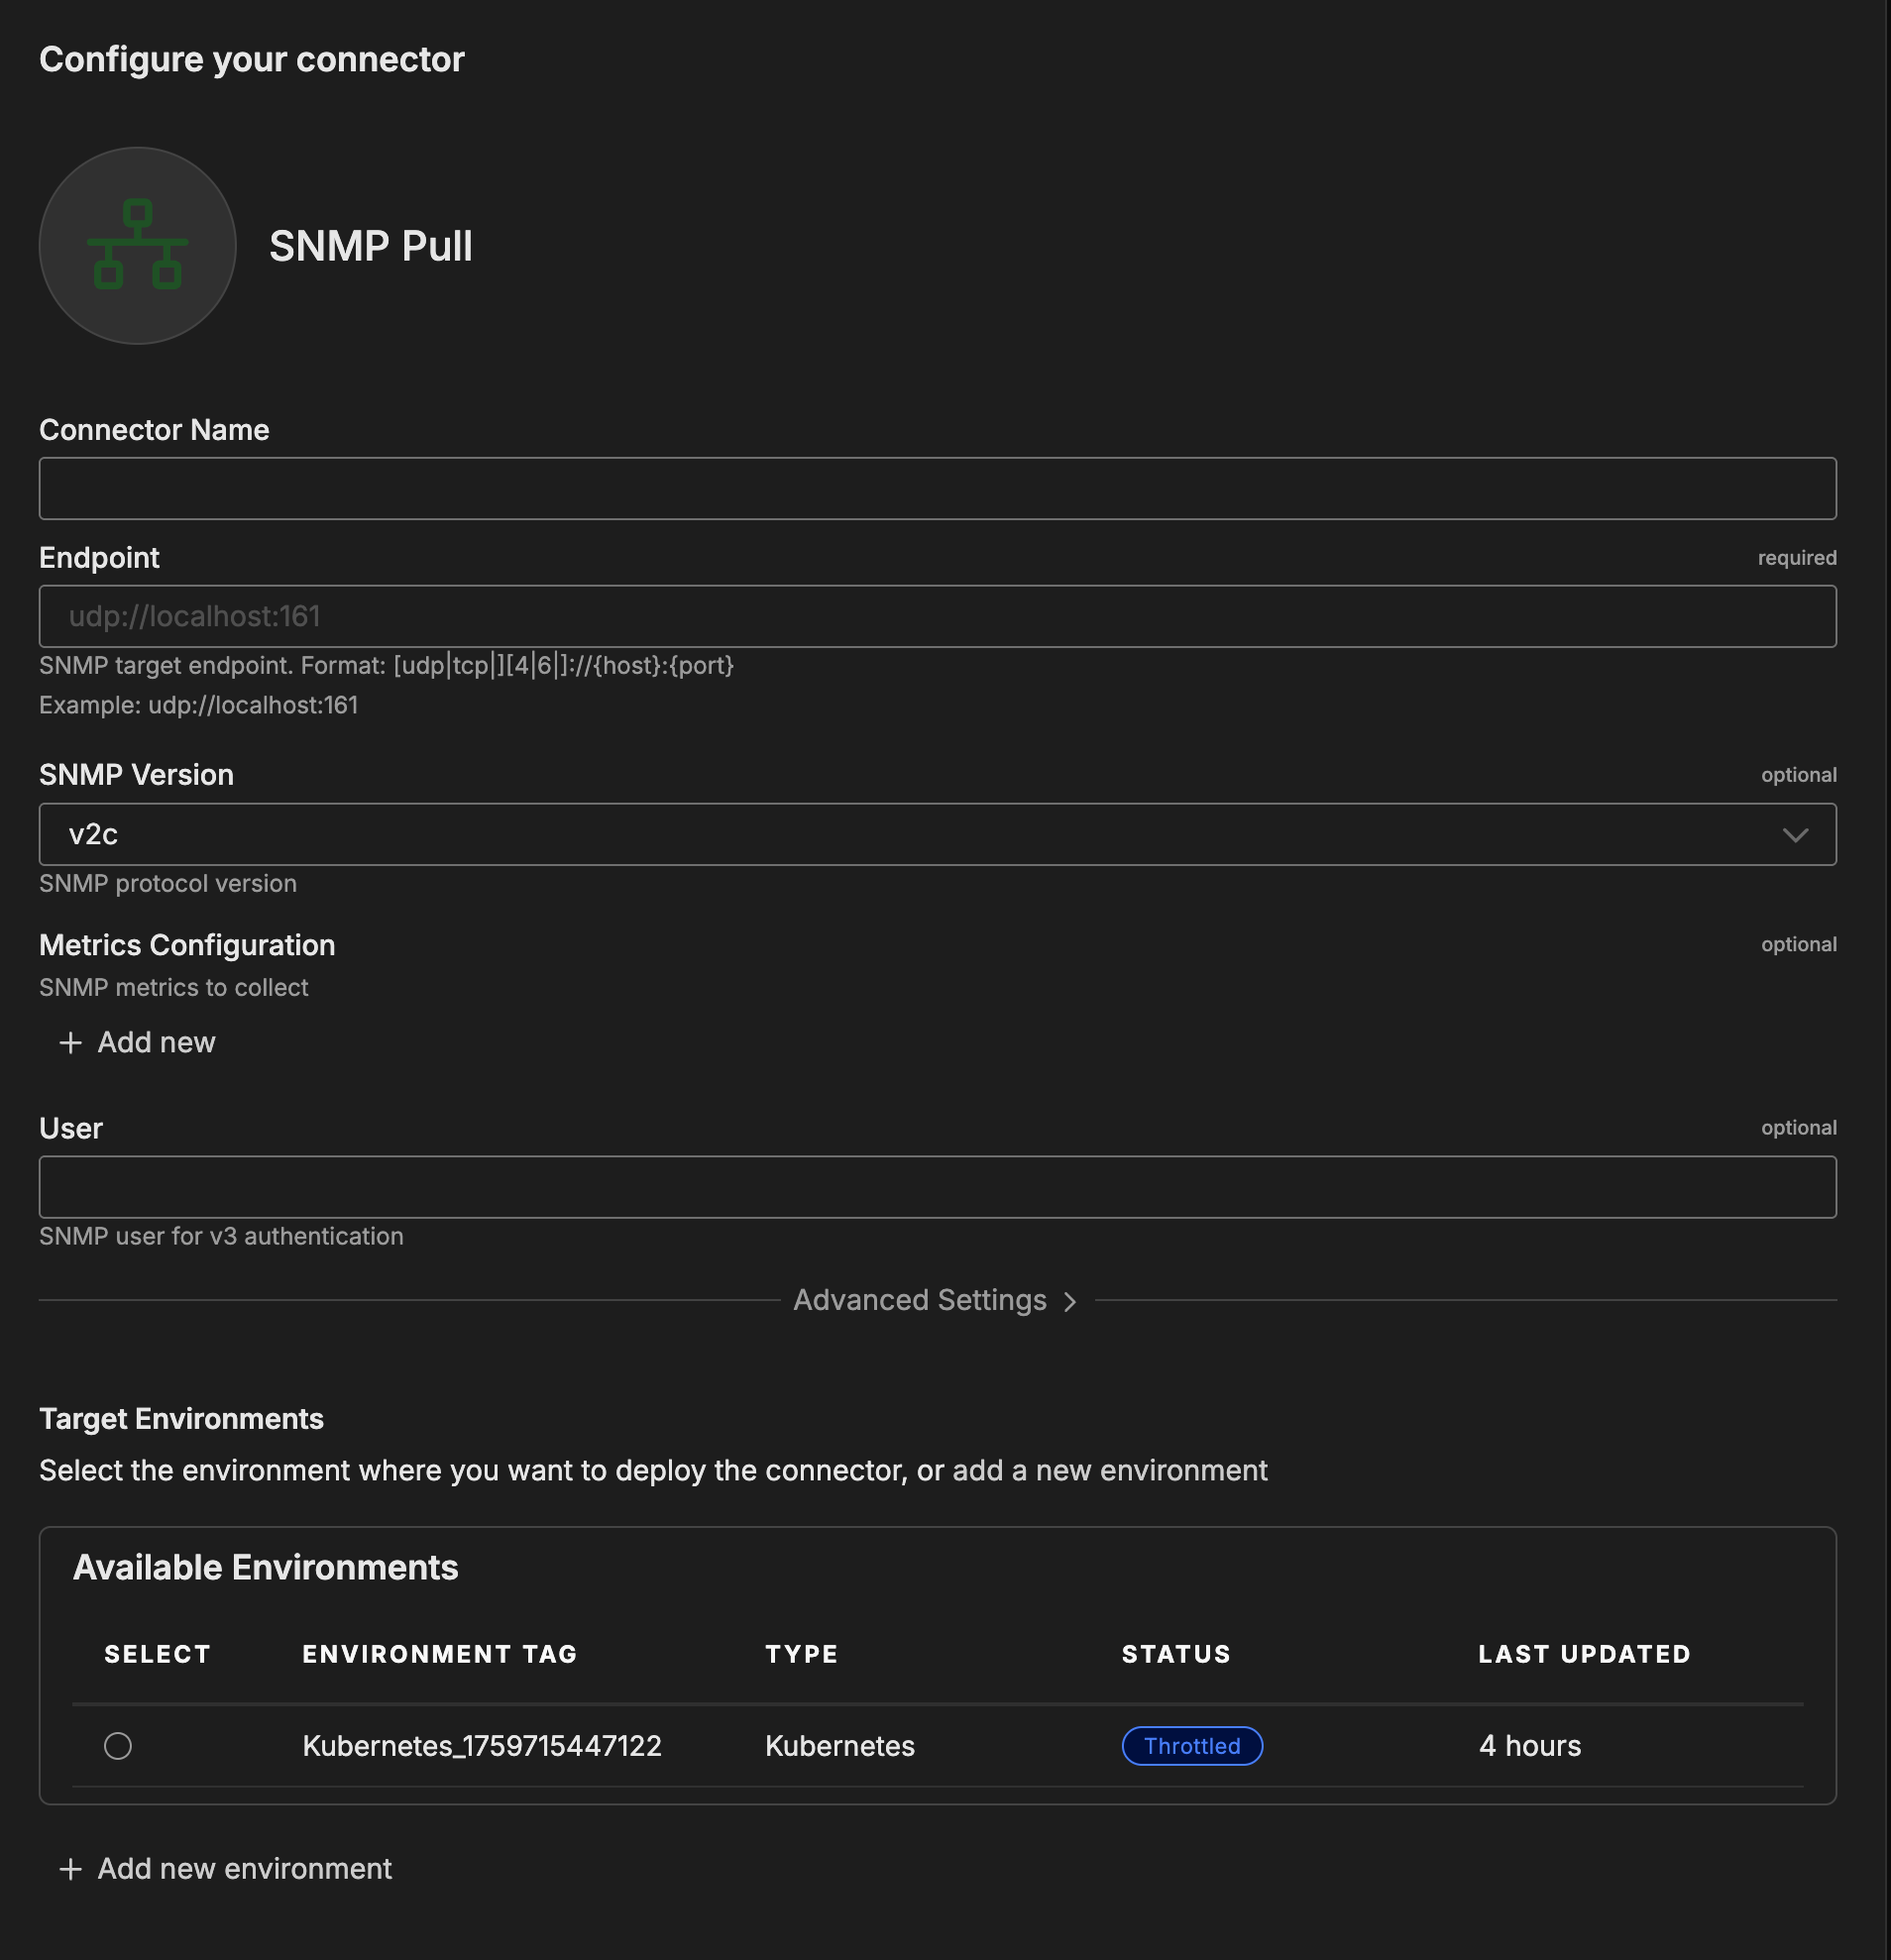
To add the SNMP Pull connector, you configure the SNMP endpoint, authentication credentials, and metrics to collect.
Prerequisites
Before configuring the connector, ensure you have:
- SNMP-enabled network devices, servers, or equipment
- SNMP community string (for SNMPv1/v2c) or SNMPv3 credentials
- Network connectivity from Edge Delta agent to SNMP endpoints
- OIDs you want to monitor (from device MIB documentation)
- UDP port 161 accessible between agent and devices
Configuration Steps
- Navigate to AI Team > Connectors in the Edge Delta application
- Find the SNMP Pull connector in Streaming Connectors
- Click the connector card
- Configure Endpoint (SNMP target device)
- Select SNMP Version (v1, v2c, or v3)
- Configure authentication (Community String for v1/v2c or User credentials for v3)
- Define Metrics Configuration with OIDs to collect
- Optionally configure Advanced Settings for collection interval, timeout, security
- Select a target environment
- Click Save
The connector deploys and begins polling the SNMP endpoint at the configured interval.
Configuration Options
Connector Name
Name to identify this SNMP Pull connector instance.
Endpoint
SNMP target endpoint to poll for metrics.
Format: [protocol]://host:port where protocol is udp, tcp, udp4, udp6, tcp4, or tcp6
Examples:
udp://192.168.1.1:161- Standard UDP to IPv4 addresstcp://router.example.com:161- TCP to hostnameudp6://[2001:db8::1]:161- UDP to IPv6 addressudp4://switch.local:161- Explicit UDP IPv4
Default Port: 161 (standard SNMP port)
SNMP Version
SNMP protocol version for device communication.
Values: v1, v2c, v3
Default: v2c
When to Use:
- v2c: Most common, simple community-based authentication
- v3: Production environments requiring encryption and enhanced security
- v1: Legacy devices only
Metrics Configuration
SNMP metrics to collect from the target device. Click “Add new” to define each metric with its OIDs and properties.
Each metric configuration includes:
Metric Name: Name of the metric as it will be reported
Description: Description of what this metric represents
Unit: Unit of measurement (bytes, seconds, percentage, etc.)
Metric Type: Type of metric data
Values:
gauge- Absolute values that fluctuate (CPU usage, temperature, memory available)sum- Cumulative values (interface traffic, packet counts, byte totals)
Aggregation: Aggregation type (required for sum type)
Values:
cumulative- Running total since startdelta- Change since last collection
Monotonic: Whether the metric only increases (required for sum type). Set to true for counters that never decrease.
Value Type: Data type of the metric value
Values:
int- Integer valuesdouble- Floating-point values
Scalar OIDs: Single SNMP Object Identifiers for point metrics. Click “Add new” to add OID values.
Column OIDs: Indexed SNMP Object Identifiers for table-based metrics. Click “Add new” to add OID values.
Common OIDs:
| OID | Description | Metric Type | Value Type |
|---|---|---|---|
| 1.3.6.1.2.1.1.3.0 | System Uptime | gauge | int |
| 1.3.6.1.2.1.2.2.1.10 | Interface In Octets | sum | int |
| 1.3.6.1.2.1.2.2.1.16 | Interface Out Octets | sum | int |
| 1.3.6.1.2.1.2.2.1.14 | Interface In Errors | sum | int |
| 1.3.6.1.2.1.2.2.1.20 | Interface Out Errors | sum | int |
| 1.3.6.1.4.1.2021.11.9.0 | CPU Idle | gauge | double |
| 1.3.6.1.4.1.2021.4.6.0 | Available Memory | gauge | int |
Finding OIDs: Consult device MIB documentation or use snmpwalk to browse available OIDs
User
SNMP user for v3 authentication. Required when using SNMPv3.
Format: Username configured on target device
Example: monitoring or edgedelta-readonly
Advanced Settings
Community String
SNMP community string for v1 and v2c authentication.
Default: public
Security: Always change from default public in production. Use read-only community strings.
Examples:
network-monitoring-ro- Descriptive read-only communitycustom-secure-string- Non-default community
Security Level
Security level for SNMPv3 connections.
Values:
no_auth_no_priv- No authentication or encryption (default)auth_no_priv- Authentication onlyauth_priv- Authentication and encryption (recommended for production)
When to Use: Use auth_priv for production to ensure encrypted communication
Authentication Type
Authentication protocol for SNMPv3. Required when security level includes authentication.
Values: md5, sha, sha256, sha384, sha512
Default: md5
Recommended: sha or higher for better security than md5
Authentication Password
Authentication password for SNMPv3. Required when security level includes authentication.
Format: Secure password string (minimum 8 characters)
Security: Use strong, randomly generated passwords unique to monitoring users
Privacy Type
Privacy (encryption) protocol for SNMPv3. Required when security level is auth_priv.
Values: des, aes, aes192, aes256, aes192c, aes256c
Default: des
Recommended: aes or higher for stronger encryption than legacy des
Privacy Password
Privacy password for SNMPv3 encryption. Required when security level is auth_priv.
Format: Secure password string (minimum 8 characters)
Note: Can be same as or different from authentication password
Collection Interval
How frequently to poll the SNMP endpoint for metrics.
Format: Milliseconds
Examples:
30000- 30 seconds for critical interface monitoring60000- 1 minute for typical metrics collection300000- 5 minutes for environmental sensors
Performance Note: Higher frequency increases network traffic and device load
Initial Delay
Delay before starting first metrics collection.
Format: Milliseconds
Default: 0 (start immediately)
When to Use: Stagger polling across multiple devices or allow initialization time
Example: 5000 - Wait 5 seconds before first poll
Timeout
Request timeout duration for SNMP queries.
Format: Milliseconds
Default: 5000-10000 milliseconds
When to Use: Increase for slow networks or high-latency connections
Example: 10000 - 10 second timeout for remote devices
Metadata Level (Resource Attributes)
This option is used to define which detected resources and attributes to add to each data item as it is ingested by Edge Delta. You can select:
- Required Only: This option includes the minimum required resources and attributes for Edge Delta to operate.
- Default: This option includes the required resources and attributes plus those selected by Edge Delta
- High: This option includes the required resources and attributes along with a larger selection of common optional fields.
- Custom: With this option selected, you can choose which attributes and resources to include. The required fields are selected by default and can’t be unchecked.
Based on your selection in the GUI, the source_metadata YAML is populated as two dictionaries (resource_attributes and attributes) with Boolean values.
See Choose Data Item Metadata for more information on selecting metadata.
SNMP-specific metadata included:
- Host name - Target device hostname
- Host IP - SNMP endpoint IP address
- Service name - SNMP service identifier
- Source name - Connector instance name
- Source type - SNMP Pull connector type
Metadata Level (Attributes)
Additional attribute-level metadata fields to include.
Default: ed.env.id
How to Use the SNMP Pull Connector
The SNMP Pull connector integrates seamlessly with AI Team, enabling AI-powered analysis of infrastructure metrics and device health. AI teammates automatically leverage SNMP-ingested data to monitor network interface health, analyze resource utilization trends, detect performance anomalies, and investigate infrastructure issues.
Use Case: Network Interface Monitoring
Monitor network device interface performance for errors, utilization, and capacity issues. AI teammates analyze interface metrics to identify elevated error rates, high utilization, operational status problems, and capacity constraints. When combined with PagerDuty alerts, teammates automatically investigate network issues by querying interface statistics and identifying problematic links.
Configuration:
- Endpoint:
udp://core-switch-01:161 - SNMP Version:
v2c - Community String:
network-ro - Metrics:
ifInOctets, ifOutOctets, ifInErrors, ifOutErrors(OIDs1.3.6.1.2.1.2.2.1.10/16/14/20) - Collection Interval:
60000
Use Case: Server Resource Monitoring
Track CPU, memory, and disk utilization on application servers to prevent resource exhaustion. AI teammates perform trend analysis on resource consumption, identify servers approaching capacity limits, detect memory leaks, and provide scaling recommendations. Using SNMPv3 with authentication and encryption ensures secure monitoring of production servers.
Configuration:
- Endpoint:
udp://app-server-01:161 - SNMP Version:
v3 - User:
monitoring - Security Level:
auth_priv - Authentication Type:
SHA - Privacy Type:
AES - Metrics:
ssCpuIdle, memAvailReal, dskPercent(OIDs1.3.6.1.4.1.2021.11.9.0,1.3.6.1.4.1.2021.4.6.0,1.3.6.1.4.1.2021.9.1.8.1) - Collection Interval:
30000
Use Case: Environmental Monitoring
Monitor data center environmental conditions like temperature, humidity, and power to prevent equipment damage. AI teammates detect temperature warnings, identify cooling system issues, and alert to conditions that could lead to hardware failure. This is valuable for preventing thermal-related outages and optimizing cooling efficiency.
Configuration:
- Endpoint:
udp://chassis-01:161 - SNMP Version:
v2c - Community String:
datacenter-ro - Metrics: temperature sensors (vendor-specific OIDs like
1.3.6.1.4.1.674.10892.5.4.700.20.1.6.*) - Collection Interval:
120000
Troubleshooting
Connection timeouts: Verify network connectivity between agent and device (ping test). Check SNMP enabled on device and UDP port 161 accessible. Verify firewall rules allow traffic. Increase timeout value for slow networks. Test with snmpwalk -v2c -c public device-ip to verify device responds.
SNMPv3 authentication failures: Verify username exists on device and is spelled correctly. Ensure authentication type matches device configuration (md5/sha). Confirm authentication password is correct (minimum 8 characters). Check security level matches device setting (no_auth_no_priv/auth_no_priv/auth_priv).
Community string rejected (v1/v2c): Verify community string matches device configuration exactly (case-sensitive). Ensure device allows read access for this community. Check device access control list permits agent’s IP address. Review device SNMP logs for rejection reason.
OIDs return no data: Verify OID exists on device using snmpwalk to browse OID tree. Check device MIB documentation for supported OIDs on your model/firmware. Ensure OID accessible with read permissions. Verify OID syntax correct with no typos.
No metrics appear in pipeline: Verify metrics configuration uses valid YAML syntax. Check OID paths are correct and accessible. Ensure collection interval not too long (wait at least one interval). Review agent logs for SNMP collection errors. Verify connector deployed to correct environment with running agents.
High device CPU load from polling: Reduce polling frequency by increasing collection interval (from 30s to 60s or longer). Minimize number of OIDs to essential metrics only. Check for multiple overlapping connector instances polling same device. Consider device capacity constraints.
Inconsistent data with gaps: Increase timeout value for occasional delays. Check network congestion or packet loss during gap periods. Monitor device CPU/memory utilization during gaps. Increase collection interval to reduce device load.
Next Steps
- Learn about SNMP Pull source configuration for advanced pipeline integration
- Learn about Edge Delta MCP connector for querying SNMP data
- Learn about creating custom teammates that can use SNMP metrics
For additional help, visit AI Team Support.