Edge Delta SNMP Pull Source
18 minute read
Overview
The SNMP Pull source node enables Edge Delta to actively poll and collect metrics from SNMP-enabled network devices, servers, and infrastructure components.
Use the configuration wizard below to generate a starter YAML configuration.
This node leverages OpenTelemetry’s SNMP receiver to periodically query Management Information Base (MIB) data and convert it into metrics that can be processed through your telemetry pipeline. For real-time event notifications instead of periodic polling, use the SNMP Trap source which passively receives alerts when devices detect events.
This node requires Edge Delta agent version v2.5.0 or higher.
AI Team: Configure this source using the SNMP Pull connector for streamlined setup in AI Team.
- outgoing_data_types: metric
The SNMP Pull source node is ideal for:
- Network Infrastructure Monitoring: Collect metrics from routers, switches, and firewalls
- Server Hardware Monitoring: Monitor CPU, memory, and disk usage via SNMP
- Application Performance: Gather custom application metrics exposed via SNMP
- IoT Device Monitoring: Collect telemetry from SNMP-enabled IoT devices
- Legacy System Integration: Bridge older SNMP-based monitoring into modern observability pipelines
SNMP Version Selection
The SNMP Pull source node supports multiple protocol versions to accommodate different security and compatibility requirements:
SNMP v2c (default):
- Simple community-based authentication using a shared password
- Widely supported across network devices
- Suitable for internal networks with basic security needs
- Lower overhead and simpler configuration
SNMP v3:
- Enhanced security with user-based authentication
- Supports encryption for data privacy (AES, DES)
- Multiple authentication protocols (MD5, SHA family)
- Recommended for production environments and sensitive data
- Required when monitoring across untrusted networks
Choose v2c for quick setup and legacy device compatibility. Use v3 when security is a priority or when compliance requirements mandate encrypted communications.
Metric Type Approaches
The SNMP Pull source node supports different metric types depending on your monitoring needs:
Gauge Metrics: Use for values that can fluctuate up or down over time, such as current CPU utilization, memory usage, active connections, or temperature readings. Gauge metrics represent instantaneous measurements at a specific point in time.
Sum Metrics: Use for cumulative counters that typically increase over time, such as total bytes transmitted, packet counts, error counts, or request totals. Sum metrics require additional parameters (
aggregationandmonotonic) to specify how the values should be tracked and whether they only increase.Full Configuration: Combines metric collection with advanced features like SNMP v3 security with authentication and encryption, custom collection intervals and timeouts, resource attributes for metadata enrichment, and multiple metrics from the same device. This approach is ideal for production environments requiring secure, comprehensive monitoring.
Example Configurations
Sum Metric Example
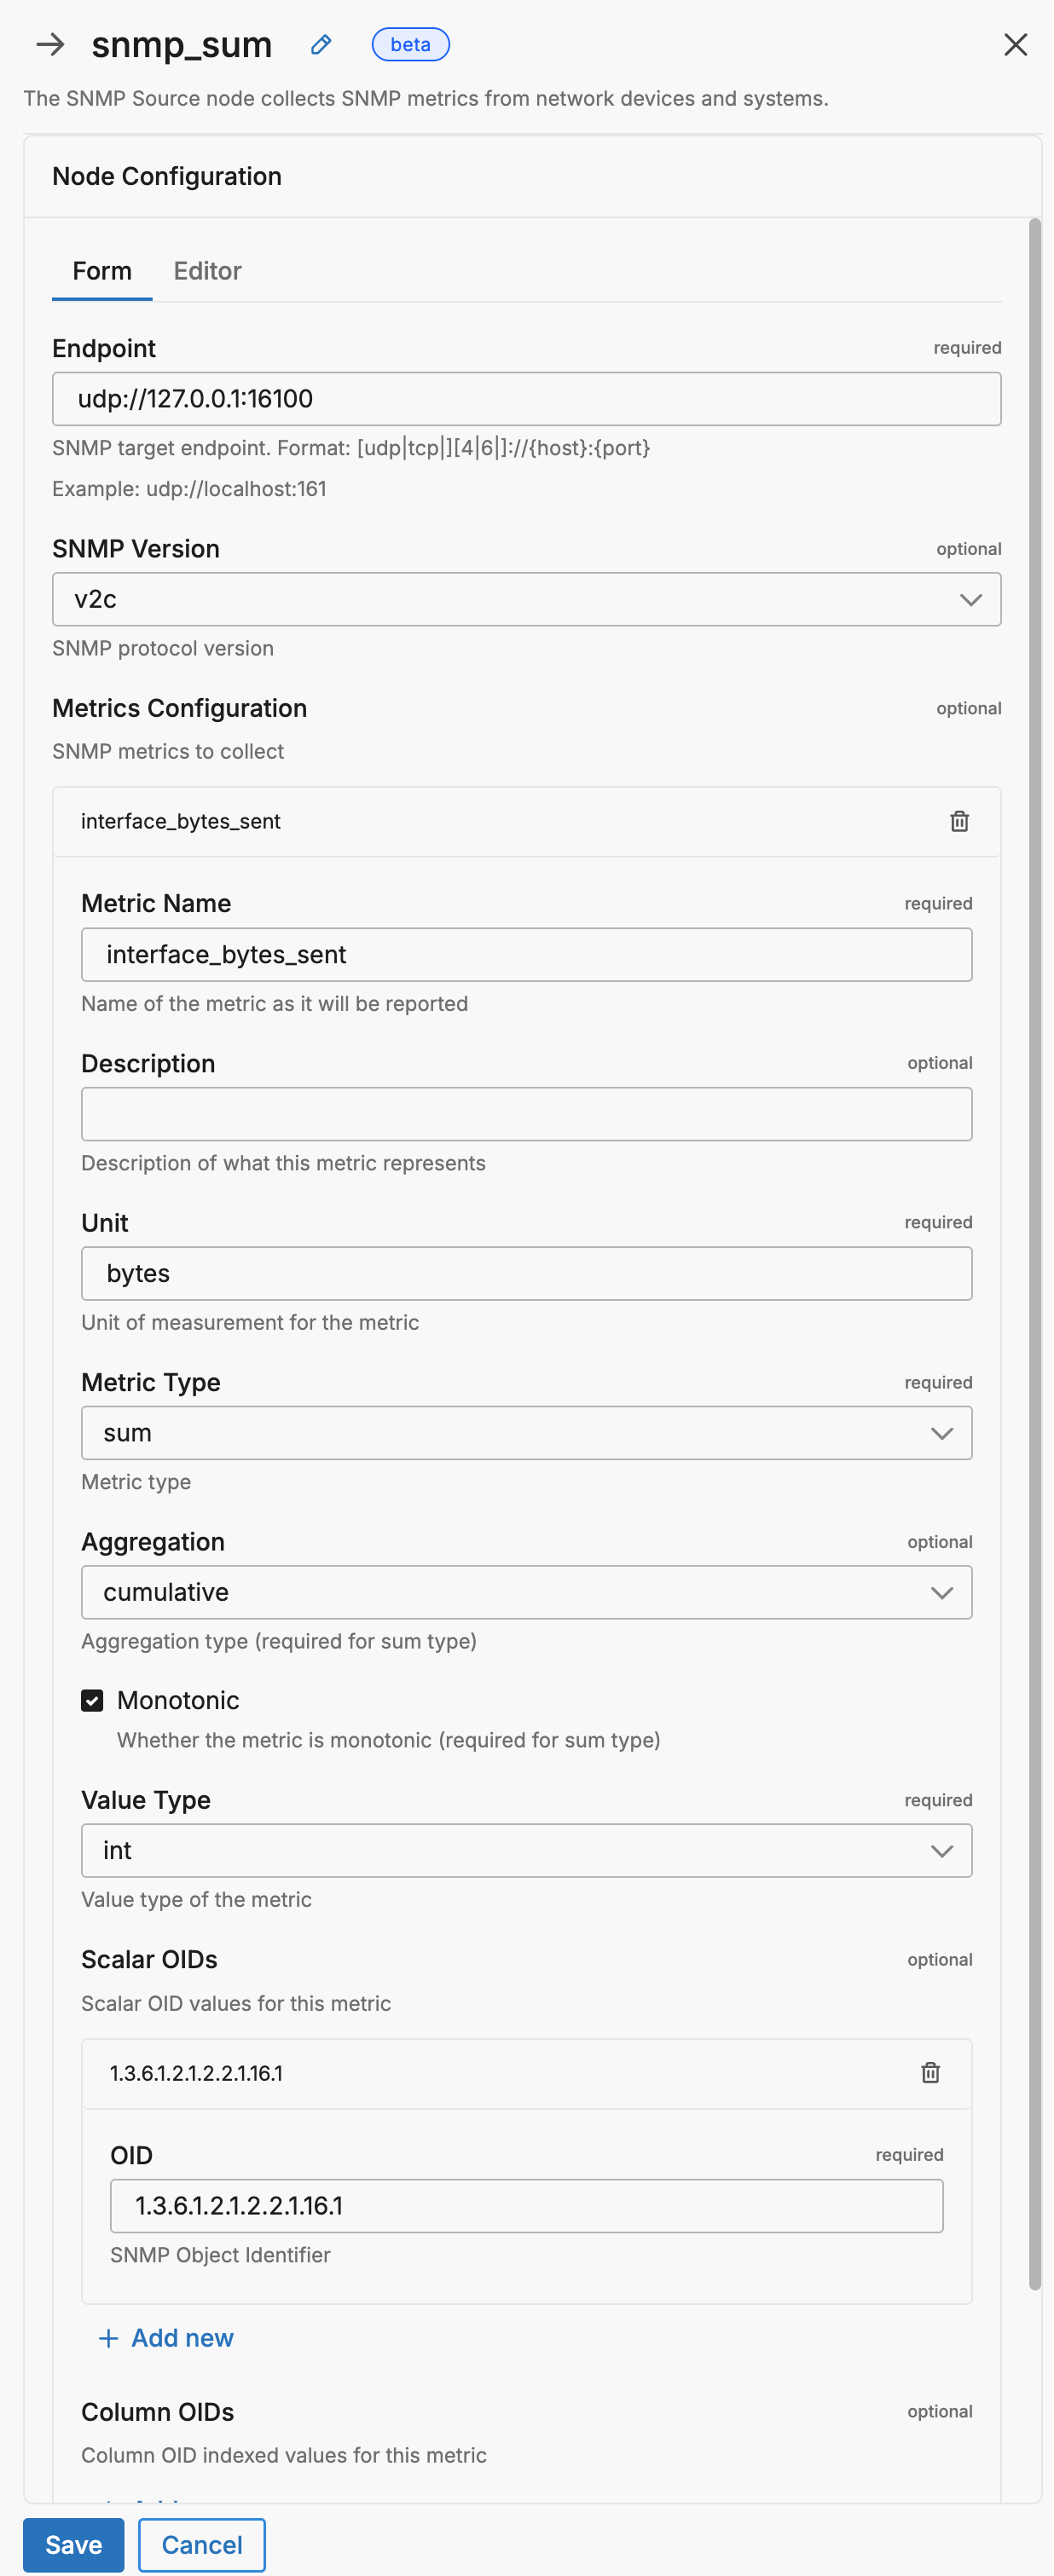
This configuration monitors cumulative network interface statistics. The sum metric type with cumulative aggregation tracks the total bytes sent through a network interface. The monotonic: true setting indicates this counter only increases, making it suitable for calculating rates and detecting counter resets.
nodes:
- name: snmp_sum
  type: snmp_pull_input
  endpoint: udp://127.0.0.1:16100
  metrics:
  - name: interface_bytes_sent
    unit: bytes
    metric_type: sum
    aggregation: cumulative
    monotonic: true
    value_type: int
    scalar_oids:
    - oid: 1.3.6.1.2.1.2.2.1.16.1
Gauge Metric Example
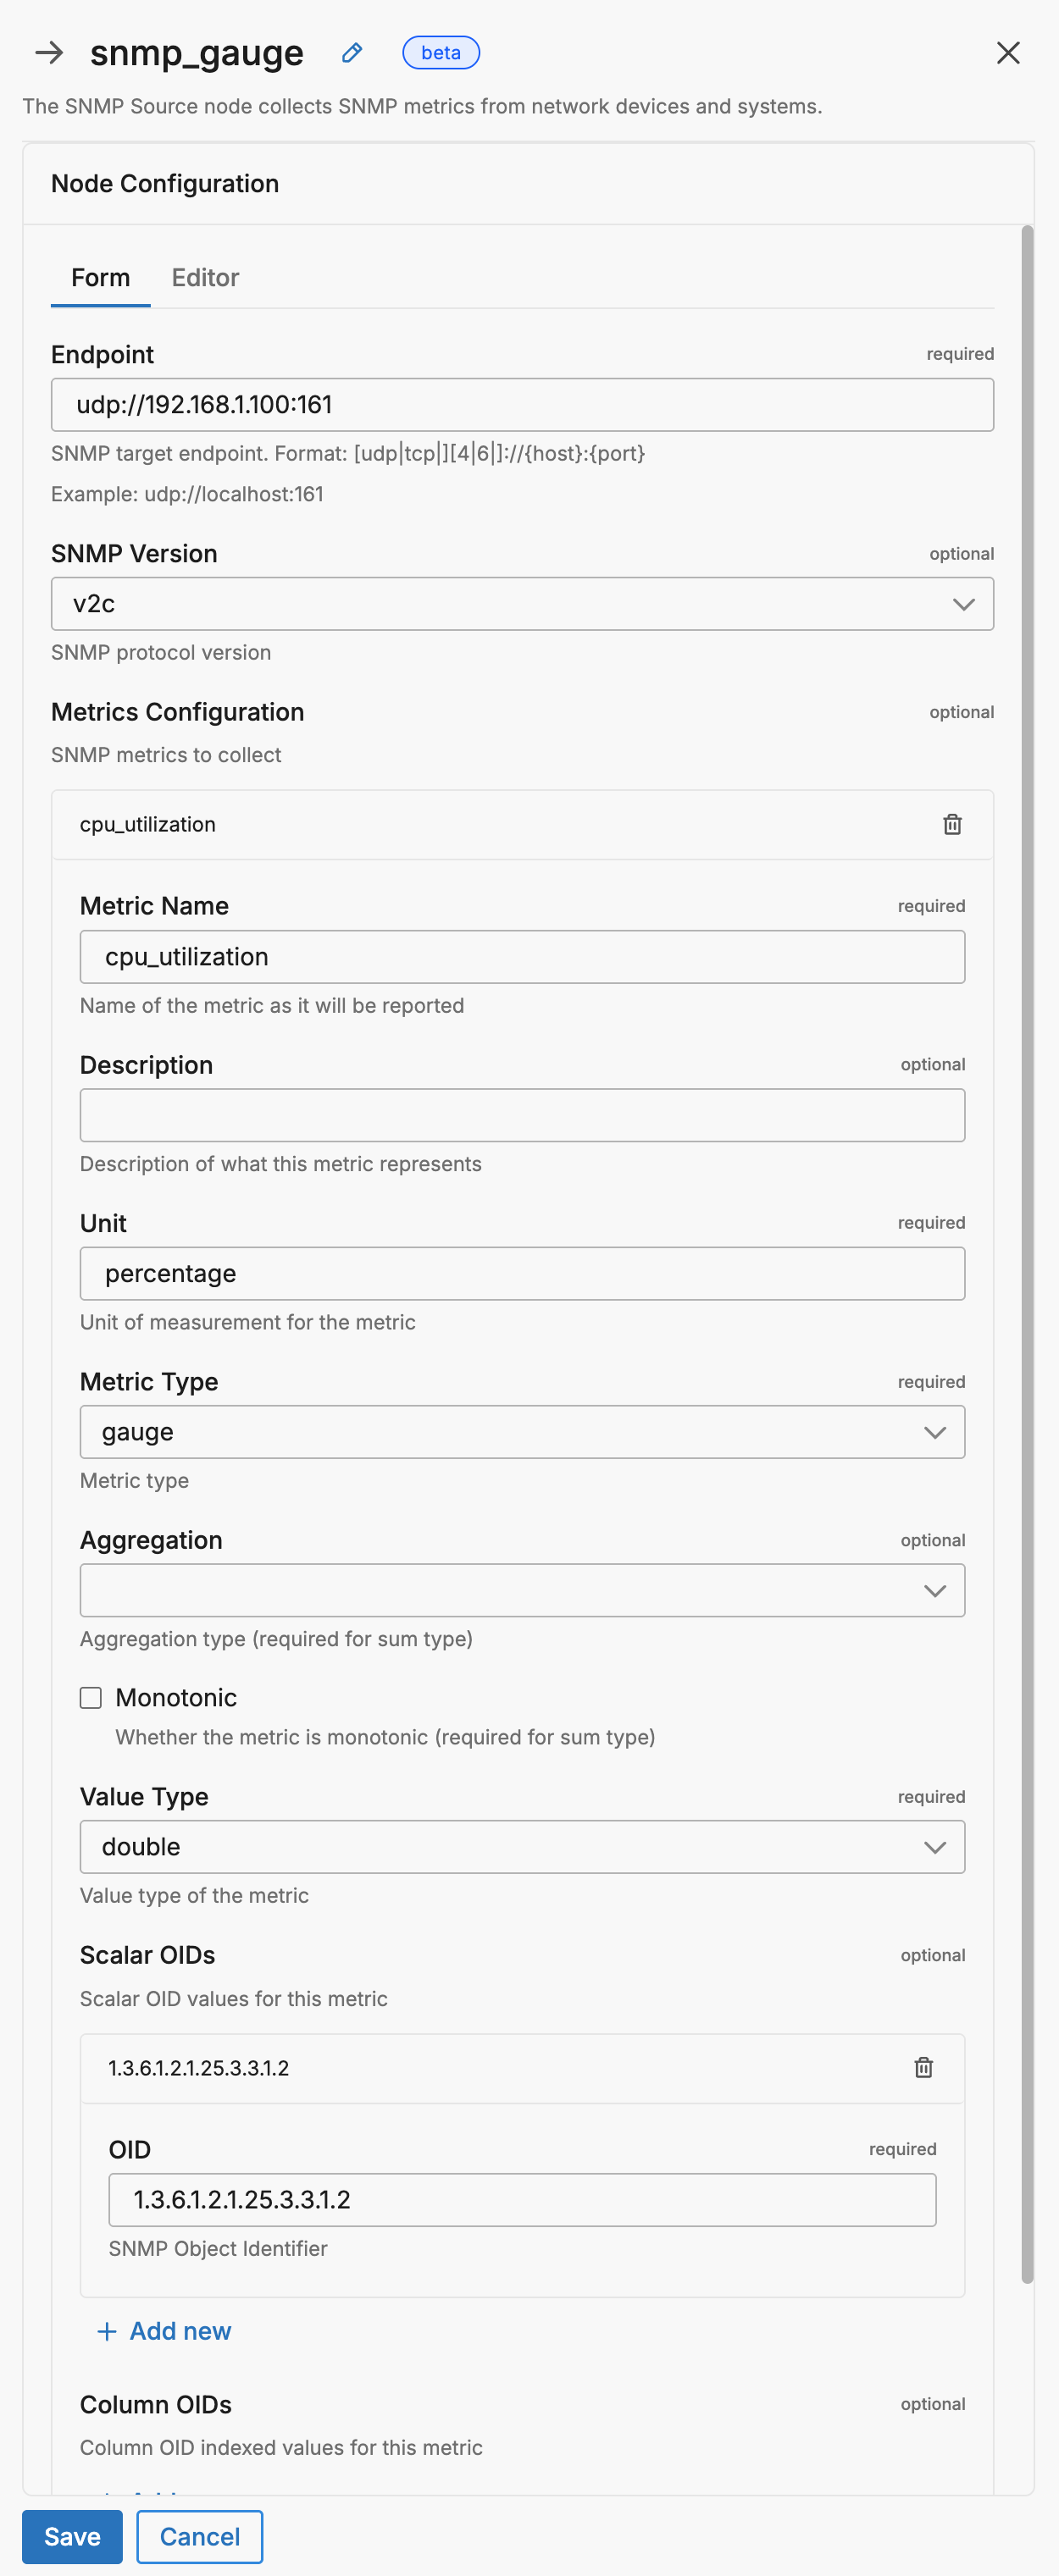
This configuration captures instantaneous CPU utilization from a network device. Gauge metrics are ideal for values that fluctuate naturally, providing a snapshot of the current state. The double value type allows for precise percentage measurements with decimal points.
nodes:
- name: snmp_gauge
  type: snmp_pull_input
  endpoint: udp://192.168.1.100:161
  version: v2c
  community: public
  metrics:
  - name: cpu_utilization
    unit: percentage
    metric_type: gauge
    value_type: double
    scalar_oids:
    - oid: 1.3.6.1.2.1.25.3.3.1.2
Complete Configuration Example
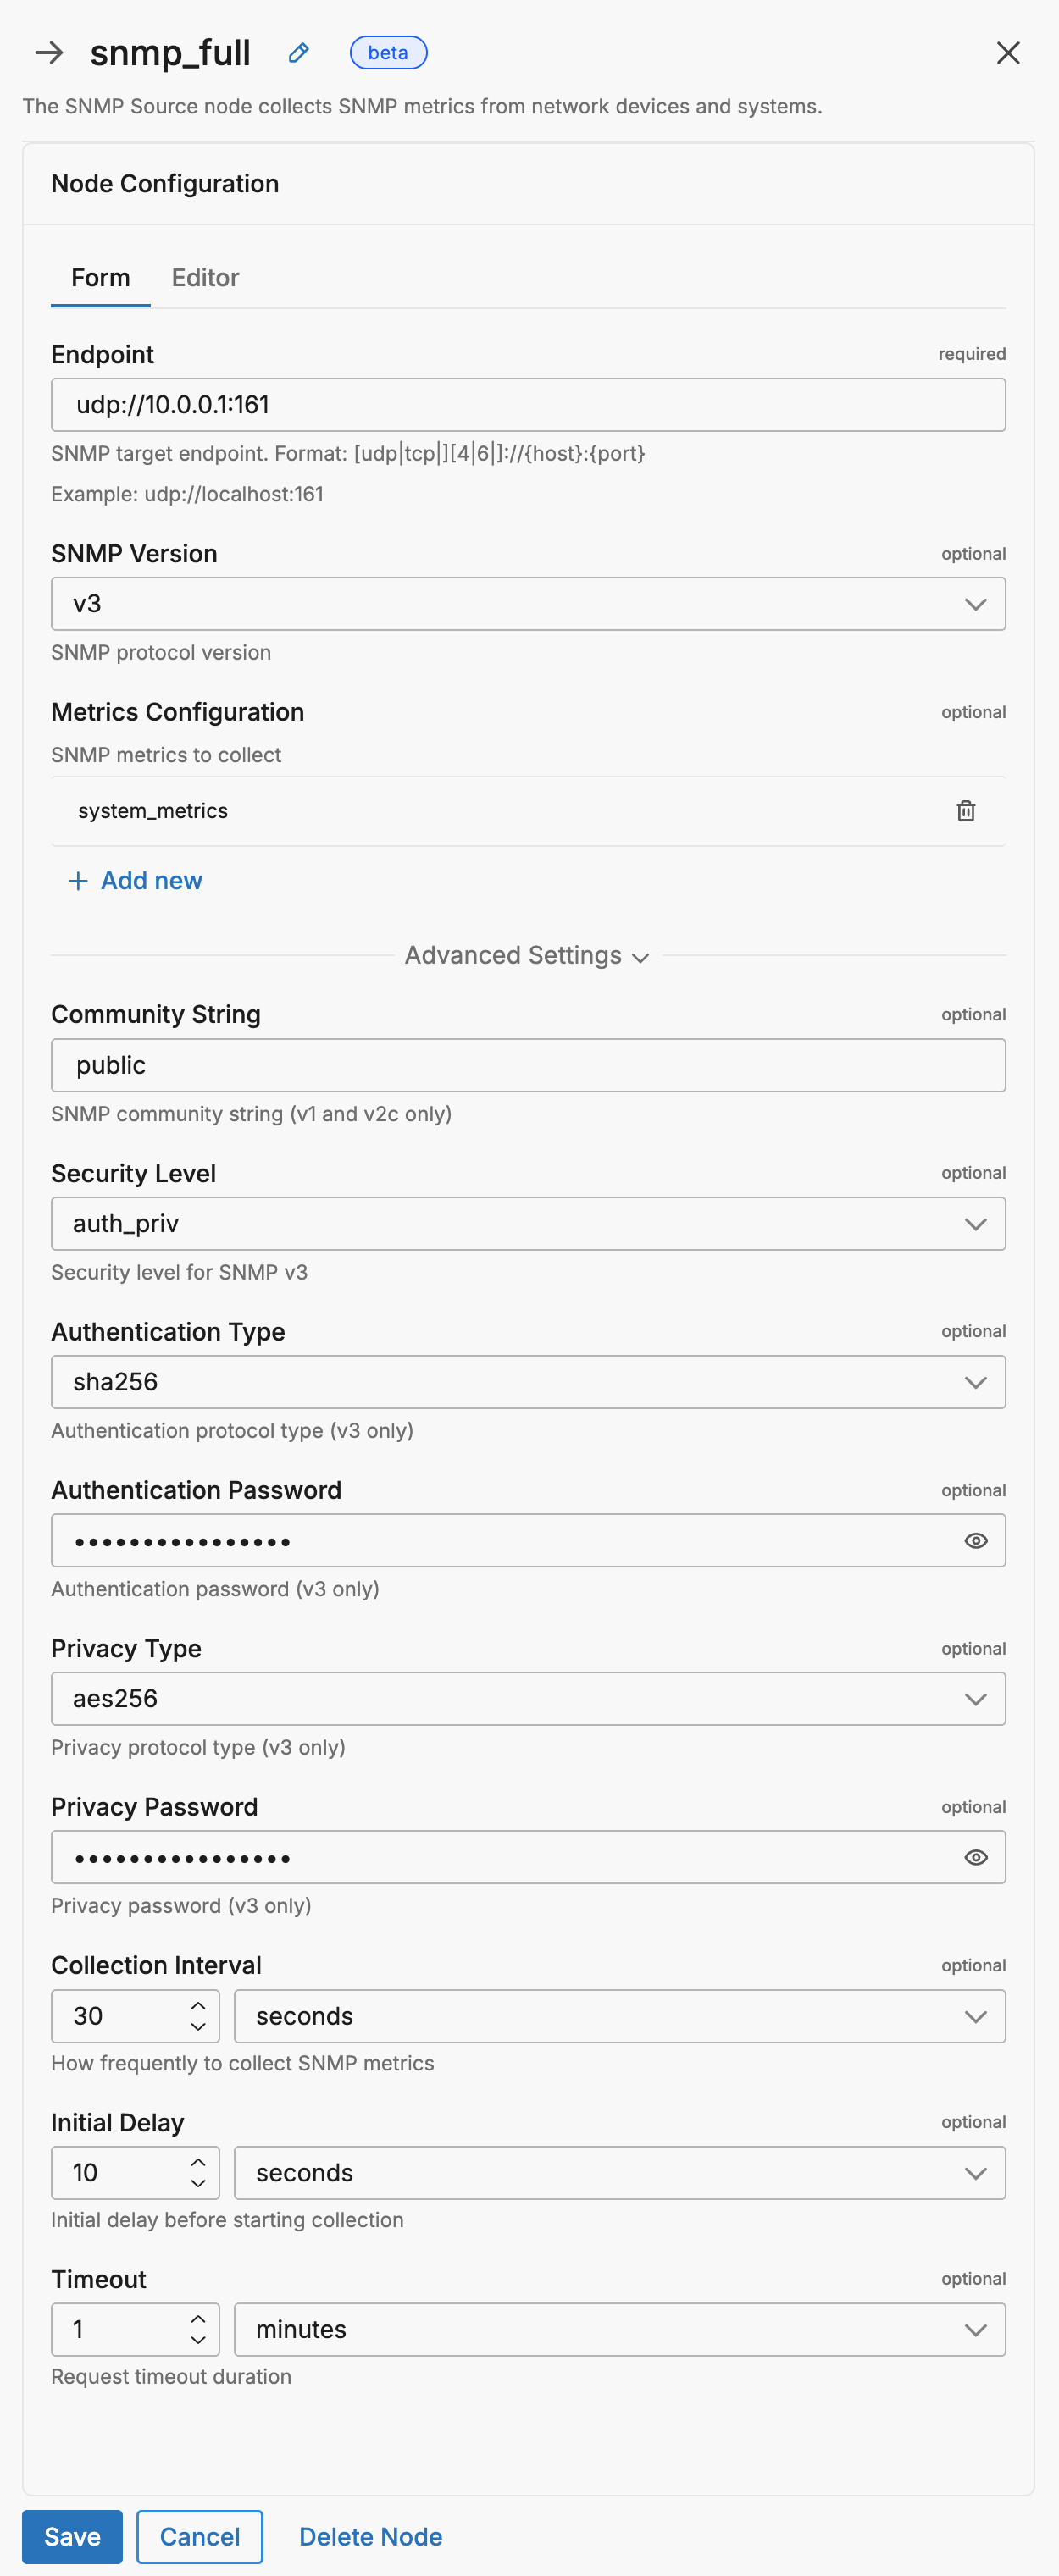
This comprehensive configuration demonstrates enterprise-grade SNMP monitoring with v3 security. It includes authentication using SHA-256 and encryption with AES-256 for secure communication. The configuration also features custom collection intervals for optimized polling frequency and extended timeouts for reliability across high-latency networks.
nodes:
- name: snmp_full
  type: snmp_pull_input
  endpoint: udp://10.0.0.1:161
  version: v3
  community: public
  security_level: auth_priv
  auth_type: sha256
  auth_password: my_auth_password
  privacy_type: aes256
  privacy_password: my_priv_password
  metrics:
  - name: system_metrics
    unit: milliseconds
    metric_type: gauge
    value_type: int
    scalar_oids:
    - oid: 1.3.6.1.2.1.1.3.0
  collection_interval: 30s
  initial_delay: 10s
  timeout: 1m
Example Output
When SNMP metrics are collected, they are converted into OpenTelemetry-compatible metric formats. Here’s an example of actual output from the gauge metric configuration shown above:
{
  "_type": "metric",
  "timestamp": 1755740860152,
  "resource": {
    "host.ip": "172.19.0.2",
    "host.name": "",
    "service.name": ""
  },
  "attributes": {
    "otel.scope.name": "github.com/open-telemetry/opentelemetry-collector-contrib/receiver/snmpreceiver",
    "snmp_oid": ".1.3.6.1.2.1.25.3.3.1.2"
  },
  "gauge": {
    "value": 45.2
  },
  "kind": "gauge",
  "name": "cpu_utilization",
  "unit": "percentage",
  "_stat_type": "gauge"
}
This output demonstrates several key aspects of SNMP metric collection:
- Metric Type Preservation: The gauge metric maintains its type through the pipeline, with the value stored in the
gauge.valuefield - OID Attribution: The original SNMP OID (
.1.3.6.1.2.1.25.3.3.1.2) is preserved in the attributes, allowing you to trace metrics back to their MIB source - OpenTelemetry Integration: The metric uses OpenTelemetry’s standard format, including the scope name showing it’s processed by the OTEL SNMP receiver
- Resource Context: The host IP is automatically captured from the SNMP polling context
- Timestamp Precision: Millisecond-precision timestamps for accurate time-series analysis
For sum metrics, the output includes additional aggregation information:
{
  "_type": "metric",
  "timestamp": 1755740979988,
  "resource": {
    "host.ip": "172.19.0.2",
    "host.name": "",
    "service.name": ""
  },
  "attributes": {
    "otel.scope.name": "github.com/open-telemetry/opentelemetry-collector-contrib/receiver/snmpreceiver",
    "snmp_oid": ".1.3.6.1.2.1.2.2.1.16.1"
  },
  "kind": "sum",
  "name": "interface_bytes_sent",
  "sum": {
    "aggregation_temporality": "cumulative",
    "is_monotonic": true,
    "value": 1847293056
  },
  "unit": "bytes",
  "_stat_type": "sum"
}
Sum metrics include:
- Aggregation Temporality: Shows “cumulative” as configured, indicating the value represents a running total
- Monotonic Flag: Set to
truefor counters that only increase, enabling proper rate calculations - Value in Sum Object: The counter value is nested within the
sumobject along with its aggregation properties
Required Parameters
name
A descriptive name for the node. This is the name that will appear in pipeline builder and you can reference this node in the YAML using the name. It must be unique across all nodes. It is a YAML list element so it begins with a - and a space followed by the string. It is a required parameter for all nodes.
nodes:
  - name: <node name>
    type: <node type>
type: snmp_pull_input
The type parameter specifies the type of node being configured. It is specified as a string from a closed list of node types. It is a required parameter.
nodes:
  - name: <node name>
    type: <node type>
endpoint
The endpoint parameter specifies the SNMP target to poll. It must be formatted as [udp|tcp|][4|6|]://{host}:{port}.
- Protocol prefix is optional (defaults to UDP)
- IPv4 or IPv6 can be explicitly specified with
4or6 - Examples:
udp://192.168.1.100:161,tcp://10.0.0.1:161,udp6://[2001:db8::1]:161
It is specified as a string and is a required parameter.
nodes:
  - name: <node name>
    type: snmp_pull_input
    endpoint: udp://192.168.1.100:161
metrics
The metrics parameter defines the metrics to collect from the SNMP device. Each metric configuration includes OIDs to query and how to interpret the returned data. It is specified as an array and is a required parameter.
nodes:
- name: <node name>
  type: snmp_pull_input
  endpoint: <endpoint>
  metrics:
  - name: <metric_name>
    unit: <unit>
    metric_type: <metric_type>
    aggregation: <aggregation_type>
    monotonic: <boolean>
    value_type: <value_type>
    scalar_oids:
    - oid: <oid_string>
Metric Configuration Parameters
name
The name for the metric. This will be used as the metric name in your telemetry pipeline.
unit
The unit of measurement for the metric (e.g., bytes, seconds, packets, percentage).
metric_type
The metric type. Options include:
gauge: For values that can go up or downsum: For cumulative valueshistogram: For distribution of values
aggregation
How the metric values should be aggregated. Required for sum type metrics only. Options include:
cumulative: Running total since the startdelta: Change since last collection
monotonic
Required for sum type metrics only. Indicates if the value only increases. Must be true or false.
value_type
The data type of the metric value. Required for all metric types. Options include:
int: Integer valuesdouble: Floating-point values
scalar_oids
A list of Object Identifiers (OIDs) to query. Each OID represents a specific data point in the device’s MIB.
oid
The OID string (e.g., 1.3.6.1.2.1.1.3.0 for system uptime).
Here are some commonly used OIDs for monitoring:
| OID | Description |
|---|---|
| 1.3.6.1.2.1.1.3.0 | System Uptime |
| 1.3.6.1.2.1.1.5.0 | System Name |
| 1.3.6.1.2.1.2.2.1.10 | Interface In Octets |
| 1.3.6.1.2.1.2.2.1.16 | Interface Out Octets |
| 1.3.6.1.2.1.25.3.3.1.2 | CPU Load |
| 1.3.6.1.2.1.25.2.3.1.6 | Memory Used |
| 1.3.6.1.2.1.25.2.3.1.5 | Memory Total |
resource_attributes
(Optional) Key-value pairs to add as resource attributes to metrics from this OID. Resource attributes provide additional metadata context for the collected metrics.
Example usage:
scalar_oids:
- oid: 1.3.6.1.2.1.1.3.0
  resource_attributes:
    device.type: router
    device.vendor: cisco
    location: datacenter-1
    environment: production
Optional Parameters
disabled
The disabled parameter disables the node in the pipeline. When set to true, the agent ignores the node at startup. You can toggle nodes on or off in the pipeline builder. It is specified as a boolean, defaults to false, and is optional.
nodes:
  - name: <node name>
    type: <node type>
    disabled: true
version
The version parameter specifies the SNMP protocol version to use. Valid options are:
v1: SNMP version 1v2c: SNMP version 2c (default)v3: SNMP version 3 with enhanced security
It is specified as a string and is optional.
nodes:
  - name: <node name>
    type: snmp_pull_input
    endpoint: <endpoint>
    version: v2c
    metrics:
      - <metric_configuration>
community
The community parameter specifies the SNMP community string for authentication. This parameter is required when using SNMP v1 or v2c. Default is public. It is specified as a string and is optional when using v3.
nodes:
  - name: <node name>
    type: snmp_pull_input
    endpoint: <endpoint>
    version: v2c
    community: public
    metrics:
      - <metric_configuration>
timeout
The timeout parameter specifies how long to wait for a response from the SNMP device. Default is 5s. It is specified as a duration and is optional.
nodes:
  - name: <node name>
    type: snmp_pull_input
    endpoint: <endpoint>
    timeout: 1m
    metrics:
      - <metric_configuration>
initial_delay
The initial_delay parameter specifies how long to wait before starting the first collection. This is useful for allowing the system to stabilize before collecting metrics. It is specified as a duration and is optional.
nodes:
  - name: <node name>
    type: snmp_pull_input
    endpoint: <endpoint>
    initial_delay: 10s
    metrics:
      - <metric_configuration>
collection_interval
The collection_interval parameter specifies how often to poll the SNMP device for metrics. Default is 60s. It is specified as a duration and is optional.
nodes:
  - name: <node name>
    type: snmp_pull_input
    endpoint: <endpoint>
    collection_interval: 30s
    metrics:
      - <metric_configuration>
user
The user parameter specifies the SNMP v3 username. This parameter is required when using SNMP version 3. It is specified as a string.
nodes:
  - name: <node name>
    type: snmp_pull_input
    endpoint: <endpoint>
    version: v3
    user: snmp_user
    metrics:
      - <metric_configuration>
rate_limit
The rate_limit parameter enables you to control data ingestion based on system resource usage. This advanced setting helps prevent source nodes from overwhelming the agent by automatically throttling or stopping data collection when CPU or memory thresholds are exceeded.
Use rate limiting to prevent runaway log collection from overwhelming the agent in high-volume sources, protect agent stability in resource-constrained environments with limited CPU/memory, automatically throttle during bursty traffic patterns, and ensure fair resource allocation across source nodes in multi-tenant deployments.
When rate limiting triggers, pull-based sources (File, S3, HTTP Pull) stop fetching new data, push-based sources (HTTP, TCP, UDP, OTLP) reject incoming data, and stream-based sources (Kafka, Pub/Sub) pause consumption. Rate limiting operates at the source node level, where each source with rate limiting enabled independently monitors and enforces its own thresholds.
Rate limiting vs backpressure: Rate limiting and backpressure are different mechanisms. Rate limiting controls data ingestion at the source based on CPU or memory thresholds. Backpressure controls data output at the destination when in-memory queues fill up. Backpressure logs such as
backpressure: dataCh at 92% capacitydo not appear when rate limiting triggers, and rate limiting logs do not appear during backpressure events.
Observability: When rate limiting is active in enforce mode, the agent does not produce INFO, WARN, or ERROR level logs. To confirm that rate limiting is triggering, check the source node’s Bytes I/O metrics in the Edge Delta app for gaps or drops that coincide with expected throttling periods.
Configuration Steps:
- Click Add New in the Rate Limit section
- Click Add New for Evaluation Policy
- Select Policy Type:
- CPU Usage: Monitors CPU consumption and rate limits when usage exceeds defined thresholds. Use for CPU-intensive sources like file parsing or complex transformations.
- Memory Usage: Monitors memory consumption and rate limits when usage exceeds defined thresholds. Use for memory-intensive sources like large message buffers or caching.
- AND (composite): Combines multiple sub-policies with AND logic. All sub-policies must be true simultaneously to trigger rate limiting. Use when you want conservative rate limiting (both CPU and memory must be high).
- OR (composite): Combines multiple sub-policies with OR logic. Any sub-policy can trigger rate limiting. Use when you want aggressive rate limiting (either CPU or memory being high triggers).
- Select Evaluation Mode. Choose how the policy behaves when thresholds are exceeded:
- Enforce (default): Actively applies rate limiting when thresholds are met. Pull-based sources (File, S3, HTTP Pull) stop fetching new data, push-based sources (HTTP, TCP, UDP, OTLP) reject incoming data, and stream-based sources (Kafka, Pub/Sub) pause consumption. Use in production to protect agent resources.
- Monitor: Logs when rate limiting would occur without actually limiting data flow. Use for testing thresholds before enforcing them in production.
- Passthrough: Disables rate limiting entirely while keeping the configuration in place. Use to temporarily disable rate limiting without removing configuration.
- Set Absolute Limits and Relative Limits (for CPU Usage and Memory Usage policies)
Note: If you specify both absolute and relative limits, the system evaluates both conditions and rate limiting triggers when either condition is met (OR logic). For example, if you set absolute limit to
1.0CPU cores and relative limit to50%, rate limiting triggers when the source uses either 1 full core OR 50% of available CPU, whichever happens first.
For CPU Absolute Limits: Enter value in full core units:
0.1= one-tenth of a CPU core0.5= half a CPU core1.0= one full CPU core2.0= two full CPU cores
For CPU Relative Limits: Enter percentage of total available CPU (0-100):
50= 50% of available CPU75= 75% of available CPU85= 85% of available CPU
For Memory Absolute Limits: Enter value in bytes
104857600= 100Mi (100 × 1024 × 1024)536870912= 512Mi (512 × 1024 × 1024)1073741824= 1Gi (1 × 1024 × 1024 × 1024)
For Memory Relative Limits: Enter percentage of total available memory (0-100)
60= 60% of available memory75= 75% of available memory80= 80% of available memory
- Set Refresh Interval (for CPU Usage and Memory Usage policies). Specify how frequently the system checks resource usage:
- Recommended Values:
10sto30sfor most use cases5sto10sfor high-volume sources requiring quick response1mor higher for stable, low-volume sources
The system fetches current CPU/memory usage at the specified refresh interval and uses that value for evaluation until the next refresh. Shorter intervals provide more responsive rate limiting but incur slightly higher overhead, while longer intervals are more efficient but slower to react to sudden resource spikes.
The GUI generates YAML as follows:
# Simple CPU-based rate limiting
nodes:
  - name: <node name>
    type: <node type>
    rate_limit:
      evaluation_policy:
        policy_type: cpu_usage
        evaluation_mode: enforce
        absolute_limit: 0.5  # Limit to half a CPU core
        refresh_interval: 10s
# Simple memory-based rate limiting
nodes:
  - name: <node name>
    type: <node type>
    rate_limit:
      evaluation_policy:
        policy_type: memory_usage
        evaluation_mode: enforce
        absolute_limit: 536870912  # 512Mi in bytes
        refresh_interval: 30s
Composite Policies (AND / OR)
When using AND or OR policy types, you define sub-policies instead of limits. Sub-policies must be siblings (at the same level)—do not nest sub-policies within other sub-policies. Each sub-policy is independently evaluated, and the parent policy’s evaluation mode applies to the composite result.
- AND Logic: All sub-policies must evaluate to true at the same time to trigger rate limiting. Use when you want conservative rate limiting (limit only when CPU AND memory are both high).
- OR Logic: Any sub-policy evaluating to true triggers rate limiting. Use when you want aggressive protection (limit when either CPU OR memory is high).
Configuration Steps:
- Select AND (composite) or OR (composite) as the Policy Type
- Choose the Evaluation Mode (typically Enforce)
- Click Add New under Sub-Policies to add the first condition
- Configure the first sub-policy by selecting policy type (CPU Usage or Memory Usage), selecting evaluation mode, setting absolute and/or relative limits, and setting refresh interval
- In the parent policy (not within the child), click Add New again to add a sibling sub-policy
- Configure additional sub-policies following the same pattern
The GUI generates YAML as follows:
# AND composite policy - both CPU AND memory must exceed limits
nodes:
  - name: <node name>
    type: <node type>
    rate_limit:
      evaluation_policy:
        policy_type: and
        evaluation_mode: enforce
        sub_policies:
          # First sub-policy (sibling)
          - policy_type: cpu_usage
            evaluation_mode: enforce
            absolute_limit: 0.75  # Limit to 75% of one core
            refresh_interval: 15s
          # Second sub-policy (sibling)
          - policy_type: memory_usage
            evaluation_mode: enforce
            absolute_limit: 1073741824  # 1Gi in bytes
            refresh_interval: 15s
# OR composite policy - either CPU OR memory can trigger
nodes:
  - name: <node name>
    type: <node type>
    rate_limit:
      evaluation_policy:
        policy_type: or
        evaluation_mode: enforce
        sub_policies:
          - policy_type: cpu_usage
            evaluation_mode: enforce
            relative_limit: 85  # 85% of available CPU
            refresh_interval: 20s
          - policy_type: memory_usage
            evaluation_mode: enforce
            relative_limit: 80  # 80% of available memory
            refresh_interval: 20s
# Monitor mode for testing thresholds
nodes:
  - name: <node name>
    type: <node type>
    rate_limit:
      evaluation_policy:
        policy_type: memory_usage
        evaluation_mode: monitor  # Only logs, doesn't limit
        relative_limit: 70  # Test at 70% before enforcing
        refresh_interval: 30s
source_metadata
This option is used to define which detected resources and attributes to add to each data item as it is ingested by Edge Delta. You can select:
- Required Only: This option includes the minimum required resources and attributes for Edge Delta to operate.
- Default: This option includes the required resources and attributes plus those selected by Edge Delta
- High: This option includes the required resources and attributes along with a larger selection of common optional fields.
- Custom: With this option selected, you can choose which attributes and resources to include. The required fields are selected by default and can’t be unchecked.
Based on your selection in the GUI, the source_metadata YAML is populated as two dictionaries (resource_attributes and attributes) with Boolean values.
See Choose Data Item Metadata for more information on selecting metadata.
Advanced Configuration
SNMP v3 Configuration
For SNMP v3, additional security parameters are available:
nodes:
- name: snmp_v3_input
  type: snmp_pull_input
  endpoint: udp://192.168.1.100:161
  version: v3
  user: snmpuser
  security_level: auth_priv
  auth_type: sha256
  auth_password: authpass123
  privacy_type: aes256
  privacy_password: privpass123
  metrics:
  - name: system_uptime
    unit: seconds
    metric_type: gauge
    value_type: int
    scalar_oids:
    - oid: 1.3.6.1.2.1.1.3.0
SNMP v3 Security Parameters
user
The SNMP v3 username (required for v3).
security_level
The security level for SNMP v3. Options include:
no_auth_no_priv: No authentication or encryption (default)auth_no_priv: Authentication onlyauth_priv: Authentication and encryption
auth_type
Authentication protocol. Options include:
md5: MD5 authentication (default)sha1: SHA-1 authenticationsha256: SHA-256 authenticationsha384: SHA-384 authenticationsha512: SHA-512 authentication
auth_password
Authentication password (required when security_level includes auth).
This field supports secret references for secure credential management. Instead of hardcoding sensitive values, you can reference a secret configured in your pipeline.
To use a secret in the GUI:
- Create a secret in your pipeline’s Settings > Secrets section (see Secrets)
- In this field, select the secret name from the dropdown list that appears
To use a secret in YAML:
Reference it using the syntax: '{{ SECRET secret-name }}'
Example:
field_name: '{{ SECRET my-credential }}'
Note: The secret reference must be enclosed in single quotes when using YAML. Secret values are encrypted at rest and resolved at runtime, ensuring no plaintext credentials appear in logs or API responses.
privacy_type
Encryption protocol. Options include:
des: DES encryption (default)aes: AES-128 encryptionaes192: AES-192 encryptionaes256: AES-256 encryptionaes192c: AES-192 with CFB modeaes256c: AES-256 with CFB mode
privacy_password
Encryption password (required when security_level is auth_priv).
This field supports secret references for secure credential management. Instead of hardcoding sensitive values, you can reference a secret configured in your pipeline.
To use a secret in the GUI:
- Create a secret in your pipeline’s Settings > Secrets section (see Secrets)
- In this field, select the secret name from the dropdown list that appears
To use a secret in YAML:
Reference it using the syntax: '{{ SECRET secret-name }}'
Example:
field_name: '{{ SECRET my-credential }}'
Note: The secret reference must be enclosed in single quotes when using YAML. Secret values are encrypted at rest and resolved at runtime, ensuring no plaintext credentials appear in logs or API responses.
Multiple Device Monitoring
To monitor multiple SNMP devices, create separate SNMP input nodes for each device:
nodes:
- name: router_snmp
  type: snmp_pull_input
  endpoint: udp://192.168.1.1:161
  metrics:
  - name: router_uptime
    unit: seconds
    metric_type: gauge
    value_type: int
    scalar_oids:
    - oid: 1.3.6.1.2.1.1.3.0

- name: switch_snmp
  type: snmp_pull_input
  endpoint: udp://192.168.1.2:161
  metrics:
  - name: switch_port_status
    unit: status
    metric_type: gauge
    value_type: int
    scalar_oids:
    - oid: 1.3.6.1.2.1.2.2.1.8.1
Configuration Wizard
Use this interactive wizard to generate a starter configuration:
Which SNMP version does your device support?
Choose the protocol version based on your device capabilities and security requirements.