Splunk TCP Connector
Configure the Splunk TCP connector to receive data from Splunk Universal Forwarders and Heavy Forwarders for AI-powered analysis of Splunk-instrumented infrastructure.
17 minute read
Overview
The Splunk TCP connector receives data from Splunk Universal Forwarders (UF) and Splunk Heavy Forwarders using the native Splunk TCP protocol. Splunk forwarders are widely deployed across enterprises to collect and forward logs, metrics, and events from servers, applications, and infrastructure. Content streams into Edge Delta Pipelines for analysis by AI teammates through the Edge Delta MCP connector.
The connector implements the Splunk forwarder protocol, accepting connections from Splunk forwarders and parsing Splunk metadata including index, sourcetype, source, host, and timestamps. Edge Delta acts as a Splunk indexer receiver, enabling Splunk-instrumented infrastructure to send data for AI-powered analysis without modifying forwarder configurations.
When you add this streaming connector, it appears as a Splunk TCP source in your selected pipeline. AI teammates access this data by querying the Edge Delta backend with the Edge Delta MCP connector.
Add the Splunk TCP Connector
To add the Splunk TCP connector, you configure Edge Delta to listen for incoming Splunk forwarder traffic, then update Splunk forwarders to send data to Edge Delta.
Prerequisites
Before configuring the connector, ensure you have:
- Splunk Universal Forwarder or Heavy Forwarder configured and running
- Network connectivity from Splunk forwarders to Edge Delta agents
- Firewall rules allowing inbound TCP traffic on chosen port (9997 or 3421)
- Administrative access to modify Splunk forwarder
outputs.conffiles
Configuration Steps
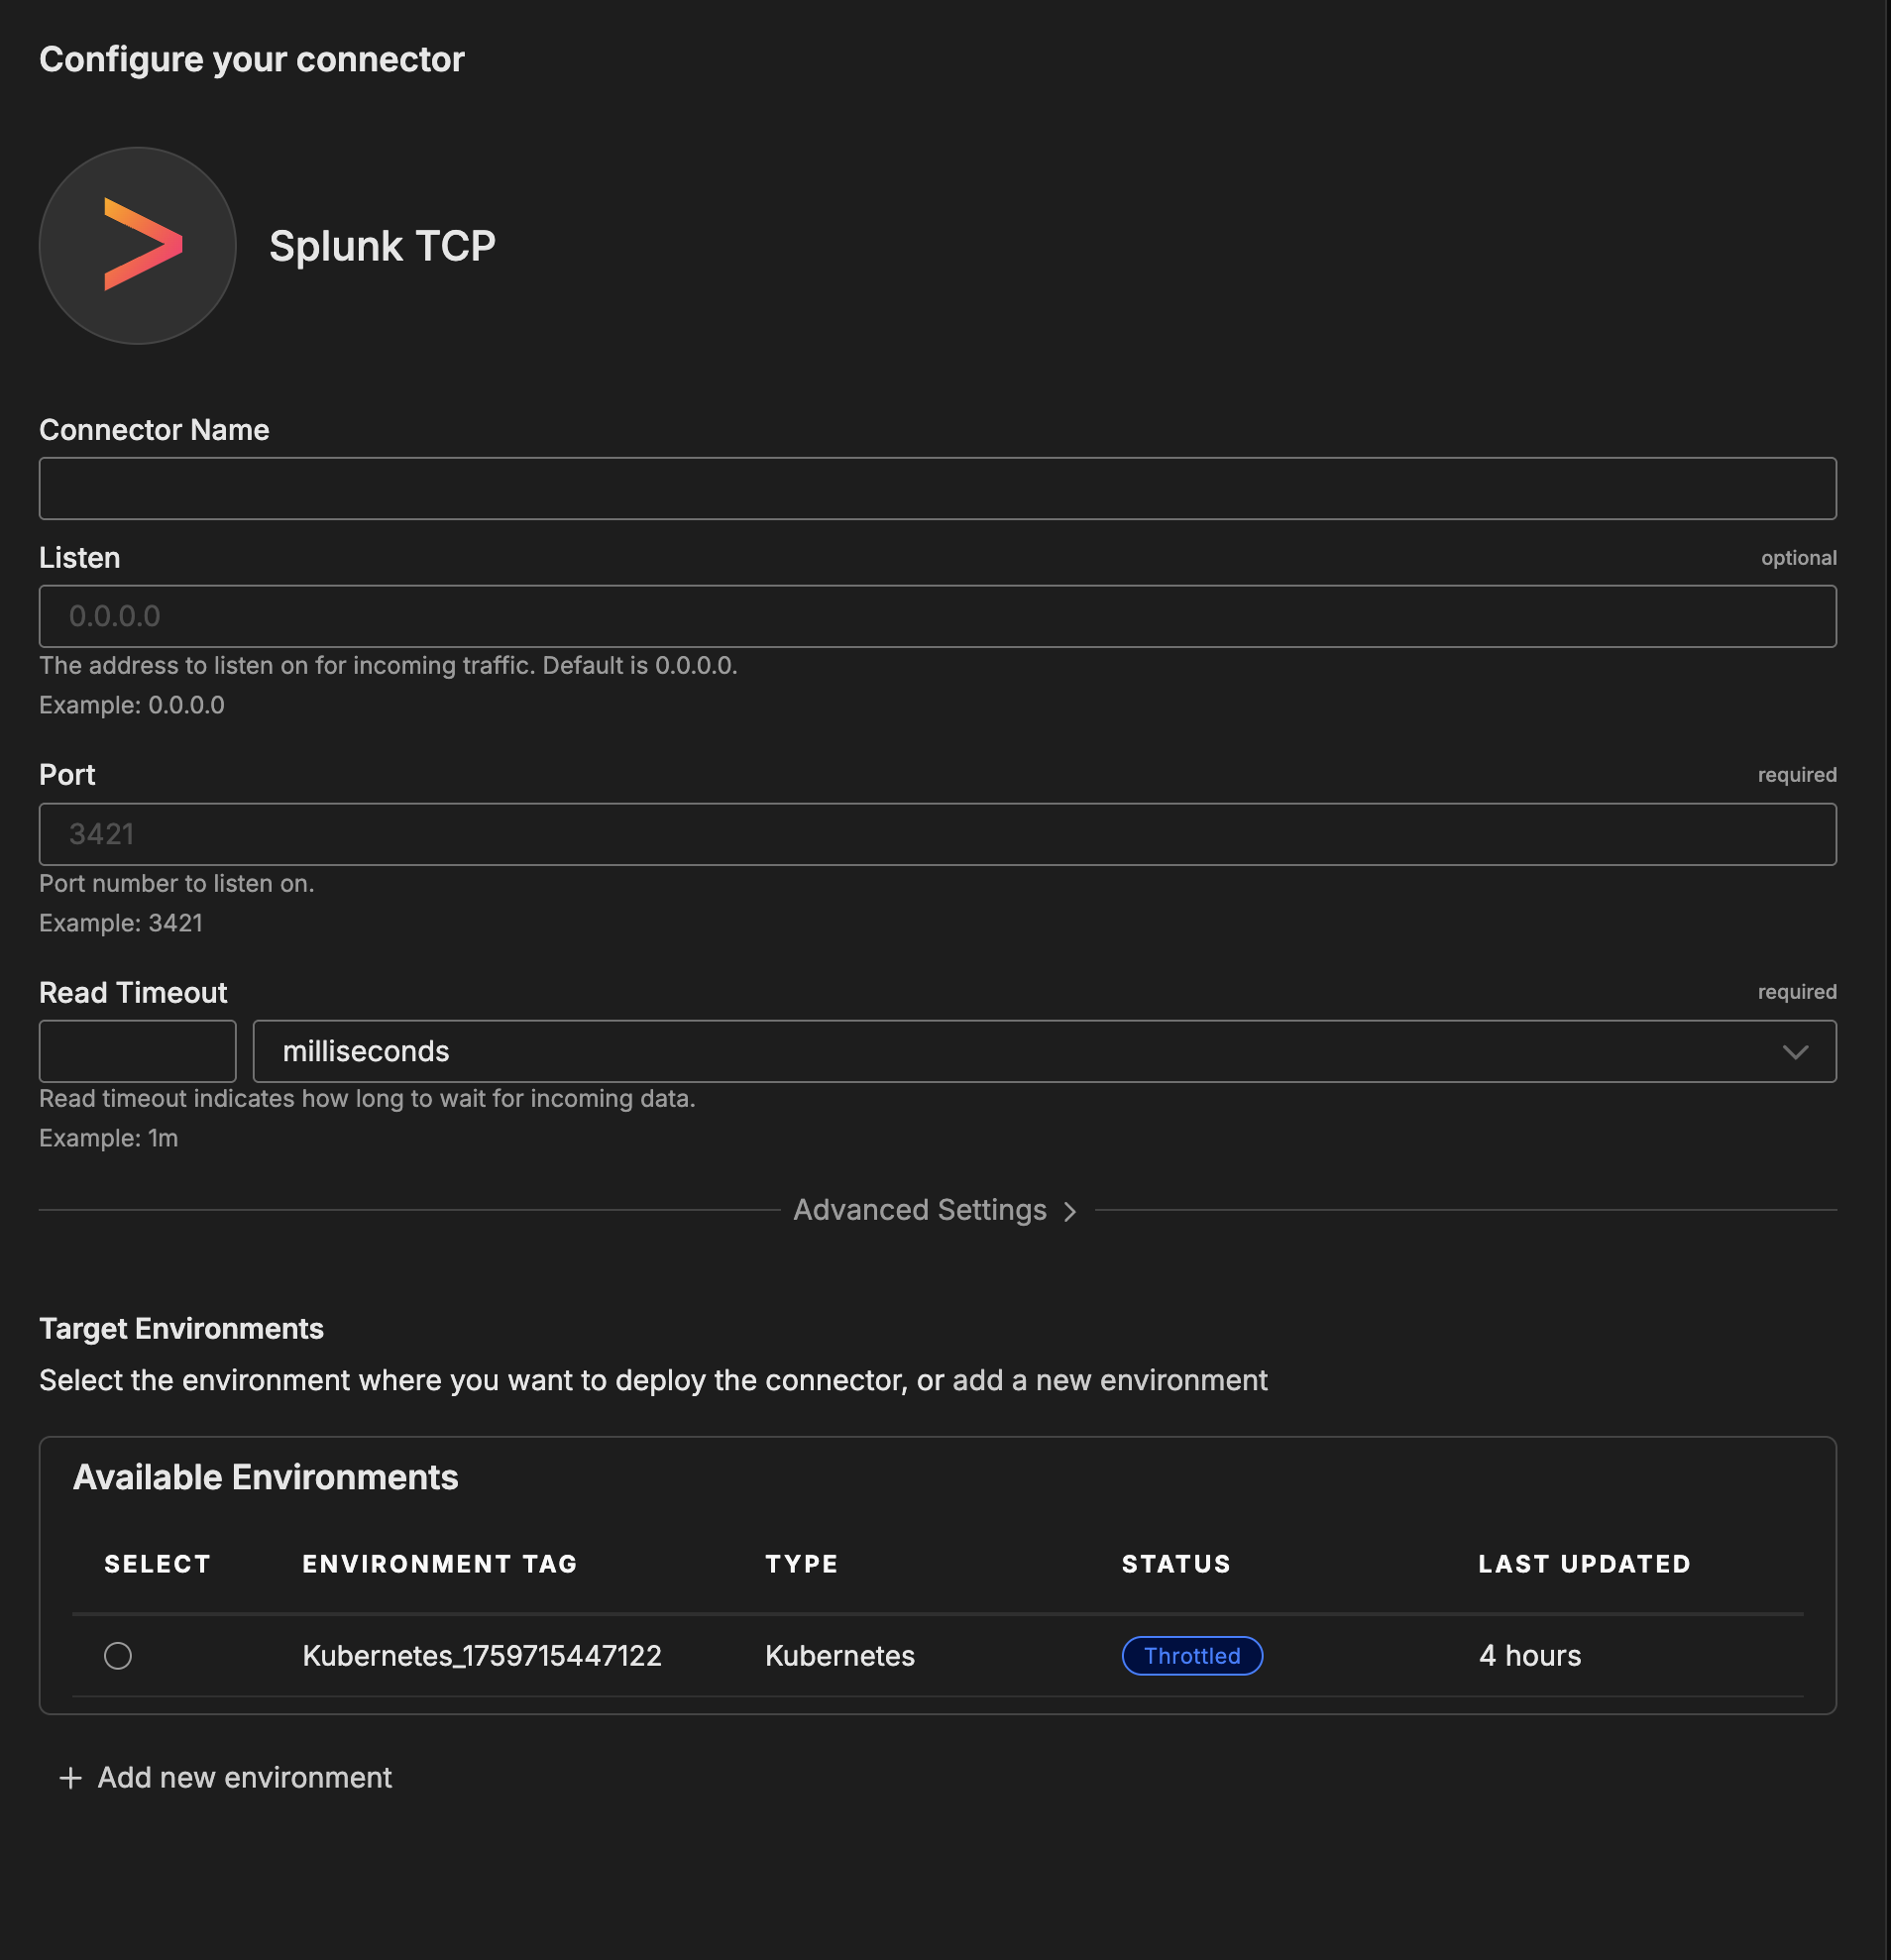
- Navigate to AI Team > Connectors in the Edge Delta application
- Find the Splunk TCP connector in Streaming Connectors
- Click the connector card
- Configure Listen address (default
0.0.0.0for all interfaces) - Set Port number (9997 for Splunk standard or 3421 custom)
- Configure Read Timeout (how long to wait for incoming data)
- Optionally configure Advanced Settings for TLS, rate limiting
- Select a target environment
- Click Save
The connector deploys and begins listening for Splunk forwarder connections.
Configure Splunk forwarders to send data to Edge Delta by editing $SPLUNK_HOME/etc/system/local/outputs.conf:
[tcpout]
defaultGroup = edgedelta

[tcpout:edgedelta]
server = edge-delta-host:9997
compressed = false
Restart Splunk forwarder after configuration:
$SPLUNK_HOME/bin/splunk restart
Configuration Options
Connector Name
Name to identify this Splunk TCP connector instance.
Listen
IP address to bind to for listening.
Format: IPv4 address
Default: 0.0.0.0 (all interfaces)
Examples:
0.0.0.0- Listen on all network interfaces192.168.1.100- Listen only on specific interface127.0.0.1- Local host only (testing)
Port
TCP port to listen on for incoming Splunk forwarder traffic.
Format: Integer between 1 and 65535
Default: 3421
Examples:
9997- Splunk standard receiving port3421- Edge Delta default port9998- Alternative Splunk port
Note: Splunk forwarders typically use port 9997 by default
Read Timeout
How long to wait for incoming data before timing out connection.
Format: Duration (milliseconds, seconds, minutes)
Default: 1m
Examples:
30s- 30 seconds for faster dead connection detection1m- 1 minute balanced timeout2m- 2 minutes for sparse event streams
Purpose: Prevents idle or disconnected forwarders from holding connections open
Advanced Settings
TLS
Configure TLS settings for secure connections to this source. TLS is optional and typically used when the source node needs to accept encrypted connections or perform mutual TLS authentication with clients.
YAML Configuration Example:
nodes:
  - name: <node name>
    type: <source type>
    tls:
      <tls options>
CA Certificate File
Specifies the absolute path to a single CA (Certificate Authority) certificate file used to verify client certificates during mutual TLS authentication. This file contains the trusted CA certificate that signed the client certificates. Use this when you have a single CA certificate. (YAML parameter: ca_file)
When to use: Required when client_auth_type is set to verifyclientcertifgiven or requireandverifyclientcert. Choose either ca_file or ca_path, not both.
YAML Configuration Example:
nodes:
  - name: <node name>
    type: <source type>
    tls:
      ca_file: /certs/ca.pem
      client_auth_type: requireandverifyclientcert
CA Certificate Path
Specifies a directory path containing one or more CA certificate files for client certificate verification. Use this when you need to trust multiple CAs or when managing CA certificates across multiple files. All certificate files in the directory will be loaded. (YAML parameter: ca_path)
When to use: Alternative to ca_file when you have multiple CA certificates. Required when client_auth_type is set to verifyclientcertifgiven or requireandverifyclientcert. Choose either ca_file or ca_path, not both.
YAML Configuration Example:
nodes:
  - name: <node name>
    type: <source type>
    tls:
      ca_path: /certs/ca-certificates/
      client_auth_type: requireandverifyclientcert
Certificate File
Path to the server certificate file (public key) that will be presented to connecting clients during the TLS handshake. This certificate identifies the server and must match the private key. The certificate should be in PEM format and can include the full certificate chain. (YAML parameter: crt_file)
When to use: Required for TLS/HTTPS connections. Must be used together with key_file. Obtain this from your certificate authority or generate a self-signed certificate for testing.
YAML Configuration Example:
nodes:
  - name: <node name>
    type: <source type>
    tls:
      crt_file: /certs/server-cert.pem
      key_file: /certs/server-key.pem
Private Key File
Path to the private key file corresponding to the server certificate. This key must match the public key in the certificate file and is used to decrypt communications encrypted with the public key. Keep this file secure and restrict access permissions. (YAML parameter: key_file)
When to use: Required for TLS/HTTPS connections. Must be used together with crt_file. If the key file is encrypted, also specify key_password.
YAML Configuration Example:
nodes:
  - name: <node name>
    type: <source type>
    tls:
      crt_file: /certs/server-cert.pem
      key_file: /certs/server-key.pem
      key_password: <password>  # Only if key is encrypted
Private Key Password
Password (passphrase) used to decrypt an encrypted private key file. Only needed if your private key file is password-protected. If your key file is unencrypted, omit this parameter. (YAML parameter: key_password)
When to use: Optional. Only required if key_file is encrypted/password-protected. For enhanced security, use encrypted keys in production environments.
YAML Configuration Example:
nodes:
  - name: <node name>
    type: <source type>
    tls:
      crt_file: /certs/server-cert.pem
      key_file: /certs/encrypted-server-key.pem
      key_password: mySecurePassword123
Client Authentication Type
Controls how client certificates are requested and validated during the TLS handshake. This setting is specific to server-side TLS and determines the mutual TLS (mTLS) behavior. Use this to enforce certificate-based authentication from connecting clients for enhanced security. (YAML parameter: client_auth_type)
Valid options:
noclientcert- No client certificate is requested; any sent certificates are ignored. Use for standard TLS encryption without client authentication.requestclientcert- Client certificate is requested but not required. Useful for optional client authentication where you want to accept both authenticated and unauthenticated clients.requireanyclientcert- Client must send a certificate, but it is not validated against a CA. Use when you need proof a client has a certificate but don’t need to verify its authenticity.verifyclientcertifgiven- Certificate is requested but not required; if sent, it must be valid and signed by a trusted CA. Balances security with flexibility for mixed client environments.requireandverifyclientcert- Client must send a valid certificate signed by a trusted CA (full mutual TLS). Use for maximum security when all clients can be provisioned with certificates.
Default: noclientcert
When to use: Set to verifyclientcertifgiven or requireandverifyclientcert for secure environments where you need to verify client identity. When using certificate verification options, you must also configure ca_file or ca_path to specify the trusted CA certificates.
YAML Configuration Example:
nodes:
  - name: <node name>
    type: <source type>
    tls:
      client_auth_type: requireandverifyclientcert
      ca_file: /certs/ca.pem  # Required for certificate validation
Minimum TLS Version
Minimum TLS protocol version that will be accepted from connecting clients. This enforces a baseline security level by rejecting connections from clients using older, less secure TLS versions. (YAML parameter: min_version)
Available versions:
TLSv1_0- Deprecated, not recommended (security vulnerabilities)TLSv1_1- Deprecated, not recommended (security vulnerabilities)TLSv1_2- Recommended minimum for production (default)TLSv1_3- Most secure, use when all clients support it
Default: TLSv1_2
When to use: Set to TLSv1_2 or higher for production deployments. Only use TLSv1_0 or TLSv1_1 if you must support legacy clients that cannot upgrade, and be aware of the security risks. TLS 1.0 and 1.1 are officially deprecated and should be avoided.
YAML Configuration Example:
nodes:
  - name: <node name>
    type: <source type>
    tls:
      min_version: TLSv1_2
Maximum TLS Version
Maximum TLS protocol version that will be accepted from connecting clients. This is typically used to restrict newer TLS versions if compatibility issues arise with specific client implementations. (YAML parameter: max_version)
Available versions:
TLSv1_0TLSv1_1TLSv1_2TLSv1_3
When to use: Usually left unset to allow the most secure version available. Only set this if you encounter specific compatibility issues with TLS 1.3 clients, or for testing purposes. In most cases, you should allow the latest TLS version.
YAML Configuration Example:
nodes:
  - name: <node name>
    type: <source type>
    tls:
      max_version: TLSv1_3
When to Use: Enable for production environments with sensitive log data
Splunk forwarder TLS configuration (outputs.conf):
[tcpout:edgedelta]
server = edge-delta-host:9997
sslCertPath = $SPLUNK_HOME/etc/auth/server.pem
sslPassword = password
sslVerifyServerCert = false
Metadata Level (Resource Attributes)
This option is used to define which detected resources and attributes to add to each data item as it is ingested by Edge Delta. You can select:
- Required Only: This option includes the minimum required resources and attributes for Edge Delta to operate.
- Default: This option includes the required resources and attributes plus those selected by Edge Delta
- High: This option includes the required resources and attributes along with a larger selection of common optional fields.
- Custom: With this option selected, you can choose which attributes and resources to include. The required fields are selected by default and can’t be unchecked.
Based on your selection in the GUI, the source_metadata YAML is populated as two dictionaries (resource_attributes and attributes) with Boolean values.
See Choose Data Item Metadata for more information on selecting metadata.
Splunk TCP-specific metadata included:
- Host name - Edge Delta agent hostname
- Host IP - Edge Delta agent IP address
- Service name - Service identifier
- Source name - Connector instance name
- Source type - Splunk TCP connector type
Splunk metadata extracted from events:
- Splunk index - Target Splunk index name
- Splunk sourcetype - Data type classification
- Splunk source - Original source path or identifier
- Splunk host - Originating host of data
- Event timestamp - Original event timestamp
Metadata Level (Attributes)
Additional attribute-level metadata fields to include.
Default: ed.env.id
Rate Limit
The rate_limit parameter enables you to control data ingestion based on system resource usage. This advanced setting helps prevent source nodes from overwhelming the agent by automatically throttling or stopping data collection when CPU or memory thresholds are exceeded.
Use rate limiting to prevent runaway log collection from overwhelming the agent in high-volume sources, protect agent stability in resource-constrained environments with limited CPU/memory, automatically throttle during bursty traffic patterns, and ensure fair resource allocation across source nodes in multi-tenant deployments.
When rate limiting triggers, pull-based sources (File, S3, HTTP Pull) stop fetching new data, push-based sources (HTTP, TCP, UDP, OTLP) reject incoming data, and stream-based sources (Kafka, Pub/Sub) pause consumption. Rate limiting operates at the source node level, where each source with rate limiting enabled independently monitors and enforces its own thresholds.
Rate limiting vs backpressure: Rate limiting and backpressure are different mechanisms. Rate limiting controls data ingestion at the source based on CPU or memory thresholds. Backpressure controls data output at the destination when in-memory queues fill up. Backpressure logs such as
backpressure: dataCh at 92% capacitydo not appear when rate limiting triggers, and rate limiting logs do not appear during backpressure events.
Observability: When rate limiting is active in enforce mode, the agent does not produce INFO, WARN, or ERROR level logs. To confirm that rate limiting is triggering, check the source node’s Bytes I/O metrics in the Edge Delta app for gaps or drops that coincide with expected throttling periods.
Configuration Steps:
- Click Add New in the Rate Limit section
- Click Add New for Evaluation Policy
- Select Policy Type:
- CPU Usage: Monitors CPU consumption and rate limits when usage exceeds defined thresholds. Use for CPU-intensive sources like file parsing or complex transformations.
- Memory Usage: Monitors memory consumption and rate limits when usage exceeds defined thresholds. Use for memory-intensive sources like large message buffers or caching.
- AND (composite): Combines multiple sub-policies with AND logic. All sub-policies must be true simultaneously to trigger rate limiting. Use when you want conservative rate limiting (both CPU and memory must be high).
- OR (composite): Combines multiple sub-policies with OR logic. Any sub-policy can trigger rate limiting. Use when you want aggressive rate limiting (either CPU or memory being high triggers).
- Select Evaluation Mode. Choose how the policy behaves when thresholds are exceeded:
- Enforce (default): Actively applies rate limiting when thresholds are met. Pull-based sources (File, S3, HTTP Pull) stop fetching new data, push-based sources (HTTP, TCP, UDP, OTLP) reject incoming data, and stream-based sources (Kafka, Pub/Sub) pause consumption. Use in production to protect agent resources.
- Monitor: Logs when rate limiting would occur without actually limiting data flow. Use for testing thresholds before enforcing them in production.
- Passthrough: Disables rate limiting entirely while keeping the configuration in place. Use to temporarily disable rate limiting without removing configuration.
- Set Absolute Limits and Relative Limits (for CPU Usage and Memory Usage policies)
Note: If you specify both absolute and relative limits, the system evaluates both conditions and rate limiting triggers when either condition is met (OR logic). For example, if you set absolute limit to
1.0CPU cores and relative limit to50%, rate limiting triggers when the source uses either 1 full core OR 50% of available CPU, whichever happens first.
For CPU Absolute Limits: Enter value in full core units:
0.1= one-tenth of a CPU core0.5= half a CPU core1.0= one full CPU core2.0= two full CPU cores
For CPU Relative Limits: Enter percentage of total available CPU (0-100):
50= 50% of available CPU75= 75% of available CPU85= 85% of available CPU
For Memory Absolute Limits: Enter value in bytes
104857600= 100Mi (100 × 1024 × 1024)536870912= 512Mi (512 × 1024 × 1024)1073741824= 1Gi (1 × 1024 × 1024 × 1024)
For Memory Relative Limits: Enter percentage of total available memory (0-100)
60= 60% of available memory75= 75% of available memory80= 80% of available memory
- Set Refresh Interval (for CPU Usage and Memory Usage policies). Specify how frequently the system checks resource usage:
- Recommended Values:
10sto30sfor most use cases5sto10sfor high-volume sources requiring quick response1mor higher for stable, low-volume sources
The system fetches current CPU/memory usage at the specified refresh interval and uses that value for evaluation until the next refresh. Shorter intervals provide more responsive rate limiting but incur slightly higher overhead, while longer intervals are more efficient but slower to react to sudden resource spikes.
The GUI generates YAML as follows:
# Simple CPU-based rate limiting
nodes:
  - name: <node name>
    type: <node type>
    rate_limit:
      evaluation_policy:
        policy_type: cpu_usage
        evaluation_mode: enforce
        absolute_limit: 0.5  # Limit to half a CPU core
        refresh_interval: 10s
# Simple memory-based rate limiting
nodes:
  - name: <node name>
    type: <node type>
    rate_limit:
      evaluation_policy:
        policy_type: memory_usage
        evaluation_mode: enforce
        absolute_limit: 536870912  # 512Mi in bytes
        refresh_interval: 30s
Composite Policies (AND / OR)
When using AND or OR policy types, you define sub-policies instead of limits. Sub-policies must be siblings (at the same level)—do not nest sub-policies within other sub-policies. Each sub-policy is independently evaluated, and the parent policy’s evaluation mode applies to the composite result.
- AND Logic: All sub-policies must evaluate to true at the same time to trigger rate limiting. Use when you want conservative rate limiting (limit only when CPU AND memory are both high).
- OR Logic: Any sub-policy evaluating to true triggers rate limiting. Use when you want aggressive protection (limit when either CPU OR memory is high).
Configuration Steps:
- Select AND (composite) or OR (composite) as the Policy Type
- Choose the Evaluation Mode (typically Enforce)
- Click Add New under Sub-Policies to add the first condition
- Configure the first sub-policy by selecting policy type (CPU Usage or Memory Usage), selecting evaluation mode, setting absolute and/or relative limits, and setting refresh interval
- In the parent policy (not within the child), click Add New again to add a sibling sub-policy
- Configure additional sub-policies following the same pattern
The GUI generates YAML as follows:
# AND composite policy - both CPU AND memory must exceed limits
nodes:
  - name: <node name>
    type: <node type>
    rate_limit:
      evaluation_policy:
        policy_type: and
        evaluation_mode: enforce
        sub_policies:
          # First sub-policy (sibling)
          - policy_type: cpu_usage
            evaluation_mode: enforce
            absolute_limit: 0.75  # Limit to 75% of one core
            refresh_interval: 15s
          # Second sub-policy (sibling)
          - policy_type: memory_usage
            evaluation_mode: enforce
            absolute_limit: 1073741824  # 1Gi in bytes
            refresh_interval: 15s
# OR composite policy - either CPU OR memory can trigger
nodes:
  - name: <node name>
    type: <node type>
    rate_limit:
      evaluation_policy:
        policy_type: or
        evaluation_mode: enforce
        sub_policies:
          - policy_type: cpu_usage
            evaluation_mode: enforce
            relative_limit: 85  # 85% of available CPU
            refresh_interval: 20s
          - policy_type: memory_usage
            evaluation_mode: enforce
            relative_limit: 80  # 80% of available memory
            refresh_interval: 20s
# Monitor mode for testing thresholds
nodes:
  - name: <node name>
    type: <node type>
    rate_limit:
      evaluation_policy:
        policy_type: memory_usage
        evaluation_mode: monitor  # Only logs, doesn't limit
        relative_limit: 70  # Test at 70% before enforcing
        refresh_interval: 30s
How to Use the Splunk TCP Connector
The Splunk TCP connector integrates seamlessly with AI Team, enabling data ingestion from Splunk-instrumented infrastructure. AI teammates automatically leverage Splunk-forwarded data to analyze application logs, investigate security events, monitor infrastructure health, and track error patterns across Splunk indexes.
Use Case: Application Log Analysis
Analyze application logs from Splunk Universal Forwarders monitoring application servers. AI teammates identify error patterns, detect anomalies, and correlate issues across multiple servers without manually searching Splunk indexes. This is valuable for troubleshooting application failures, identifying recurring errors, and understanding application behavior.
Configuration:
- Listen:
0.0.0.0 - Port:
9997 - Read Timeout:
1m
Splunk forwarder (outputs.conf):
[tcpout]
defaultGroup = edgedelta

[tcpout:edgedelta]
server = edge-delta-host:9997
compressed = false
Use Case: Security Event Monitoring
Monitor security logs from Splunk Heavy Forwarders with TLS encryption. AI teammates analyze authentication failures, detect brute force attacks, and identify security anomalies across infrastructure. Using TLS ensures sensitive security data is encrypted during transmission.
Configuration:
- Listen:
0.0.0.0 - Port:
9997 - Read Timeout:
2m - TLS: Enabled
Splunk forwarder (outputs.conf):
[tcpout]
defaultGroup = edgedelta
forwardedindex.filter.disable = true

[tcpout:edgedelta]
server = edge-delta-host:9997
sendCookedData = true
sslCertPath = $SPLUNK_HOME/etc/auth/server.pem
sslVerifyServerCert = false
Use Case: Multi-Index Cross-Analysis
Analyze data across multiple Splunk indexes (main, security, application, metrics) for cross-index insights. AI teammates provide correlation analysis, track event volume by index, identify top hosts per index, and detect ingestion anomalies. This enables unified analysis across Splunk’s data silos.
Configuration:
- Listen:
0.0.0.0 - Port:
9997 - Read Timeout:
1m
Troubleshooting
Connection refused errors: Verify Edge Delta listening on port with netstat -tuln | grep 9997. Test connectivity from forwarder with telnet edge-delta-host 9997. Check firewall rules allow TCP traffic on configured port. Review Splunk forwarder logs at $SPLUNK_HOME/var/log/splunk/splunkd.log for connection errors.
Forwarder connects but no data appears: Verify outputs.conf correctly points to Edge Delta host and port in [tcpout:edgedelta] section. Check Splunk forwarder running with $SPLUNK_HOME/bin/splunk status. Verify forwarder queue status with splunk list forward-server. Check Edge Delta agent running and healthy.
TLS handshake failures: Verify TLS enabled on both Splunk forwarder (outputs.conf with SSL settings) and Edge Delta connector. Check certificate and private key valid and matching. Ensure forwarder trusts Edge Delta certificate. Review sslVerifyServerCert setting in forwarder config. Check SSL errors in both forwarder and Edge Delta logs.
Missing Splunk metadata fields: Verify metadata level configuration includes Splunk index, sourcetype, source, and host extraction. Check Splunk forwarder sending properly formatted events. Review event structure in Edge Delta pipeline logs. Some Splunk field extractions happen at indexer level and won’t occur when forwarding to Edge Delta.
Excessive connection churn: Check forwarder reconnection loops in Splunk logs. Verify read timeout not too short for event rate. Monitor forwarder queue status for event buildup. Review Edge Delta resource usage (CPU, memory, file descriptors). Consider increasing timeout or load balancing across multiple Edge Delta agents.
Slow throughput or delayed events: Check network bandwidth between forwarders and Edge Delta. Review forwarder queue configuration in outputs.conf (maxQueueSize, compression). Enable compression in forwarder to reduce bandwidth. Monitor CPU and memory on both forwarders and Edge Delta agents. Deploy multiple Edge Delta agents with load balancing for high volumes.
Configuration changes not applied: Remember connector config in Edge Delta controls where agents listen, but Splunk forwarders must be explicitly reconfigured. After changing connector, update outputs.conf on each forwarder and restart Splunk service. Verify new config active with splunk list forward-server. Update firewall rules for new ports or TLS settings.
Next Steps
- Learn about Splunk TCP source configuration for advanced pipeline integration
- Learn about Splunk HEC connector for HTTP-based Splunk data ingestion
- Learn about Edge Delta MCP connector for querying Splunk data
- Learn about creating custom teammates that can use Splunk data
For additional help, visit AI Team Support.