Syslog Server Setup Guide | Receive RFC 3164 & RFC 5424 Logs
Configure a centralized Syslog server to collect logs from network devices, firewalls, and applications. Supports TCP/UDP, TLS encryption, and automatic parsing of RFC 3164/5424 formats.
10 minute read
Overview
The Syslog connector receives log messages from network devices, servers, applications, and infrastructure components using the industry-standard Syslog protocol. Syslog is the ubiquitous protocol for transmitting log messages across IP networks, supporting both RFC 3164 (BSD Syslog) and RFC 5424 (Structured Syslog) formats. Content streams into Edge Delta Pipelines for analysis by AI teammates through the Edge Delta MCP connector.
The connector supports TCP and UDP transports, TLS encryption for secure transmission, RFC 6587 framing for reliable TCP delivery, and automatic parsing of facility, severity, timestamps, and structured data. Edge Delta acts as a centralized Syslog server, extracting metadata including source IP, facility/severity levels, hostnames, and structured data elements.
When you add this streaming connector, it appears as a Syslog source in your selected pipeline. AI teammates access this data by querying the Edge Delta backend with the Edge Delta MCP connector.
For comprehensive Syslog configuration details, protocol specifications, and advanced features, see the Syslog Source documentation.
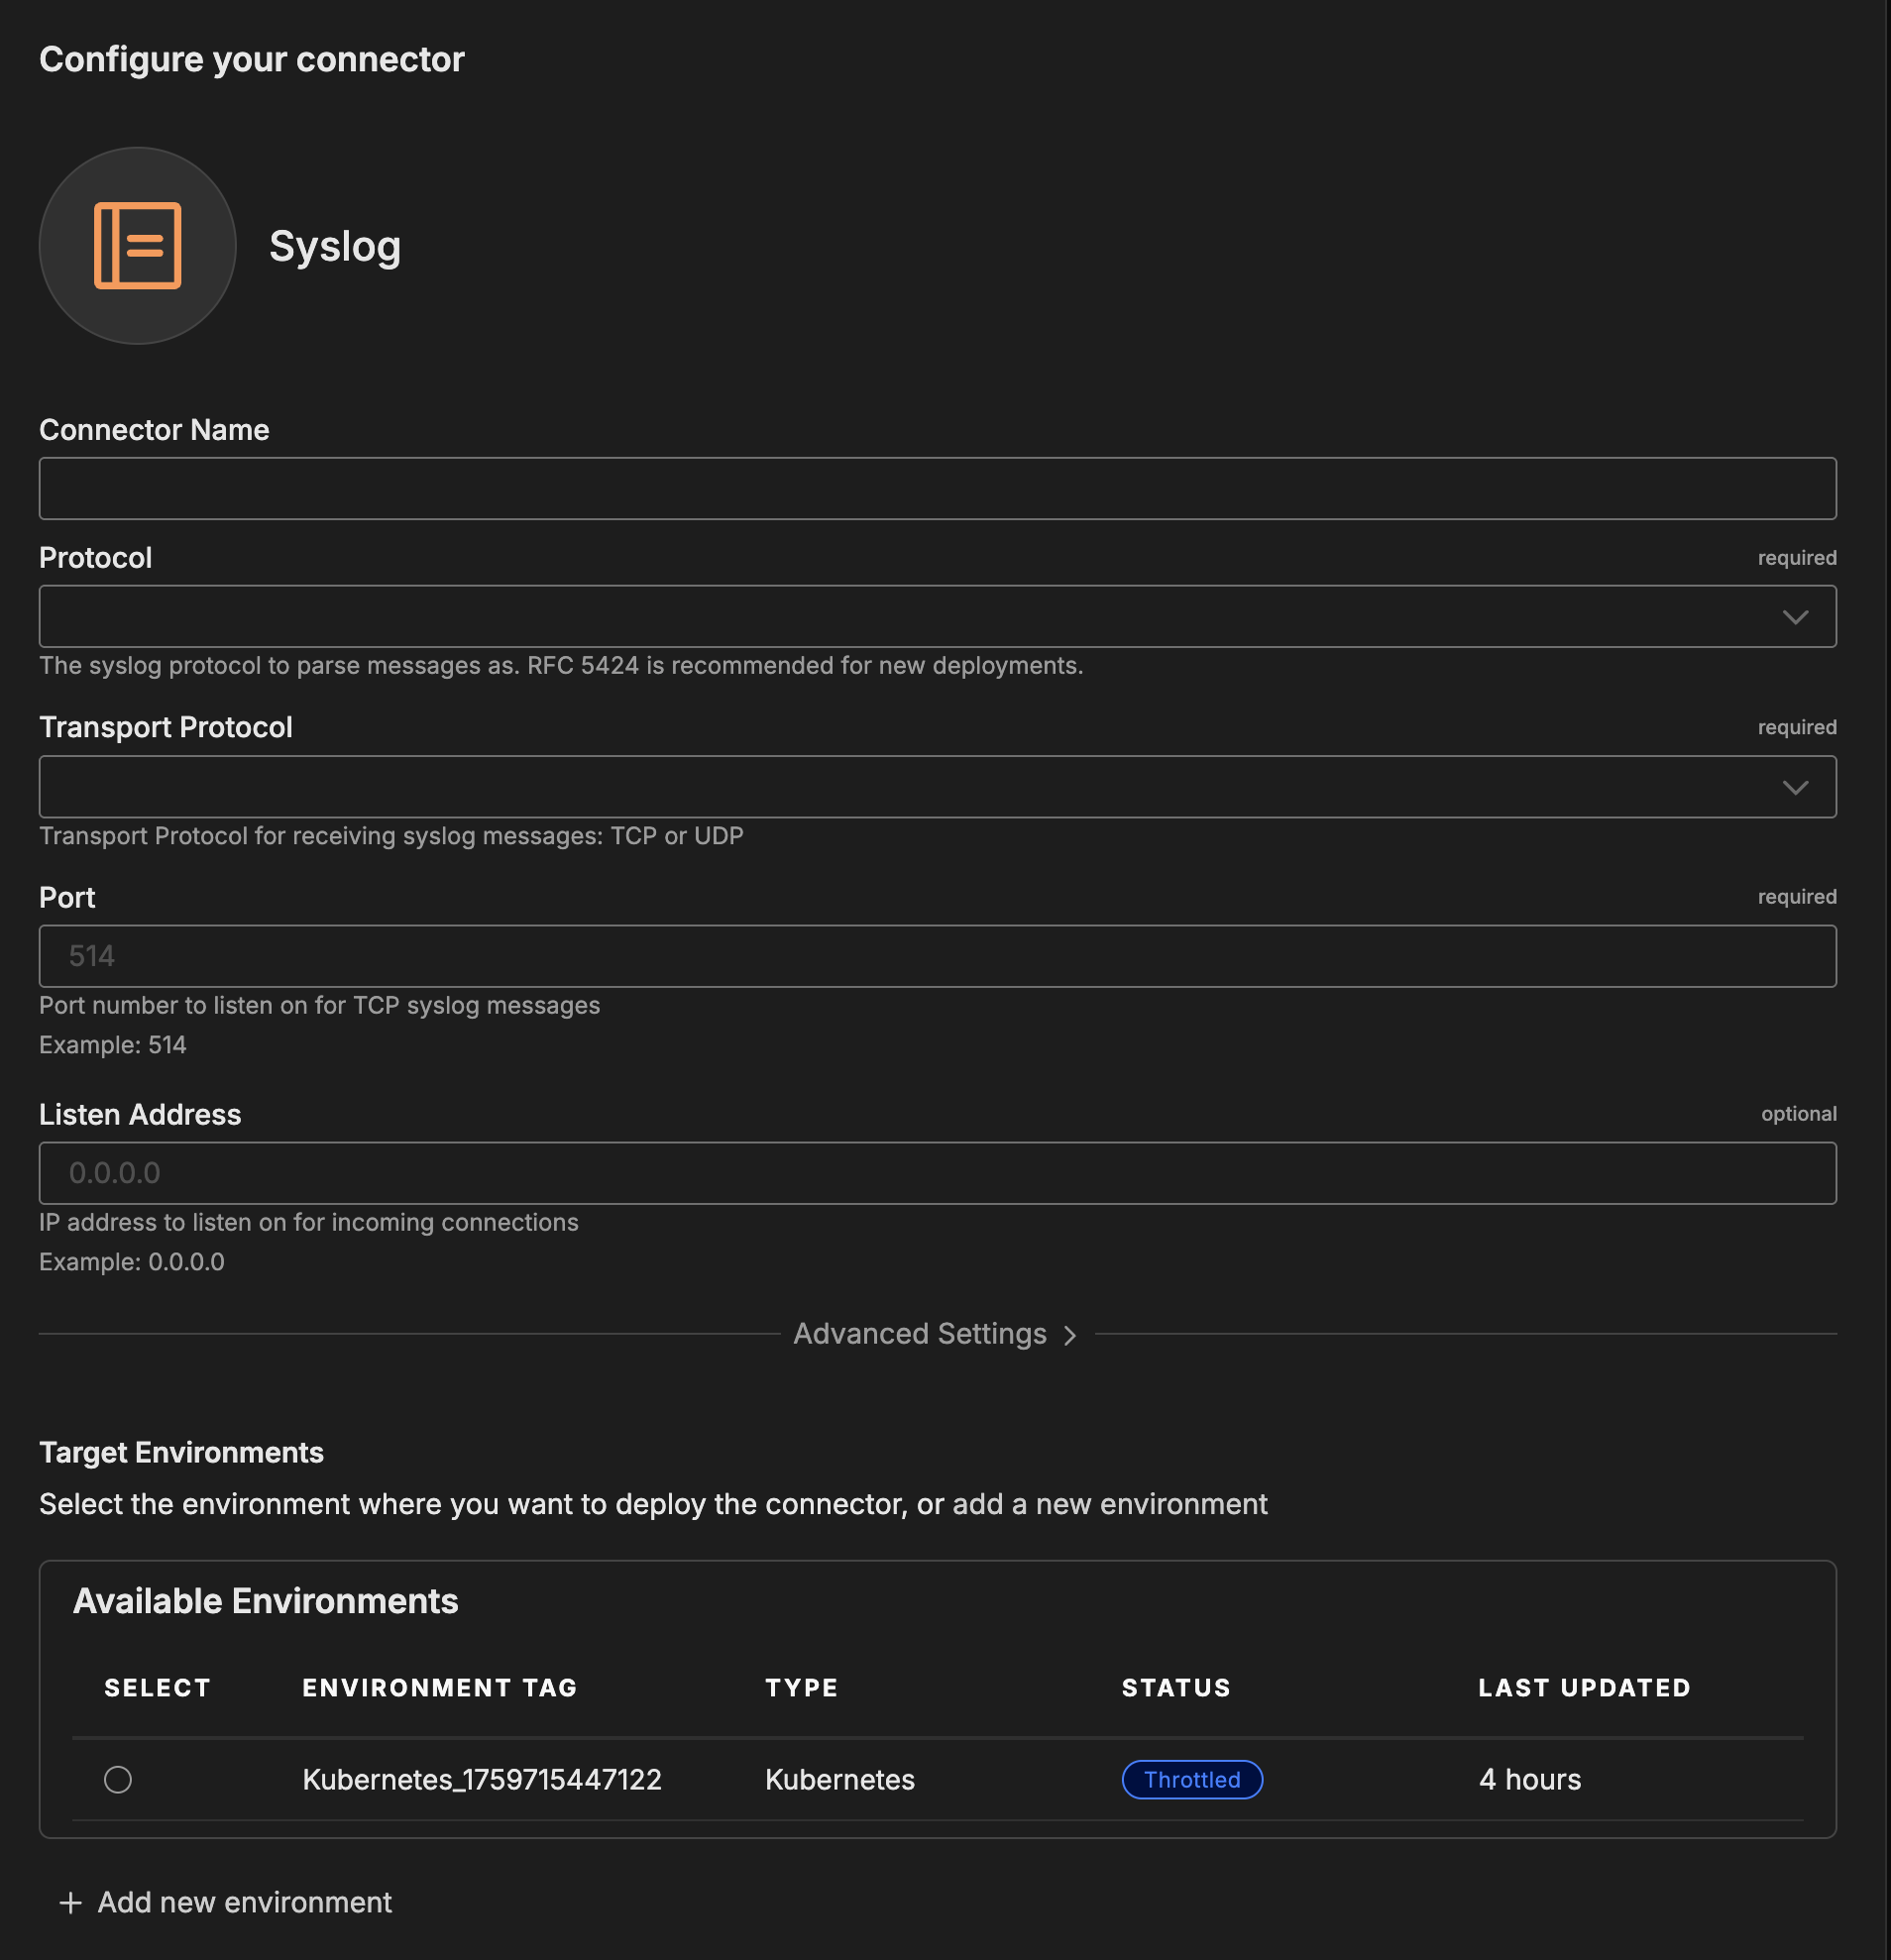
Add the Syslog Connector
To add the Syslog connector, you configure Edge Delta to listen for incoming Syslog messages on a specified port and protocol.
Prerequisites
Before configuring the connector, ensure you have:
- Edge Delta agent with network access to receive inbound connections
- Firewall rules allowing inbound Syslog traffic on chosen port (514, 1514, or 6514)
- Source devices (network equipment, servers, applications) ready to forward Syslog
- For ports below 1024, root/admin privileges (or use ports 1024+)
Configuration Steps
- Navigate to AI Team > Connectors in the Edge Delta application
- Find the Syslog connector in Streaming Connectors
- Click the connector card
- Select Protocol (RFC 3164 or RFC 5424)
- Select Transport Protocol (TCP or UDP)
- Configure Port (514 standard, 1514 non-privileged, 6514 TLS)
- Configure Listen Address (default
0.0.0.0) - Optionally configure Advanced Settings for TLS, multiline, encoding
- Select a target environment
- Click Save
The connector deploys and begins listening for Syslog messages.
Configuration Options
Connector Name
Name to identify this Syslog connector instance.
Protocol
Syslog protocol format for parsing messages.
Values:
RFC 3164- Traditional BSD Syslog (legacy devices, maximum compatibility)RFC 5424- Structured Syslog (modern devices, enhanced metadata, structured data)
Default: RFC 5424
When to Use:
- RFC 5424: Recommended for new deployments, modern appliances, devices supporting structured data
- RFC 3164: Legacy devices, maximum compatibility, older network equipment
Transport Protocol
Transport protocol for receiving Syslog messages.
Values:
TCP- Reliable, connection-oriented delivery with guaranteed orderingUDP- Connectionless, low-latency delivery without guarantees
Default: TCP
When to Use:
- TCP: Production environments, critical logs, security events, financial transactions
- UDP: High-volume scenarios, acceptable message loss, reduced overhead
Port
Port number to listen on for Syslog messages.
Format: Integer between 1 and 65535
Default: 514
Examples:
514- Standard Syslog port (requires root/admin privileges)1514- Common non-privileged alternative6514- Standard TLS-encrypted Syslog port
Note: Ports below 1024 require elevated privileges on Linux/Unix systems
Listen Address
IP address to listen on for incoming connections.
Format: IPv4 address
Default: 0.0.0.0 (all interfaces)
Examples:
0.0.0.0- Listen on all network interfaces192.168.1.100- Listen only on specific interface10.0.0.50- Bind to particular IP address
Advanced Settings
Timezone Location
Geographic location (timezone) for timestamp parsing. Used with RFC 3164 only (RFC 5424 uses ISO 8601 with explicit timezone).
Format: IANA timezone identifier
Default: UTC
Examples:
UTC- Coordinated Universal TimeAmerica/New_York- Eastern Time (US)Europe/London- British TimeAsia/Tokyo- Japan Standard Time
When to Use: RFC 3164 messages without timezone information need explicit timezone for correct timestamp parsing
Max Log Size
Maximum size of a single log entry to prevent excessive memory usage.
Format: Size with unit (KiB, MiB, GiB)
Default: 1MiB
Examples:
512KiB- For typical log messages1MiB- Standard default5MiB- For logs with large stack traces or JSON payloads
When to Use: Increase for logs containing large stack traces, verbose JSON, or base64-encoded data
Add Network Attributes
Add network-related attributes according to OpenTelemetry semantic conventions (net.* attributes).
Includes:
net.peer.ip- Source IP addressnet.peer.port- Source portnet.host.ip- Destination IPnet.host.port- Destination port
When to Use: Enable for network security analysis, IP-based filtering, or troubleshooting connection issues
Encoding
Character encoding of incoming messages.
Values: utf-8, utf-16, ascii, iso-8859-1, windows-1252
Default: utf-8
When to Use: Change for devices using non-UTF-8 encoding (legacy systems, specific regional devices)
Preserve Leading Whitespaces
Whether to preserve leading whitespace characters in log messages.
Default: false (trim leading whitespace)
When to Use: Enable when whitespace is semantically meaningful (formatted output, column alignment)
Preserve Trailing Whitespaces
Whether to preserve trailing whitespace characters in log messages.
Default: false (trim trailing whitespace)
When to Use: Enable when whitespace is semantically meaningful (rarely needed)
TLS Configuration
TLS configuration for secure TCP connections. Only supported for TCP transport.
Fields:
- Certificate File: Path to TLS certificate file for secure connections
- Private Key File: Path to TLS private key file
- CA Certificate File: Path to CA certificate to verify client certificates
- Client CA File: Path to CA for client certificate verification (enables mutual TLS)
When to Use: Enable for sensitive logs (security events, PII, credentials), transmission over untrusted networks, compliance requirements (HIPAA, PCI-DSS, GDPR)
Port Recommendation: Use port 6514 for TLS-encrypted Syslog (standard)
Multiline Configuration
Configuration for handling multiline log entries (stack traces, multi-line events).
When to Use: Enable when devices send logs spanning multiple lines (Java stack traces, multi-line application logs)
Details: See Syslog Source multiline configuration for line continuation patterns
Async Configuration
Configure concurrent processing of UDP messages.
Fields:
- Readers: Number of concurrent goroutines reading from UDP port
- Processors: Number of concurrent goroutines processing log messages
- Max Queue Length: Maximum number of messages waiting for processing
When to Use: UDP transport only. Increase for high-volume UDP Syslog to improve throughput
Default: 1 reader, 1 processor
Enable Octet Counting
Enable RFC 6587 Octet Counting framing for TCP with RFC 5424.
Format: Message prefixed with byte length (e.g., 143 <34>1 2025-10-06...)
When to Use: Required for FortiGate firewalls in “reliable” mode, enterprise devices using octet counting
Note: Incompatible with allow_skip_pri_header. Only TCP + RFC 5424.
Details: See RFC 6587 Framing Support for complete configuration
Max Octets
Maximum octets for messages using RFC 6587 Octet Counting. Only applies when enable_octet_counting is true.
Format: Integer
Default: 8192
When to Use: Increase for devices sending large Syslog messages with octet counting
Allow Skip PRI Header
Allow parsing records without PRI header (priority field).
Note: Requires enable_octet_counting to be false. Incompatible with octet counting.
When to Use: Some non-standard Syslog implementations omit PRI header
Non-Transparent Framing Trailer
Framing trailer for RFC 6587 Non-Transparent-Framing. Only TCP + RFC 5424.
Values: LF (newline), NUL (null byte)
Default: LF
When to Use: Alternative to octet counting for message framing
Details: See RFC 6587 Framing Support for complete configuration
Metadata Level (Resource Attributes)
This option is used to define which detected resources and attributes to add to each data item as it is ingested by Edge Delta. You can select:
- Required Only: This option includes the minimum required resources and attributes for Edge Delta to operate.
- Default: This option includes the required resources and attributes plus those selected by Edge Delta
- High: This option includes the required resources and attributes along with a larger selection of common optional fields.
- Custom: With this option selected, you can choose which attributes and resources to include. The required fields are selected by default and can’t be unchecked.
Based on your selection in the GUI, the source_metadata YAML is populated as two dictionaries (resource_attributes and attributes) with Boolean values.
See Choose Data Item Metadata for more information on selecting metadata.
Syslog-specific metadata included:
- Host name - Edge Delta agent hostname
- Host IP - Edge Delta agent IP address
- Service name - Service identifier
- Source name - Connector instance name
- Source type - Syslog connector type
Syslog metadata extracted from messages:
- Priority - Numeric priority value (facility * 8 + severity)
- Facility - Facility code (0-23) indicating source type
- Severity - Severity level mapped from priority
- Hostname - Source system hostname
- App name - Application or process name
- Process ID - Process identifier
- Message ID - Message identifier (RFC 5424 only)
- Structured data - Key-value pairs (RFC 5424 only)
- Timestamp - Parsed timestamp from Syslog message
Severity Mapping:
| Priority | Severity | Description |
|---|---|---|
| 0 | emergency | System unusable |
| 1 | alert | Action required immediately |
| 2 | critical | Critical conditions |
| 3 | error | Error conditions |
| 4 | warning | Warning conditions |
| 5 | notice | Normal but significant |
| 6 | info | Informational |
| 7 | debug | Debug-level |
Metadata Level (Attributes)
Additional attribute-level metadata fields to include.
Default: ed.env.id
How to Use the Syslog Connector
The Syslog connector integrates seamlessly with AI Team, enabling data ingestion from Syslog-enabled infrastructure. AI teammates automatically leverage Syslog data to monitor network device health, investigate security events, analyze firewall logs, track authentication failures, and detect infrastructure anomalies.
Use Case: Network Device Monitoring
Monitor routers, switches, and load balancers via Syslog for interface failures, configuration changes, and performance issues. AI teammates analyze device logs to identify network problems, detect unusual traffic patterns, and track configuration changes. This is valuable for network operations teams troubleshooting connectivity issues and ensuring network stability.
Configuration:
- Protocol:
RFC 3164 - Transport Protocol:
UDP - Port:
514 - Listen Address:
0.0.0.0
Device Configuration (Cisco):
logging host 10.0.0.100
logging trap informational
logging facility local7
For detailed device configuration examples, see Network Device Configuration in the Syslog Source documentation.
Use Case: Firewall Security Analysis
Analyze firewall logs from FortiGate, Palo Alto, or Cisco ASA for security threats and policy violations. AI teammates detect blocked attacks, identify suspicious connection patterns, and track security rule hits. Using RFC 5424 with structured data provides rich metadata for detailed security analysis.
Configuration:
- Protocol:
RFC 5424 - Transport Protocol:
TCP - Port:
6514 - Listen Address:
0.0.0.0 - TLS Configuration: Enabled
- Enable Octet Counting: true (FortiGate reliable mode)
Device Configuration (FortiGate):
config log syslogd setting
    set status enable
    set server "10.0.0.100"
    set port 6514
    set mode reliable
    set facility local7
    set format rfc5424
end
For detailed firewall configuration examples including FortiGate, Palo Alto Networks, and Cisco ASA, see the Syslog Source documentation.
Use Case: Linux Server Log Aggregation
Centralize system logs from Linux servers for security monitoring and troubleshooting. AI teammates analyze authentication events, detect failed login attempts, monitor service failures, and track system errors across infrastructure. This enables unified visibility across distributed server environments.
Configuration:
- Protocol:
RFC 5424 - Transport Protocol:
TCP - Port:
1514 - Listen Address:
0.0.0.0 - Timezone Location:
UTC
Server Configuration (rsyslog):
*.* @@10.0.0.100:1514
Troubleshooting
Messages not received: Verify Edge Delta listening on port with netstat -uln | grep 514 (UDP) or netstat -tln | grep 514 (TCP). Test connectivity from source device with logger -n edge-delta-host -P 514 "test message". Check firewall rules allow inbound traffic on configured port. Verify source device Syslog configuration points to correct Edge Delta IP and port.
Timestamp parsing errors: For RFC 3164, verify timezone location matches source device timezone. RFC 3164 doesn’t include timezone in messages, requiring explicit configuration. For RFC 5424, timestamps include ISO 8601 timezone and parse automatically. Check device sends timestamps in expected format.
TCP connection failures with octet counting: Verify both protocol: RFC 5424 and transport: TCP configured. Octet counting only works with RFC 5424 over TCP. Check device configured for octet counting framing (FortiGate “reliable” mode). Ensure allow_skip_pri_header is false (incompatible with octet counting).
TLS handshake failures: Verify TLS only configured with TCP transport (not UDP). Check certificate and private key files exist and readable. Ensure certificate CN/SAN matches hostname devices connect to. Verify device configured for TLS Syslog (typically port 6514). Check client CA configured if using mutual TLS.
Messages truncated: Increase max_log_size for logs with large stack traces or JSON. Default 1MiB may be insufficient for verbose application logs. Monitor for truncation warnings in Edge Delta logs. Adjust device verbosity if messages consistently exceed limits.
High UDP packet loss: UDP doesn’t guarantee delivery. Enable async configuration to increase concurrent UDP processing (increase readers and processors). Consider switching to TCP for reliable delivery. Monitor Edge Delta resource usage (CPU, memory) as bottleneck indicator. Deploy multiple Edge Delta agents with load balancing.
Encoding issues with special characters: Verify encoding matches device character set. Default utf-8 works for most modern devices. Legacy devices may use iso-8859-1 or windows-1252. Check for mojibake (garbled characters) indicating encoding mismatch.
Multiline messages split incorrectly: Configure multiline settings to recognize line continuation patterns. See Syslog Source multiline configuration for pattern examples. Java stack traces and multi-line application logs require multiline support.
Next Steps
- Learn about Syslog source configuration for comprehensive protocol details, RFC 6587 framing, field mapping, and advanced features
- Learn about Edge Delta MCP connector for querying Syslog data
- Learn about creating custom teammates that can use Syslog data
For additional help, visit AI Team Support.