Edge Delta Syslog Source

The Syslog source node enables Edge Delta to receive and process syslog messages from various sources using RFC 3164 and RFC 5424 formats over UDP or TCP.

Overview

flowchart LR classDef icon-source fill:#E3F8EE,stroke:#1B7F5E,color:#0F3B2E; classDef icon-router fill:#E9F5F4,stroke:#0F766E,color:#0F3B2E; classDef icon-process fill:#E7F0FB,stroke:#2563EB,color:#1E3A8A; classDef icon-logs fill:#EFE7FC,stroke:#7C3AED,color:#321059; classDef icon-destination fill:#FCEADB,stroke:#EA580C,color:#7C2D12; Sources["<span class='ph ph-broadcast'></span> Syslog Sources<br/><small>Network Devices<br/>Servers · Applications</small>"] Transport{"<span class='ph ph-plug'></span> Transport<br/><small>UDP / TCP</small>"} Input["<span class='ph ph-cloud-arrow-down'></span> Syslog Input Node<br/><small>Port 514 / 5514 / 6514</small>"] Parse["<span class='ph ph-file-text'></span> Protocol Parser<br/><small>RFC 3164 / RFC 5424</small>"] Extract["<span class='ph ph-rows'></span> Field Extraction<br/><small>Priority · Facility · Severity<br/>Hostname · Message · Structured Data</small>"] Pipeline["<span class='ph ph-paper-plane-tilt'></span> Edge Delta Pipeline<br/><small>Processors · Outputs</small>"] Sources --> Transport Transport -->|UDP :514| Input Transport -->|TCP :514| Input Input --> Parse Parse --> Extract Extract --> Pipeline class Sources icon-source; class Transport icon-router; class Input icon-process; class Parse icon-logs; class Extract icon-process; class Pipeline icon-destination; linkStyle default stroke:#5EEAD4,stroke-width:2px
Syslog Input Flow

The Syslog source node enables Edge Delta to receive and process syslog messages sent from various sources including network devices, servers, applications, and security appliances. It supports both RFC 3164 (traditional BSD syslog format) and RFC 5424 (structured syslog format with enhanced metadata) over UDP or TCP transport protocols, allowing you to centralize log collection from your entire infrastructure.

AI Team: Configure this source using the Syslog connector for streamlined setup in AI Team.

  • outgoing_data_types: log

The Syslog source node is ideal for:

  • Network Device Monitoring: Collect logs from routers, switches, firewalls, and load balancers
  • Application Logging: Receive logs from applications configured to send syslog
  • Security Event Collection: Gather security events from IDS/IPS systems and firewalls
  • System Log Aggregation: Centralize Linux/Unix system logs
  • Legacy System Integration: Collect logs from older systems that only support syslog

Field Mapping

The Syslog source node extracts and maps the following fields from incoming messages:

Syslog FieldAttribute NameDescription
PrioritypriorityNumeric priority value (facility * 8 + severity)
FacilityfacilityFacility code (0-23) indicating message source type
Severityseverity_textSeverity level mapped from priority
HostnamehostnameSource system hostname
App NameappnameApplication or process name
Process IDproc_idProcess identifier from the source application
Message IDmsg_idMessage identifier (RFC 5424 only)
Structured Datastructured_dataKey-value pairs in structured format (RFC 5424 only)
MessagemessageActual log message content
VersionversionSyslog protocol version (RFC 5424 only)
TimestamptimestampParsed timestamp from syslog message

Severity Mapping

Syslog priorities are automatically mapped to severity levels:

PrioritySeverity CodeSeverity TextDescription
0-80emergencySystem is unusable
9-161alertAction must be taken immediately
17-242criticalCritical conditions
25-323errorError conditions
33-404warningWarning conditions
41-485noticeNormal but significant
49-566infoInformational messages
57+7debugDebug-level messages

RFC 5424 Structured Data

When using RFC 5424 protocol, the Syslog source node automatically parses structured data elements into nested JSON objects. Structured data provides a standardized way to include key-value metadata within syslog messages, commonly used by enterprise devices like FortiGate firewalls, Cisco devices, and F5 BIG-IP appliances.

Example RFC 5424 Message with Structured Data:

<34>1 2025-10-06T12:00:00Z firewall01 fortios 5678 ID47 [fortigate@32473 vd="root" logid="0000000013" type="traffic" subtype="forward" level="notice"] Traffic allowed from 10.0.0.5 to 192.168.1.10

Extracted Structured Data:

{
  "structured_data": {
    "fortigate@32473": {
      "vd": "root",
      "logid": "0000000013",
      "type": "traffic",
      "subtype": "forward",
      "level": "notice"
    }
  }
}

This automatic parsing allows you to use these structured fields in downstream processors for filtering, routing, and enrichment without additional parsing configuration.

RFC 6587 Framing Support

For reliable TCP syslog transmission, Edge Delta supports RFC 6587 framing methods, which are required by enterprise devices like FortiGate firewalls operating in “reliable” mode. RFC 6587 provides two framing mechanisms to handle multi-line messages and prevent message boundary ambiguity in TCP streams.

Octet Counting

Octet Counting prefixes each message with its byte length, providing reliable message framing even when messages contain embedded newlines or span multiple lines. This is the most robust framing method for TCP syslog.

Configuration:

nodes:
  - name: fortigate_syslog
    type: syslog_input
    protocol: rfc5424
    transport_protocol: tcp
    port: 514
    enable_octet_counting: true
    max_octets: 8192

Message Format:

123 <34>1 2025-10-06T12:00:00Z host app - - - Message content here

The number 123 indicates the message is 123 bytes long, allowing the parser to read exactly that many bytes regardless of content.

Non-Transparent Framing

Non-Transparent Framing uses a delimiter (typically LF newline or NUL character) to mark message boundaries. This method is simpler but less robust than octet counting for messages containing the delimiter character.

Configuration:

nodes:
  - name: legacy_syslog
    type: syslog_input
    protocol: rfc5424
    transport_protocol: tcp
    port: 514
    non_transparent_framing_trailer: LF

When to Use RFC 6587:

  • FortiGate firewalls configured with mode reliable
  • Any TCP syslog source requiring guaranteed message boundaries
  • Logs containing multi-line content (stack traces, formatted output)
  • High-reliability environments where message integrity is critical

Example Configurations

Basic RFC 5424 UDP Configuration

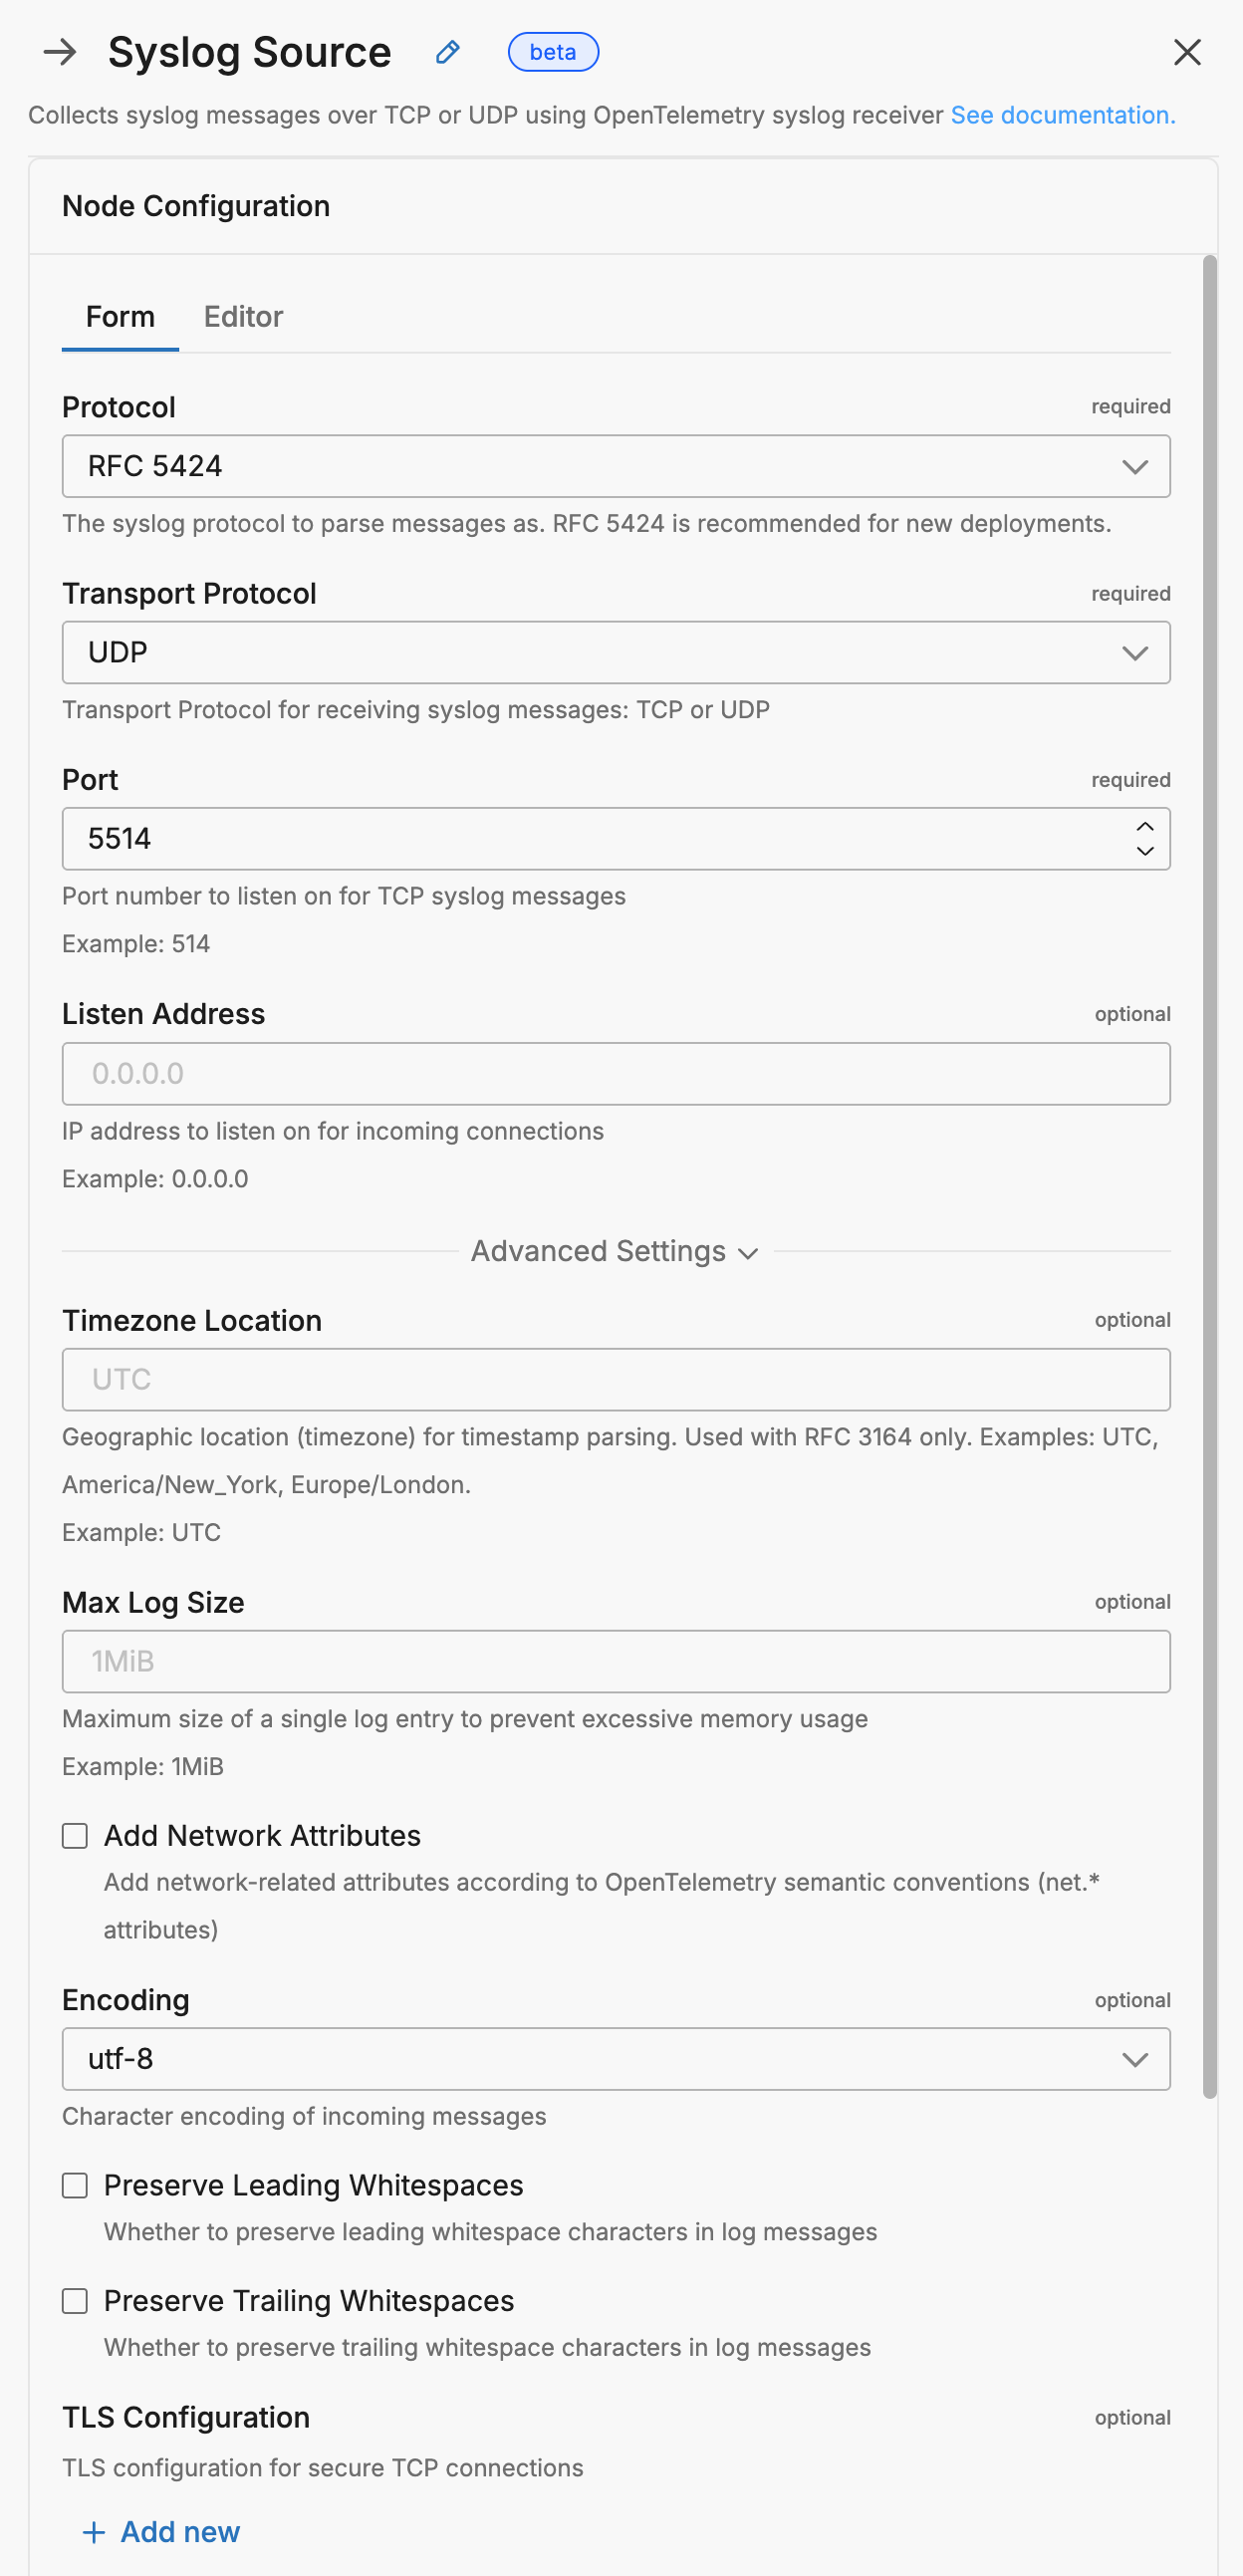
This configuration receives RFC 5424 formatted syslog messages over UDP on port 5514. Using a non-standard port helps avoid permission requirements for privileged ports below 1024.

nodes:
- name: syslog_rfc5424
  type: syslog_input
  port: 5514
  protocol: rfc5424
  transport_protocol: udp

RFC 3164 TCP Configuration

This configuration receives traditional RFC 3164 syslog messages over TCP for reliable delivery. TCP ensures messages are not lost during transmission.

nodes:
- name: syslog_traditional
  type: syslog_input
  port: 6514
  protocol: rfc3164
  transport_protocol: tcp
  listen: "0.0.0.0"

Advanced Configuration with Encoding

This configuration demonstrates advanced options including custom encoding and listening address specification for multi-homed systems.

nodes:
- name: syslog_advanced
  type: syslog_input
  port: 514
  protocol: rfc5424
  transport_protocol: udp
  listen: "0.0.0.0"
  encoding: utf-8
  location: America/New_York

High-Performance Async UDP Processing

Edge Delta provides async UDP processing capabilities that significantly outperform traditional synchronous syslog implementations. This feature enables concurrent message reading and processing, providing substantial throughput improvements for high-volume environments.

Async UDP Configuration

Enable async processing with multiple concurrent readers and processors:

nodes:
  - name: high_volume_syslog
    type: syslog_input
    protocol: rfc3164
    transport_protocol: udp
    port: 514
    udp:
      async:
        readers: 4
        processors_count:4
        max_queue_length: 1000

Performance Characteristics

Async processing improves throughput for high-volume syslog environments. Performance scales with the number of readers and processors configured:

  • Synchronous (default): Single-threaded processing, lower throughput but minimal resource usage
  • Async (2 readers, 2 processors): Moderate throughput improvement with 2-core utilization
  • Async (4 readers, 4 processors): Significant throughput improvement with 4-core utilization
  • Async (8+ readers, 8+ processors): Maximum throughput for high-volume scenarios with proportional CPU usage

Tuning Async Processing

Start Conservative: Begin with 2 readers and 2 processors, then scale up based on load:

udp:
  async:
    readers: 2
    processors_count:2
    max_queue_length: 500

Scale Based on CPU: Increase readers/processors if CPU utilization remains below 70% under load.

Monitor Queue Depth: If messages are being dropped, increase max_queue_length:

udp:
  async:
    readers: 4
    processors_count:4
    max_queue_length: 5000  # Increased for burst handling

Balance Memory vs Performance: Higher queue lengths consume more memory but handle traffic bursts better.

When to Use Async UDP

High-Volume Scenarios:

  • Data centers with hundreds of syslog sources
  • Network devices generating high message rates
  • Environments with multiple concurrent senders
  • Burst traffic patterns requiring buffering

Resource Availability:

  • Multi-core CPU with available capacity
  • Sufficient memory for queue buffering (typically 10-50 MB)
  • Network interface capable of high packet rates

Not Recommended:

  • Low-volume deployments
  • Single-core or resource-constrained environments
  • When CPU is already at high utilization

Enterprise Deployment Example

High-performance configuration for large-scale deployments:

nodes:
  - name: datacenter_syslog
    type: syslog_input
    protocol: rfc5424
    transport_protocol: udp
    port: 514
    udp:
      async:
        readers: 8
        processors_count:8
        max_queue_length: 5000
      add_attributes: true
    location: UTC

This configuration provides high throughput for enterprise deployments while adding OpenTelemetry semantic conventions for standardized downstream processing.

Example Output

When syslog messages are received, they are parsed and converted into structured log items. Below are examples showing the raw syslog message sent and the resulting processed data item.

Info Level Message

Raw syslog message sent:

<14>1 2025-09-04T15:00:00Z webserver nginx - - - User accessed /api/v1/status

Processed data item in pipeline:

{
  "_type": "log",
  "timestamp": 1756998000000,
  "body": "<14>1 2025-09-04T15:00:00Z webserver nginx - - - User accessed /api/v1/status",
  "resource": {
    "host.ip": "172.19.0.2",
    "host.name": "",
    "service.name": ""
  },
  "attributes": {
    "appname": "nginx",
    "facility": 1,
    "hostname": "webserver",
    "message": "User accessed /api/v1/status",
    "priority": 14,
    "version": 1
  },
  "observed_timestamp": 1756955155244,
  "severity_text": "info"
}

Critical Alert Message

Raw syslog message sent:

<10>1 2025-09-04T12:00:00Z database postgres - - - CRITICAL: Database connection lost

Processed data item in pipeline:

{
  "_type": "log",
  "timestamp": 1756955306000,
  "body": "<10>1 2025-09-04T12:00:00Z database postgres - - - CRITICAL: Database connection lost",
  "resource": {
    "host.ip": "172.19.0.2",
    "host.name": "",
    "service.name": ""
  },
  "attributes": {
    "appname": "postgres",
    "facility": 1,
    "hostname": "database",
    "message": "CRITICAL: Database connection lost",
    "priority": 10,
    "version": 1
  },
  "observed_timestamp": 1756955306171,
  "severity_text": "crit"
}

Complete Configuration Reference

This section provides a comprehensive reference of all configuration parameters for the Syslog source node, organized by category.

General Parameters

ParameterTypeDefaultRequiredDescription
namestring-YesUnique identifier for the syslog input node
typestring-YesMust be syslog_input
protocolstring-YesSyslog protocol: rfc3164 (RFC 3164) or rfc5424 (RFC 5424)
transport_protocolstring-YesNetwork transport: udp or tcp
portinteger-YesPort number to listen on (e.g., 514, 5514, 6514)
listenstring0.0.0.0NoIP address to bind to. Use 0.0.0.0 for all interfaces
encodingstringutf-8NoCharacter encoding: utf-8, ascii, utf-16le, utf-16be, big5, latin-1
locationstringLocal TZNoIANA timezone for timestamp parsing (e.g., America/New_York)

RFC 6587 Framing Parameters

ParameterTypeDefaultRequiredDescription
enable_octet_countingbooleanfalseNoEnable RFC 6587 Octet Counting framing (TCP + RFC 5424 only)
max_octetsinteger8192NoMaximum message size in bytes for octet counting
non_transparent_framing_trailerstring-NoTrailer for RFC 6587 Non-Transparent-Framing: LF or NUL
allow_skip_pri_headerbooleanfalseNoAllow messages without priority header (non-standard syslog)

TCP Transport Parameters

Configure these parameters under the tcp: section when using transport_protocol: tcp:

ParameterTypeDefaultRequiredDescription
listen_addressstring-See noteAlternative to listen + port for TCP (e.g., 0.0.0.0:514)
max_log_sizestring1MiBNoMaximum size of a single log entry (e.g., 5MiB, 10MiB)
add_attributesbooleanfalseNoAdd OpenTelemetry net.* semantic convention attributes
preserve_leading_whitespacesbooleanfalseNoPreserve leading whitespace in log messages
preserve_trailing_whitespacesbooleanfalseNoPreserve trailing whitespace in log messages

UDP Transport Parameters

Configure these parameters under the udp: section when using transport_protocol: udp:

ParameterTypeDefaultRequiredDescription
listen_addressstring-See noteAlternative to listen + port for UDP (e.g., 0.0.0.0:514)
add_attributesbooleanfalseNoAdd OpenTelemetry net.* semantic convention attributes
preserve_leading_whitespacesbooleanfalseNoPreserve leading whitespace in log messages
preserve_trailing_whitespacesbooleanfalseNoPreserve trailing whitespace in log messages

Async UDP Processing Parameters

Configure these parameters under udp.async: when using transport_protocol: udp:

ParameterTypeDefaultRequiredDescription
readersinteger1NoNumber of concurrent UDP socket readers (for high-volume scenarios)
processors_countinteger1NoNumber of concurrent message processors
max_queue_lengthinteger100NoMaximum queue size between readers and processors

Multiline Log Parameters

Configure these parameters under tcp.multiline: or udp.multiline: depending on your transport protocol:

ParameterTypeDefaultRequiredDescription
line_start_patternstring-NoRegex pattern matching the start of a new log entry
line_end_patternstring-NoRegex pattern matching the end of a log entry
omit_patternbooleanfalseNoOmit the matching pattern from output

Note: UDP multiline support is limited by packet boundaries. TCP is recommended for reliable multiline log handling.

OpenTelemetry Attributes

When add_attributes is enabled, the following OpenTelemetry semantic convention attributes are automatically added:

AttributeDescription
net.peer.ipSource IP address of the syslog sender
net.peer.portSource port number
net.host.ipDestination (Edge Delta) IP address
net.host.portDestination port number

Required Parameters

name

A descriptive name for the node. This is the name that will appear in pipeline builder and you can reference this node in the YAML using the name. It must be unique across all nodes. It is a YAML list element so it begins with a - and a space followed by the string. It is a required parameter for all nodes.

nodes:
  - name: <node name>
    type: <node type>

type: syslog_input

The type parameter specifies the type of node being configured. It is specified as a string from a closed list of node types. It is a required parameter.

nodes:
  - name: <node name>
    type: <node type>

protocol

The protocol parameter specifies which syslog format standard to use for parsing incoming messages.

RFC 3164 (rfc3164) - Traditional BSD syslog:

  • Older format widely supported by legacy systems
  • Simple structure with limited metadata
  • Format: <priority>timestamp hostname tag: message
  • Best for compatibility with older devices and systems

RFC 5424 (rfc5424) - Structured syslog:

  • Modern format with enhanced structure
  • Supports structured data elements for key-value pairs
  • ISO 8601 timestamps with timezone support
  • Includes version, message ID, and structured data fields
  • Recommended for new deployments

It is specified as a string and is a required parameter.

nodes:
  - name: <node name>
    type: syslog_input
    protocol: rfc5424
    transport_protocol: <transport>
    port: <port>

transport_protocol

The transport_protocol parameter specifies the network protocol for receiving syslog messages.

UDP Transport (udp):

  • Connectionless, fire-and-forget protocol
  • Lower overhead and resource usage
  • No delivery confirmation
  • Common for traditional syslog implementations
  • Best for high-volume, non-critical logs

TCP Transport (tcp):

  • Connection-oriented with delivery acknowledgment
  • Reliable message delivery
  • Higher resource usage
  • Supports larger messages
  • Recommended for critical logs requiring guaranteed delivery

It is specified as a string and is a required parameter.

nodes:
  - name: <node name>
    type: syslog_input
    protocol: <protocol>
    transport_protocol: udp
    port: <port>

port

The port parameter specifies the network port to listen on for incoming syslog messages. Common ports include:

  • 514: Standard syslog port (requires elevated privileges)
  • 5514, 6514: Common alternative ports

It is specified as an integer and is a required parameter.

nodes:
  - name: <node name>
    type: syslog_input
    protocol: <protocol>
    transport_protocol: <transport>
    port: 5514

Optional Parameters

listen

The listen parameter specifies the IP address to bind to for listening. Use “0.0.0.0” to listen on all interfaces. Default is “0.0.0.0”.

It is specified as a string and is optional.

nodes:
  - name: <node name>
    type: syslog_input
    protocol: <protocol>
    transport_protocol: <transport>
    port: <port>
    listen: "0.0.0.0"

encoding

The encoding parameter specifies the character encoding for syslog messages. Default is “utf-8”.

Supports IANA character set encodings. Common values:

  • utf-8: Unicode (default)
  • ascii: ASCII encoding
  • utf-16le: UTF-16 Little Endian
  • utf-16be: UTF-16 Big Endian
  • latin-1: Latin-1/ISO-8859-1
  • big5: Traditional Chinese encoding

It is specified as a string and is optional.

nodes:
  - name: <node name>
    type: syslog_input
    protocol: <protocol>
    transport_protocol: <transport>
    port: <port>
    encoding: utf-8

location

The location parameter specifies the timezone location for parsing timestamps that don’t include timezone information. Uses IANA timezone names.

Examples: “America/New_York”, “Europe/London”, “Asia/Tokyo”

It is specified as a string and is optional.

nodes:
  - name: <node name>
    type: syslog_input
    protocol: <protocol>
    transport_protocol: <transport>
    port: <port>
    location: America/New_York

Advanced TCP/UDP Options

max_log_size

The max_log_size parameter sets the maximum allowed size for a single log entry to protect against memory exhaustion from malformed or malicious inputs. Messages exceeding this size are rejected.

It is specified as a string with units (e.g., 1MiB, 5MiB, 10MiB) and is optional. Default is 1MiB.

TCP Configuration:

nodes:
  - name: <node name>
    type: syslog_input
    protocol: <protocol>
    transport_protocol: tcp
    port: <port>
    tcp:
      max_log_size: 5MiB

UDP Configuration:

nodes:
  - name: <node name>
    type: syslog_input
    protocol: <protocol>
    transport_protocol: udp
    port: <port>
    udp:
      max_log_size: 16KiB

When to Increase:

  • Legitimate logs exceed default 1MiB limit
  • Application stack traces or debug logs are large
  • Compliance requires full message capture

Security Consideration: Set this as low as practical to prevent DoS attacks through oversized messages.

add_attributes

The add_attributes parameter enables automatic addition of OpenTelemetry semantic convention network attributes, providing standardized metadata about the connection.

It is specified as a boolean and is optional. Default is false.

TCP Configuration:

nodes:
  - name: <node name>
    type: syslog_input
    protocol: <protocol>
    transport_protocol: tcp
    port: <port>
    tcp:
      add_attributes: true

UDP Configuration:

nodes:
  - name: <node name>
    type: syslog_input
    protocol: <protocol>
    transport_protocol: udp
    port: <port>
    udp:
      add_attributes: true

Attributes Added:

  • net.peer.ip - Source IP address
  • net.peer.port - Source port
  • net.host.ip - Destination IP
  • net.host.port - Destination port

When to Enable:

  • OpenTelemetry-compatible downstream systems
  • Need to track source IP for security/audit
  • Building correlation across telemetry types

preserve_leading_whitespaces / preserve_trailing_whitespaces

These parameters control whether leading and trailing whitespace is preserved in log messages. By default, Edge Delta trims whitespace for cleaner processing.

Both are specified as booleans and are optional. Default is false.

TCP Configuration:

nodes:
  - name: <node name>
    type: syslog_input
    protocol: <protocol>
    transport_protocol: tcp
    port: <port>
    tcp:
      preserve_leading_whitespaces: true
      preserve_trailing_whitespaces: true

When to Enable:

  • Whitespace is semantically significant in your logs
  • Compliance requires exact message preservation
  • Forensic analysis needs character-perfect logs
  • Downstream systems depend on original formatting

Multiline Log Support

Multiline support allows the syslog input to handle log messages that span multiple lines, such as stack traces, formatted output, or multi-line error messages.

multiline.line_start_pattern

The line_start_pattern parameter defines a regular expression that matches the beginning of a new log entry. Lines not matching this pattern are appended to the previous log.

It is specified as a string (regex) and is optional.

TCP Configuration for Java Stack Traces:

nodes:
  - name: <node name>
    type: syslog_input
    protocol: rfc5424
    transport_protocol: tcp
    port: <port>
    tcp:
      multiline:
        line_start_pattern: '^<\d+>1 \d{4}-\d{2}-\d{2}|^\s+at '

Common Patterns:

Java Stack Traces:

multiline:
  line_start_pattern: '^\d{4}-\d{2}-\d{2}|^\s+at |^Caused by:'

Python Tracebacks:

multiline:
  line_start_pattern: '^Traceback|^\s+File |^\w+Error:|^\w+Exception:'

Generic Timestamp-Based:

multiline:
  line_start_pattern: '^\[\d{4}-\d{2}-\d{2}|^\d{4}-\d{2}-\d{2}|^<\d+>'

Application Logs with Timestamps:

multiline:
  line_start_pattern: '^\d{4}-\d{2}-\d{2}\s\d{2}:\d{2}:\d{2}'

multiline.line_end_pattern

Alternative to line_start_pattern, the line_end_pattern defines a regex matching the end of a log entry.

tcp:
  multiline:
    line_end_pattern: '\n$'

multiline.omit_pattern

The omit_pattern parameter controls whether the matching pattern is included in the output.

It is specified as a boolean and is optional. Default is false.

tcp:
  multiline:
    line_start_pattern: '^\[TIMESTAMP\]'
    omit_pattern: true  # Remove the [TIMESTAMP] marker

Complete Multiline Example:

nodes:
  - name: app_logs_multiline
    type: syslog_input
    protocol: rfc5424
    transport_protocol: tcp
    port: 6514
    tcp:
      multiline:
        line_start_pattern: '^<\d+>1 \d{4}-\d{2}-\d{2}T\d{2}:\d{2}:\d{2}'
        omit_pattern: false
      max_log_size: 10MiB  # Increase for large multiline messages

Performance Impact:

  • Multiline parsing adds CPU overhead
  • Memory usage increases with message accumulation
  • Test patterns thoroughly before production deployment
  • Monitor for unexpected message grouping

UDP Limitations:

  • UDP multiline support is limited by packet boundaries
  • Each UDP packet is typically a complete message
  • Use TCP for reliable multiline log handling

RFC 6587 Parameters

enable_octet_counting

The enable_octet_counting parameter enables RFC 6587 Octet Counting framing for TCP syslog, required by FortiGate and other enterprise devices.

It is specified as a boolean and is optional. Default is false. Only works with transport_protocol: tcp and protocol: rfc5424.

nodes:
  - name: <node name>
    type: syslog_input
    protocol: rfc5424
    transport_protocol: tcp
    port: <port>
    enable_octet_counting: true
    max_octets: 8192

See the RFC 6587 Framing Support section for detailed information.

max_octets

The max_octets parameter sets the maximum message size in bytes when using octet counting.

It is specified as an integer and is optional. Default is 8192.

enable_octet_counting: true
max_octets: 16384

non_transparent_framing_trailer

The non_transparent_framing_trailer parameter specifies the delimiter for RFC 6587 Non-Transparent-Framing mode.

It is specified as a string and is optional. Valid values: LF (line feed) or NUL (null character).

nodes:
  - name: <node name>
    type: syslog_input
    protocol: rfc5424
    transport_protocol: tcp
    port: <port>
    non_transparent_framing_trailer: LF

allow_skip_pri_header

The allow_skip_pri_header parameter allows processing of non-standard syslog messages that lack the priority header (<###>).

It is specified as a boolean and is optional. Default is false.

nodes:
  - name: <node name>
    type: syslog_input
    protocol: rfc3164
    transport_protocol: <transport>
    port: <port>
    allow_skip_pri_header: true

When to Enable:

  • Legacy systems sending non-standard syslog
  • Custom applications not following RFC format
  • Troubleshooting message format issues

Limitations:

  • priority, severity, and facility fields will be null/missing
  • Cannot determine message criticality without priority
  • May indicate misconfigured source

rate_limit

The rate_limit parameter enables you to control data ingestion based on system resource usage. This advanced setting helps prevent source nodes from overwhelming the agent by automatically throttling or stopping data collection when CPU or memory thresholds are exceeded.

Use rate limiting to prevent runaway log collection from overwhelming the agent in high-volume sources, protect agent stability in resource-constrained environments with limited CPU/memory, automatically throttle during bursty traffic patterns, and ensure fair resource allocation across source nodes in multi-tenant deployments.

When rate limiting triggers, pull-based sources (File, S3, HTTP Pull) stop fetching new data, push-based sources (HTTP, TCP, UDP, OTLP) reject incoming data, and stream-based sources (Kafka, Pub/Sub) pause consumption. Rate limiting operates at the source node level, where each source with rate limiting enabled independently monitors and enforces its own thresholds.

Configuration Steps:

  1. Click Add New in the Rate Limit section
  2. Click Add New for Evaluation Policy
  3. Select Policy Type:
  • CPU Usage: Monitors CPU consumption and rate limits when usage exceeds defined thresholds. Use for CPU-intensive sources like file parsing or complex transformations.
  • Memory Usage: Monitors memory consumption and rate limits when usage exceeds defined thresholds. Use for memory-intensive sources like large message buffers or caching.
  • AND (composite): Combines multiple sub-policies with AND logic. All sub-policies must be true simultaneously to trigger rate limiting. Use when you want conservative rate limiting (both CPU and memory must be high).
  • OR (composite): Combines multiple sub-policies with OR logic. Any sub-policy can trigger rate limiting. Use when you want aggressive rate limiting (either CPU or memory being high triggers).
  1. Select Evaluation Mode. Choose how the policy behaves when thresholds are exceeded:
  • Enforce (default): Actively applies rate limiting when thresholds are met. Pull-based sources (File, S3, HTTP Pull) stop fetching new data, push-based sources (HTTP, TCP, UDP, OTLP) reject incoming data, and stream-based sources (Kafka, Pub/Sub) pause consumption. Use in production to protect agent resources.
  • Monitor: Logs when rate limiting would occur without actually limiting data flow. Use for testing thresholds before enforcing them in production.
  • Passthrough: Disables rate limiting entirely while keeping the configuration in place. Use to temporarily disable rate limiting without removing configuration.
  1. Set Absolute Limits and Relative Limits (for CPU Usage and Memory Usage policies)

Note: If you specify both absolute and relative limits, the system evaluates both conditions and rate limiting triggers when either condition is met (OR logic). For example, if you set absolute limit to 1.0 CPU cores and relative limit to 50%, rate limiting triggers when the source uses either 1 full core OR 50% of available CPU, whichever happens first.

  • For CPU Absolute Limits: Enter value in full core units:

    • 0.1 = one-tenth of a CPU core
    • 0.5 = half a CPU core
    • 1.0 = one full CPU core
    • 2.0 = two full CPU cores
  • For CPU Relative Limits: Enter percentage of total available CPU (0-100):

    • 50 = 50% of available CPU
    • 75 = 75% of available CPU
    • 85 = 85% of available CPU
  • For Memory Absolute Limits: Enter value in bytes

    • 104857600 = 100Mi (100 × 1024 × 1024)
    • 536870912 = 512Mi (512 × 1024 × 1024)
    • 1073741824 = 1Gi (1 × 1024 × 1024 × 1024)
  • For Memory Relative Limits: Enter percentage of total available memory (0-100)

    • 60 = 60% of available memory
    • 75 = 75% of available memory
    • 80 = 80% of available memory
  1. Set Refresh Interval (for CPU Usage and Memory Usage policies). Specify how frequently the system checks resource usage:
  • Recommended Values:
    • 10s to 30s for most use cases
    • 5s to 10s for high-volume sources requiring quick response
    • 1m or higher for stable, low-volume sources

The system fetches current CPU/memory usage at the specified refresh interval and uses that value for evaluation until the next refresh. Shorter intervals provide more responsive rate limiting but incur slightly higher overhead, while longer intervals are more efficient but slower to react to sudden resource spikes.

The GUI generates YAML as follows:

# Simple CPU-based rate limiting
nodes:
  - name: <node name>
    type: <node type>
    rate_limit:
      evaluation_policy:
        policy_type: cpu_usage
        evaluation_mode: enforce
        absolute_limit: 0.5  # Limit to half a CPU core
        refresh_interval: 10s
# Simple memory-based rate limiting
nodes:
  - name: <node name>
    type: <node type>
    rate_limit:
      evaluation_policy:
        policy_type: memory_usage
        evaluation_mode: enforce
        absolute_limit: 536870912  # 512Mi in bytes
        refresh_interval: 30s

Composite Policies (AND / OR)

When using AND or OR policy types, you define sub-policies instead of limits. Sub-policies must be siblings (at the same level)—do not nest sub-policies within other sub-policies. Each sub-policy is independently evaluated, and the parent policy’s evaluation mode applies to the composite result.

  • AND Logic: All sub-policies must evaluate to true at the same time to trigger rate limiting. Use when you want conservative rate limiting (limit only when CPU AND memory are both high).
  • OR Logic: Any sub-policy evaluating to true triggers rate limiting. Use when you want aggressive protection (limit when either CPU OR memory is high).

Configuration Steps:

  1. Select AND (composite) or OR (composite) as the Policy Type
  2. Choose the Evaluation Mode (typically Enforce)
  3. Click Add New under Sub-Policies to add the first condition
  4. Configure the first sub-policy by selecting policy type (CPU Usage or Memory Usage), selecting evaluation mode, setting absolute and/or relative limits, and setting refresh interval
  5. In the parent policy (not within the child), click Add New again to add a sibling sub-policy
  6. Configure additional sub-policies following the same pattern

The GUI generates YAML as follows:

# AND composite policy - both CPU AND memory must exceed limits
nodes:
  - name: <node name>
    type: <node type>
    rate_limit:
      evaluation_policy:
        policy_type: and
        evaluation_mode: enforce
        sub_policies:
          # First sub-policy (sibling)
          - policy_type: cpu_usage
            evaluation_mode: enforce
            absolute_limit: 0.75  # Limit to 75% of one core
            refresh_interval: 15s
          # Second sub-policy (sibling)
          - policy_type: memory_usage
            evaluation_mode: enforce
            absolute_limit: 1073741824  # 1Gi in bytes
            refresh_interval: 15s
# OR composite policy - either CPU OR memory can trigger
nodes:
  - name: <node name>
    type: <node type>
    rate_limit:
      evaluation_policy:
        policy_type: or
        evaluation_mode: enforce
        sub_policies:
          - policy_type: cpu_usage
            evaluation_mode: enforce
            relative_limit: 85  # 85% of available CPU
            refresh_interval: 20s
          - policy_type: memory_usage
            evaluation_mode: enforce
            relative_limit: 80  # 80% of available memory
            refresh_interval: 20s
# Monitor mode for testing thresholds
nodes:
  - name: <node name>
    type: <node type>
    rate_limit:
      evaluation_policy:
        policy_type: memory_usage
        evaluation_mode: monitor  # Only logs, doesn't limit
        relative_limit: 70  # Test at 70% before enforcing
        refresh_interval: 30s

source_metadata

This option is used to define which detected resources and attributes to add to each data item as it is ingested by Edge Delta. You can select:

  • Required Only: This option includes the minimum required resources and attributes for Edge Delta to operate.
  • Default: This option includes the required resources and attributes plus those selected by Edge Delta
  • High: This option includes the required resources and attributes along with a larger selection of common optional fields.
  • Custom: With this option selected, you can choose which attributes and resources to include. The required fields are selected by default and can’t be unchecked.

Based on your selection in the GUI, the source_metadata YAML is populated as two dictionaries (resource_attributes and attributes) with Boolean values.

See Choose Data Item Metadata for more information on selecting metadata.

Configuring Syslog Sources

Rsyslog Configuration

Configure rsyslog to forward logs to Edge Delta:

# /etc/rsyslog.conf or /etc/rsyslog.d/edge-delta.conf

# Forward all logs to Edge Delta via UDP
*.* @<edge-delta-host>:5514

# Forward only critical logs via TCP for guaranteed delivery
*.crit @@<edge-delta-host>:6514

# Forward specific facilities
auth,authpriv.* @<edge-delta-host>:5514
kern.* @<edge-delta-host>:5514
mail.err @@<edge-delta-host>:6514

# Forward with custom template (RFC 5424)
$ActionForwardDefaultTemplate RSYSLOG_SyslogProtocol23Format
*.* @<edge-delta-host>:5514

This rsyslog configuration demonstrates different forwarding patterns for various use cases. The single @ symbol indicates UDP transport while double @@ specifies TCP. The selector syntax (facility.priority) controls which messages are forwarded—for example, *.crit sends all critical-level messages, while auth,authpriv.* sends all authentication-related logs regardless of severity. The last section enables RFC 5424 formatting using rsyslog’s built-in template for modern syslog protocol compliance.

After configuration, restart rsyslog:

sudo systemctl restart rsyslog

Syslog-ng Configuration

Configure syslog-ng to forward to Edge Delta:

# /etc/syslog-ng/syslog-ng.conf

destination d_edge_delta {
    network("<edge-delta-host>" port(5514) transport("udp"));
};

# For TCP with RFC 5424
destination d_edge_delta_tcp {
    syslog("<edge-delta-host>"
           port(6514)
           transport("tcp")
           flags(syslog-protocol));
};

log {
    source(s_src);
    destination(d_edge_delta);
};

This syslog-ng configuration creates two destination definitions for Edge Delta. The first uses the network() driver for simple UDP forwarding, while the second uses the syslog() driver with the syslog-protocol flag to enable RFC 5424 formatting over TCP. The log statement connects your existing log source (s_src) to the Edge Delta destination. You can modify the log statement to include filters or use the TCP destination instead by changing d_edge_delta to d_edge_delta_tcp.

Network Device Configuration

Cisco IOS

Configure Cisco IOS devices to forward syslog messages to Edge Delta. The logging trap command sets the minimum severity level (informational captures levels 0-6), while logging origin-id hostname ensures each message includes the device hostname for identification.

logging host <edge-delta-host> transport udp port 5514
logging trap informational
logging origin-id hostname

Juniper Junos

Configure Juniper devices to send syslog messages to Edge Delta. The first command specifies the destination host and port, the second sets the minimum severity level (any info captures all facilities at info level and above), and facility-override remaps all messages to the local0 facility for consistent processing.

set system syslog host <edge-delta-host> port 5514
set system syslog host <edge-delta-host> any info
set system syslog host <edge-delta-host> facility-override local0

FortiGate Firewall

FortiGate firewalls require RFC 6587 Octet Counting when using reliable (TCP) mode. This configuration demonstrates how to receive FortiGate logs with proper framing support.

Edge Delta Configuration:

nodes:
  - name: fortigate_syslog
    type: syslog_input
    protocol: rfc5424
    transport_protocol: tcp
    port: 514
    enable_octet_counting: true
    tcp:
      max_log_size: 10MiB
    location: America/New_York

FortiGate CLI Configuration:

config log syslogd setting
    set status enable
    set server "<edge-delta-host>"
    set port 514
    set mode reliable
    set facility local7
    set format rfc5424
end

The mode reliable setting triggers TCP with RFC 6587 Octet Counting. FortiGate logs include rich structured data that Edge Delta automatically parses into the structured_data field for easy downstream filtering and analysis.

Palo Alto Networks Firewall

Palo Alto Networks firewalls can send logs in both BSD (RFC 3164) and structured (RFC 5424) formats. For modern deployments, RFC 5424 is recommended.

Edge Delta Configuration:

nodes:
  - name: palo_alto_syslog
    type: syslog_input
    protocol: rfc5424
    transport_protocol: tcp
    port: 514
    tcp:
      max_log_size: 5MiB
    location: UTC

Palo Alto CLI Configuration:

configure
set shared log-settings syslog EdgeDelta-Server
  server EdgeDelta-Server transport TCP
  server EdgeDelta-Server server <edge-delta-host>
  server EdgeDelta-Server port 514
  server EdgeDelta-Server format IETF
  server EdgeDelta-Server facility LOG_USER
commit

The format IETF setting enables RFC 5424 structured syslog. Palo Alto logs contain detailed threat intelligence, user information, and application data in the structured data field.

Cisco ASA Firewall

Cisco ASA firewalls use traditional BSD syslog format (RFC 3164). Configure for UDP to match Cisco’s default behavior, or use TCP for guaranteed delivery of security events.

Edge Delta Configuration (UDP):

nodes:
  - name: cisco_asa_syslog
    type: syslog_input
    protocol: rfc3164
    transport_protocol: udp
    port: 514
    udp:
      async:
        readers: 4
        processors_count:4
        max_queue_length: 1000
    location: America/Los_Angeles

Edge Delta Configuration (TCP for critical logs):

nodes:
  - name: cisco_asa_syslog_tcp
    type: syslog_input
    protocol: rfc3164
    transport_protocol: tcp
    port: 1514
    tcp:
      max_log_size: 2MiB
    location: America/Los_Angeles

Cisco ASA CLI Configuration:

logging enable
logging timestamp
logging trap informational
logging host inside <edge-delta-host> udp/514

# For TCP (use different port to avoid conflicts)
logging host inside <edge-delta-host> tcp/1514

F5 BIG-IP

F5 BIG-IP supports both RFC 3164 and RFC 5424 formats.

Edge Delta Configuration:

nodes:
  - name: f5_syslog
    type: syslog_input
    protocol: rfc5424
    transport_protocol: tcp
    port: 514
    tcp:
      max_log_size: 5MiB
    location: UTC

F5 TMSH Configuration:

# Create remote syslog destination
tmsh create sys syslog remote-servers add { EdgeDelta { host <edge-delta-host> remote-port 514 } }

# Configure what to log
tmsh modify sys syslog include "
destination remote_servers {
    EdgeDelta { }
}
"

Linux IPTables

Enable iptables logging and forward the resulting kernel messages to Edge Delta. The LOG target writes packet information to the kernel log with a custom prefix for easy identification. The --log-level 4 corresponds to the warning severity. After enabling iptables logging, configure rsyslog to forward these kernel warnings using the configuration shown in the rsyslog section above.

# Forward iptables logs
iptables -A INPUT -j LOG --log-prefix "iptables: " --log-level 4
# Configure rsyslog to forward kern.warning to Edge Delta

Application Integration

Python Application

Python’s built-in logging framework provides native syslog integration through the SysLogHandler class, allowing applications to send structured logs directly to Edge Delta without requiring system-level syslog configuration. This approach gives developers fine-grained control over which application events are forwarded and how they’re formatted.

import logging
import logging.handlers

# Configure syslog handler
handler = logging.handlers.SysLogHandler(
    address=('<edge-delta-host>', 5514),
    facility=logging.handlers.SysLogHandler.LOG_USER,
    socktype=socket.SOCK_DGRAM  # UDP
)

# Set format for RFC 5424
formatter = logging.Formatter('%(message)s')
handler.setFormatter(formatter)

# Add to logger
logger = logging.getLogger()
logger.addHandler(handler)
logger.setLevel(logging.INFO)

# Use in application
logger.info("Application started successfully")
logger.error("Database connection failed")

This configuration creates a syslog handler that sends messages over UDP to port 5514 using the USER facility. The formatter is kept minimal to allow the message content to be properly formatted according to syslog standards. Once configured, all log statements at INFO level and above will be automatically forwarded to Edge Delta, where they’ll be parsed and enriched with the appropriate syslog fields including timestamp, hostname, and severity based on the log level used.

Java Application (Log4j2)

Log4j2 provides enterprise-grade logging capabilities for Java applications with built-in syslog support. The Syslog appender can be configured declaratively through XML configuration files, enabling centralized log management without modifying application code. This approach is particularly valuable in microservices architectures where consistent logging across services is critical.

<!-- log4j2.xml -->
<Configuration>
  <Appenders>
    <Syslog name="EdgeDelta"
            format="RFC5424"
            host="<edge-delta-host>"
            port="5514"
            protocol="UDP"
            appName="MyApp"
            facility="USER"
            includeMDC="true">
      <PatternLayout pattern="%m"/>
    </Syslog>
  </Appenders>
  <Loggers>
    <Root level="info">
      <AppenderRef ref="EdgeDelta"/>
    </Root>
  </Loggers>
</Configuration>

This Log4j2 configuration creates a Syslog appender that formats messages according to RFC 5424 standards and sends them via UDP to Edge Delta. The includeMDC="true" setting ensures that any Mapped Diagnostic Context (MDC) data, such as request IDs or user identifiers, is included as structured data in the syslog message. The PatternLayout is kept simple to prevent double-formatting, allowing Log4j2’s syslog appender to properly structure the message with all required syslog fields.

Docker Container Logging

Docker’s logging driver architecture allows containers to send their stdout and stderr streams directly to syslog destinations without requiring any changes to the containerized application. This container-level approach ensures that all output from the application, including startup messages and uncaught exceptions, is captured and forwarded to Edge Delta.

# Configure Docker to send container logs via syslog
docker run --log-driver=syslog \
  --log-opt syslog-address=udp://<edge-delta-host>:5514 \
  --log-opt syslog-format=rfc5424 \
  --log-opt tag="{{.Name}}/{{.ID}}" \
  myapp:latest

The Docker syslog driver configuration uses RFC 5424 format for structured logging and includes container metadata through the tag template. The {{.Name}}/{{.ID}} tag format provides both the container name and a unique identifier in each log message, making it easy to correlate logs across container restarts or scaling events. This approach works seamlessly with container orchestrators like Docker Swarm or standalone Docker hosts, though Kubernetes users typically rely on the Edge Delta DaemonSet for log collection instead.

Performance Tuning and Optimization

Edge Delta’s syslog implementation includes several performance optimization features that enable it to handle enterprise-scale log volumes while maintaining low resource utilization.

TCP Performance Optimization

Baseline TCP Configuration

Start with a conservative TCP configuration and scale based on observed performance:

nodes:
  - name: baseline_tcp_syslog
    type: syslog_input
    protocol: rfc5424
    transport_protocol: tcp
    port: 514
    tcp:
      max_log_size: 1MiB

This provides a solid baseline for TCP syslog processing.

Optimized TCP Configuration

For high-volume TCP syslog, consider these performance optimizations:

nodes:
  - name: optimized_tcp_syslog
    type: syslog_input
    protocol: rfc5424
    transport_protocol: tcp
    port: 514
    tcp:
      max_log_size: 5MiB
      add_attributes: false

Performance Considerations for add_attributes:

  • Minimal CPU overhead
  • Slight increase in data size (network attributes per message)
  • Disable if downstream systems don’t use OpenTelemetry conventions

UDP Performance Optimization

Baseline UDP Configuration

Standard UDP configuration without async processing:

nodes:
  - name: baseline_udp_syslog
    type: syslog_input
    protocol: rfc3164
    transport_protocol: udp
    port: 514

This single-threaded configuration is suitable for low to moderate volume environments.

High-Performance Async UDP Configuration

Enable async processing for dramatic performance improvements:

nodes:
  - name: high_perf_udp_syslog
    type: syslog_input
    protocol: rfc3164
    transport_protocol: udp
    port: 514
    udp:
      async:
        readers: 4
        processors_count:4
        max_queue_length: 2000

Scaling Characteristics by Configuration:

ReadersProcessorsQueueCPU Cores UsedNotes
11-1Baseline (synchronous)
225002Conservative async
4410004Standard async
8820008High-volume async
1616500016Maximum throughput

Tuning Async Parameters

Reader Count: Number of goroutines reading from the UDP socket

  • Start with CPU core count / 2
  • Increase if receiving dropped packets (check netstat -su)
  • Maximum benefit typically at 8-16 readers

Processor Count: Number of goroutines processing messages

  • Match reader count for balanced pipeline
  • Can be lower if parsing is lightweight
  • Can be higher if heavy downstream processing

Queue Length: Buffer between readers and processors

  • Start with 500-1000 for normal traffic
  • Increase to 2000-5000 for bursty traffic patterns
  • Monitor for queue full conditions
  • Each queued message consumes ~1-2KB memory

Example for Ultra High-Volume Environments:

nodes:
  - name: ultra_high_volume_syslog
    type: syslog_input
    protocol: rfc3164
    transport_protocol: udp
    port: 514
    udp:
      async:
        readers: 16
        processors_count:16
        max_queue_length: 10000

System Requirements:

  • 16+ CPU cores
  • 8+ GB RAM
  • 10 Gbps network interface
  • OS socket buffer tuning (see below)

Operating System Tuning

For very high volume scenarios, tune OS-level parameters:

Linux Socket Buffer Tuning

# Increase UDP receive buffer size
sudo sysctl -w net.core.rmem_max=134217728
sudo sysctl -w net.core.rmem_default=134217728

# For persistence across reboots
echo "net.core.rmem_max=134217728" | sudo tee -a /etc/sysctl.conf
echo "net.core.rmem_default=134217728" | sudo tee -a /etc/sysctl.conf

Check for Dropped Packets

# Monitor UDP socket statistics
watch -n 1 'netstat -su | grep -i "packet receive errors\|buffer errors"'

# If seeing drops, increase queue length or add more readers

Resource Sizing Guidelines

Small Deployment (Low Volume)

# CPU: 1-2 cores
# Memory: 512MB - 1GB
# Network: 1 Gbps
nodes:
  - name: small_syslog
    type: syslog_input
    protocol: rfc5424
    transport_protocol: tcp
    port: 514

Medium Deployment (Moderate Volume)

# CPU: 2-4 cores
# Memory: 2-4GB
# Network: 1-10 Gbps
nodes:
  - name: medium_syslog
    type: syslog_input
    protocol: rfc5424
    transport_protocol: udp
    port: 514
    udp:
      async:
        readers: 4
        processors_count:4
        max_queue_length: 1000

Large Deployment (High Volume)

# CPU: 8-16 cores
# Memory: 8-16GB
# Network: 10 Gbps
nodes:
  - name: large_syslog
    type: syslog_input
    protocol: rfc5424
    transport_protocol: udp
    port: 514
    udp:
      async:
        readers: 8
        processors_count:8
        max_queue_length: 5000

Enterprise Deployment (Very High Volume)

# CPU: 16-32 cores
# Memory: 16-32GB
# Network: 10-40 Gbps
# Consider horizontal scaling with multiple Edge Delta agents
nodes:
  - name: enterprise_syslog
    type: syslog_input
    protocol: rfc5424
    transport_protocol: udp
    port: 514
    udp:
      async:
        readers: 16
        processors_count:16
        max_queue_length: 10000

Monitoring and Metrics

Track these key metrics to ensure optimal performance:

CPU Utilization:

  • Target: 60-70% under normal load
  • If consistently > 80%: Scale horizontally or increase resources
  • If < 30%: Reduce async readers/processors to free resources

Memory Usage:

  • Baseline: ~100-200MB
  • With async queues: +1-2MB per 1000 queue length
  • Monitor for steady growth (indicates memory leak)

Message Rate:

  • Track messages/second received
  • Compare to expected volume
  • Alert on sudden drops (indicates upstream issues)

Dropped Packets (UDP only):

  • Check netstat -su for “packet receive errors”
  • Should be 0 or near-zero
  • If increasing: Tune queue length or OS buffers

Troubleshooting Performance Issues

High CPU Usage:

  1. Reduce async processors if CPU-bound
  2. Disable add_attributes if not needed
  3. Consider splitting load across multiple agents

Dropped UDP Packets:

  1. Increase max_queue_length
  2. Increase async readers
  3. Tune OS socket buffers (see above)
  4. Distribute load across multiple agents/ports

High Memory Usage:

  1. Reduce max_queue_length
  2. Reduce max_log_size to prevent large message accumulation
  3. Check for message buildup (downstream processing slow)

Testing Syslog Configuration

After configuring your systems, you can test the connection using these methods:

Using Logger Command

# Send test message from Linux/Unix systems
logger -n <edge-delta-host> -P 5514 -p user.info "Test message from $(hostname)"

# Test with different priorities
logger -n <edge-delta-host> -P 5514 -p user.error "Test error message"
logger -n <edge-delta-host> -P 5514 -p user.crit "Test critical message"

Using Netcat for Manual Testing

# Send RFC 5424 formatted test message via UDP
echo '<14>1 2025-09-04T12:00:00Z test-host app - - - Test connection' | nc -u -w1 <edge-delta-host> 5514

# Test TCP connection
echo '<14>1 2025-09-04T12:00:00Z test-host app - - - TCP test' | nc -w1 <edge-delta-host> 6514

Testing RFC 6587 Octet Counting

Test octet counting framing required by FortiGate:

# Manually construct octet-counted message
# Format: <byte-count><space><message>
# Message: <34>1 2025-10-06T12:00:00Z test app - - - Octet test

# Calculate length (52 bytes in this example)
MSG='<34>1 2025-10-06T12:00:00Z test app - - - Octet test'
LENGTH=${#MSG}
echo "${LENGTH} ${MSG}" | nc <edge-delta-host> 514

# Test with longer message
MSG='<34>1 2025-10-06T12:00:00Z hostname myapp 123 ID47 - This is a longer test message for octet counting validation'
LENGTH=${#MSG}
echo "${LENGTH} ${MSG}" | nc <edge-delta-host> 514

Testing RFC 5424 Structured Data

Test structured data parsing with realistic examples:

# FortiGate-style structured data
echo '<34>1 2025-10-06T12:00:00Z firewall01 fortios 5678 ID47 [fortigate@32473 vd="root" logid="0000000013" type="traffic" subtype="forward"] Traffic allowed' | nc <edge-delta-host> 514

# Cisco-style structured data
echo '<134>1 2025-10-06T12:00:00Z switch01 ios 1234 LINK-3-UPDOWN [cisco@9 interface="GigabitEthernet1/0/1" state="up"] Interface state changed' | nc <edge-delta-host> 514

# Multiple structured data elements
echo '<34>1 2025-10-06T12:00:00Z app01 myapp 999 MSG123 [origin@123 ip="10.0.0.5"][meta@123 user="john" session="abc"] User login successful' | nc <edge-delta-host> 514

Testing Multiline Logs

Test multiline log handling (TCP only):

# Java stack trace simulation
cat <<'EOF' | nc <edge-delta-host> 514
<134>Oct 6 12:00:00 appserver java: Exception in thread "main"
<134>Oct 6 12:00:00 appserver java:     at com.example.Main.main(Main.java:15)
<134>Oct 6 12:00:00 appserver java: Caused by: java.lang.NullPointerException
<134>Oct 6 12:00:00 appserver java:     at com.example.Helper.process(Helper.java:42)
EOF

Note: With proper multiline.line_start_pattern configuration, these should be assembled into a single log entry.

High-Volume Load Testing

Test async UDP performance with high message rates:

# Install hping3 for high-rate UDP testing
sudo apt-get install hping3  # Debian/Ubuntu
sudo yum install hping3       # RHEL/CentOS

# Generate high-rate UDP syslog traffic
# Adjust loop count and sleep interval for desired message rate
for i in {1..10000}; do
  echo "<134>Oct 6 12:00:00 test syslog: Load test message $i" | nc -u -w0 <edge-delta-host> 514 &
  if [ $((i % 100)) -eq 0 ]; then sleep 0.1; fi
done

# Monitor for dropped packets
watch -n 1 'netstat -su | grep "packet receive errors"'

Performance Benchmark Script

Create a simple benchmark to measure throughput:

#!/bin/bash
# syslog-benchmark.sh

HOST="<edge-delta-host>"
PORT=514
MESSAGES=10000

echo "Sending $MESSAGES messages to $HOST:$PORT"
START=$(date +%s.%N)

for i in $(seq 1 $MESSAGES); do
  echo "<134>Oct 6 12:00:00 benchmark test: Message $i" | nc -u -w0 $HOST $PORT 2>/dev/null
done

END=$(date +%s.%N)
ELAPSED=$(echo "$END - $START" | bc)
RATE=$(echo "scale=2; $MESSAGES / $ELAPSED" | bc)

echo "Sent $MESSAGES messages in $ELAPSED seconds"
echo "Average rate: $RATE messages/second"

Run the benchmark:

chmod +x syslog-benchmark.sh
./syslog-benchmark.sh

Verify Receipt

Check Edge Delta Live Capture or logs to confirm messages are being received and processed correctly. For structured data tests, verify that the structured_data field is properly populated with the key-value pairs.

Best Practices

Port Selection

When configuring the Syslog source node, choose ports above 1024 to avoid requiring root privileges for the Edge Delta agent. The standard syslog port 514 requires elevated permissions, which may not be available in containerized environments. Common alternatives include port 5514 for UDP traffic and port 6514 for TCP connections, both of which can be bound by non-privileged processes while maintaining compatibility with most syslog clients.

Protocol Selection

For new deployments, RFC 5424 is the recommended syslog format due to its enhanced structure, support for structured data elements, and precise ISO 8601 timestamp formatting with timezone information. This modern format provides better metadata handling and allows for key-value pairs within the message structure. Only use RFC 3164 when dealing with legacy systems that cannot be upgraded, as this older format lacks the structured data capabilities and has limited timestamp precision that can lead to parsing ambiguities.

Transport Selection

The choice between UDP and TCP transport protocols depends on your specific requirements for reliability versus performance. UDP is ideal for high-volume, non-critical log streams where some message loss is acceptable in exchange for lower overhead and better throughput. This connectionless protocol minimizes resource usage and handles traffic spikes more gracefully. TCP should be used for critical logs that require guaranteed delivery, such as security events or compliance data, though it comes with higher resource consumption and connection management overhead. Consider your network’s bandwidth limitations and reliability characteristics when making this decision.

Security Considerations

Traditional syslog transmits data in plain text without encryption, making it vulnerable to interception and tampering. Implement strict firewall rules to restrict which IP addresses can send syslog messages to your Edge Delta agents, reducing the risk of log injection attacks. Regular monitoring for suspicious patterns or potential message spoofing attempts is essential, particularly when receiving logs from internet-facing sources. For highly sensitive environments, consider using dedicated network segments or VPNs for syslog traffic.

Performance Optimization

To optimize performance in high-volume environments, start with UDP transport to minimize processing overhead while accepting that some messages may be lost during traffic spikes. Adjust receive buffer sizes based on your message volume and burst patterns to prevent drops during peak periods. For environments generating substantial log volumes, distribute the load across multiple Edge Delta agents using DNS round-robin or load balancer configurations. Continuously monitor CPU and memory usage of your Edge Delta agents, adjusting resource allocations and scaling horizontally when utilization consistently exceeds 70%. Regular analysis of message patterns can help identify opportunities to filter unnecessary logs at the source, reducing overall processing requirements.

Troubleshooting

Messages Not Received

Symptoms:

  • Syslog messages not appearing in Edge Delta pipelines
  • Source indicates successful sends but nothing received

Solutions:

  1. Network Connectivity:

    # Test basic connectivity
    telnet <edge-delta-host> 514
    
    # Test UDP port (requires netcat)
    nc -u -z <edge-delta-host> 514
    
  2. Firewall Rules:

    # Check if port is listening
    sudo netstat -tulpn | grep 514
    
    # Verify firewall allows traffic
    sudo iptables -L -n | grep 514
    
  3. Port Permissions:

    • Ports below 1024 require root/elevated privileges
    • Use ports 5514, 6514, or similar for non-root agents
    • Check Edge Delta startup logs for “permission denied” errors
  4. Protocol Mismatch:

    • Verify source sends UDP and Edge Delta listens on UDP (or TCP/TCP)
    • Check RFC version match (rfc3164 vs rfc5424)

FortiGate Logs Truncated or Corrupted

Symptoms:

  • FortiGate messages incomplete
  • Parsing errors in Edge Delta logs
  • Messages cut off mid-stream

Root Cause: Missing enable_octet_counting: true parameter

Solution:

nodes:
  - name: fortigate_syslog
    type: syslog_input
    protocol: rfc5424
    transport_protocol: tcp
    port: 514
    enable_octet_counting: true  # REQUIRED for FortiGate reliable mode
    tcp:
      max_log_size: 10MiB

Verification:

# FortiGate must use mode reliable
config log syslogd setting
    get
end

# Look for: mode: reliable

High CPU Usage

Symptoms:

  • CPU utilization consistently > 80%
  • Messages processing slowly
  • System becoming unresponsive

Diagnostic:

# Check CPU usage
top -p $(pgrep edge-delta)

# Monitor message rate
# Check Edge Delta metrics

Solutions:

1. Disable Performance Features if Not Needed:

tcp:
  add_attributes: false  # Saves 2-3% CPU

2. Reduce Async Processor Count:

udp:
  async:
    readers: 4
    processors_count:2  # Reduce if CPU-bound

3. Distribute Load:

  • Deploy multiple Edge Delta agents
  • Use DNS round-robin or load balancer
  • Split by device type or facility

4. Filter at Source:

  • Configure syslog sources to send only necessary logs
  • Use facility/severity filtering
  • Reduce debug-level logs

Dropped UDP Packets

Symptoms:

  • netstat -su shows increasing “packet receive errors”
  • Message loss during traffic bursts
  • Inconsistent log delivery

Diagnostic:

# Check current drops
netstat -su | grep -i "receive errors"

# Monitor in real-time
watch -n 1 'netstat -su | grep "packet receive errors"'

# Check socket buffer size
sysctl net.core.rmem_default
sysctl net.core.rmem_max

Solutions:

1. Enable Async UDP Processing:

udp:
  async:
    readers: 4      # Start here
    processors_count:4
    max_queue_length: 1000

2. Increase Queue Length:

udp:
  async:
    readers: 4
    processors_count:4
    max_queue_length: 5000  # Increase for bursts

3. Tune OS Socket Buffers:

# Temporarily increase
sudo sysctl -w net.core.rmem_max=134217728
sudo sysctl -w net.core.rmem_default=67108864

# Make permanent
echo "net.core.rmem_max=134217728" | sudo tee -a /etc/sysctl.conf
echo "net.core.rmem_default=67108864" | sudo tee -a /etc/sysctl.conf
sudo sysctl -p

4. Scale Horizontally:

  • Add more Edge Delta agents
  • Use different ports per agent
  • Load balance with DNS or hardware LB

Memory Issues

Symptoms:

  • Edge Delta agent consuming excessive memory
  • Out of memory errors
  • Agent crashes under load

Diagnostic:

# Check memory usage
ps aux | grep edge-delta

# Monitor memory over time
watch -n 5 'ps aux | grep edge-delta'

Solutions:

1. Reduce Max Log Size:

tcp:
  max_log_size: 1MiB  # Reduce if seeing large messages

2. Reduce Queue Length:

udp:
  async:
    max_queue_length: 500  # Each queued message uses ~1-2KB

3. Check for Memory Leaks:

  • Review Edge Delta agent version
  • Update to latest version
  • Check for known issues in release notes

4. Monitor Downstream Processing:

  • Slow downstream causes message accumulation
  • Check pipeline processors for bottlenecks
  • Verify output destinations are accepting data

Parsing Errors

Symptoms:

  • Messages marked as unparseable in logs
  • Missing or incorrect field extraction
  • Unexpected severity_text or priority values

Solutions:

1. Verify Protocol Setting:

# RFC 3164 (BSD syslog) - https://www.rfc-editor.org/rfc/rfc3164.html
protocol: rfc3164  # Format: <PRI>MMM DD HH:MM:SS hostname tag: message

# RFC 5424 (Structured syslog) - https://www.rfc-editor.org/rfc/rfc5424.html
protocol: rfc5424  # Format: <PRI>VERSION TIMESTAMP HOSTNAME APP PID MSGID [SD] MESSAGE

2. Check Encoding:

encoding: utf-8  # Match source encoding
# Other options: ascii, utf-16le, utf-16be, big5, latin-1

3. Test with Known-Good Message:

# RFC 3164 test - https://www.rfc-editor.org/rfc/rfc3164.html
echo '<134>Oct 6 12:00:00 test syslog: Test message' | nc <host> 514

# RFC 5424 test - https://www.rfc-editor.org/rfc/rfc5424.html
echo '<134>1 2025-10-06T12:00:00Z test app - - - Test message' | nc <host> 514

Structured Data Not Parsing

Symptoms:

  • structured_data field empty or missing
  • RFC 5424 messages not showing structured elements

Solutions:

1. Verify RFC 5424 Protocol:

protocol: rfc5424  # Required for structured data - https://www.rfc-editor.org/rfc/rfc5424.html

2. Check Message Format:

# Correct format with structured data
echo '<34>1 2025-10-06T12:00:00Z host app 123 ID [sd@123 key="value"] Message' | nc <host> 514

# Structured data must be in [SD-ID@PEN PARAM="VALUE"] format

3. Verify No PRI Header Skip:

allow_skip_pri_header: false  # Must be false for proper parsing

Timestamp Issues

Symptoms:

  • Incorrect timestamps in parsed logs
  • Timezone offsets wrong
  • Timestamps in future or past

Solutions:

1. Set Location for Timezone-less Logs:

location: America/New_York  # IANA timezone name

2. Verify NTP Synchronization:

# Check time sync on source systems
timedatectl status

# Ensure NTP is active

3. RFC 5424 Includes Timezone:

protocol: rfc5424  # Includes timezone in ISO 8601 format - https://www.rfc-editor.org/rfc/rfc5424.html

Performance Issues

See Performance Tuning and Optimization section for comprehensive performance troubleshooting.

Quick checklist:

  • Enable async UDP for high volume
  • Tune OS socket buffers for >50K msgs/sec
  • Scale horizontally for >100K msgs/sec
  • Monitor CPU, memory, and network saturation