TCP Connector
Configure the TCP connector to receive logs, metrics, and telemetry data sent via TCP protocol streams from applications, systems, and network devices for AI-powered analysis.
17 minute read
Overview
The TCP connector receives logs, metrics, and telemetry data sent via TCP protocol streams from applications, systems, and network devices. TCP (Transmission Control Protocol) provides reliable, ordered, and error-checked delivery of data over IP networks, ensuring no messages are lost in transit. Content streams into Edge Delta Pipelines for analysis by AI teammates through the Edge Delta MCP connector.
The connector acts as a TCP server, accepting persistent connections from multiple clients and processing incoming data streams with configurable message delimiters. It supports TLS encryption for secure transmission, connection limits for resource management, and custom tagging for metadata enrichment.
When you add this streaming connector, it appears as a TCP source in your selected pipeline. AI teammates access this data by querying the Edge Delta backend with the Edge Delta MCP connector.
For comprehensive TCP source configuration details, see the TCP Source documentation.
Add the TCP Connector
To add the TCP connector, you configure Edge Delta to listen for incoming TCP connections on a specified port, then configure applications to send data to that endpoint.
Prerequisites
Before configuring the connector, ensure you have:
- Edge Delta agent with network access to receive inbound connections
- Firewall rules allowing inbound TCP traffic on chosen port
- Applications or systems ready to send data via TCP
- For ports below 1024, root/admin privileges (or use ports 1024+)
Configuration Steps
- Navigate to AI Team > Connectors in the Edge Delta application
- Find the TCP connector in Streaming Connectors
- Click the connector card
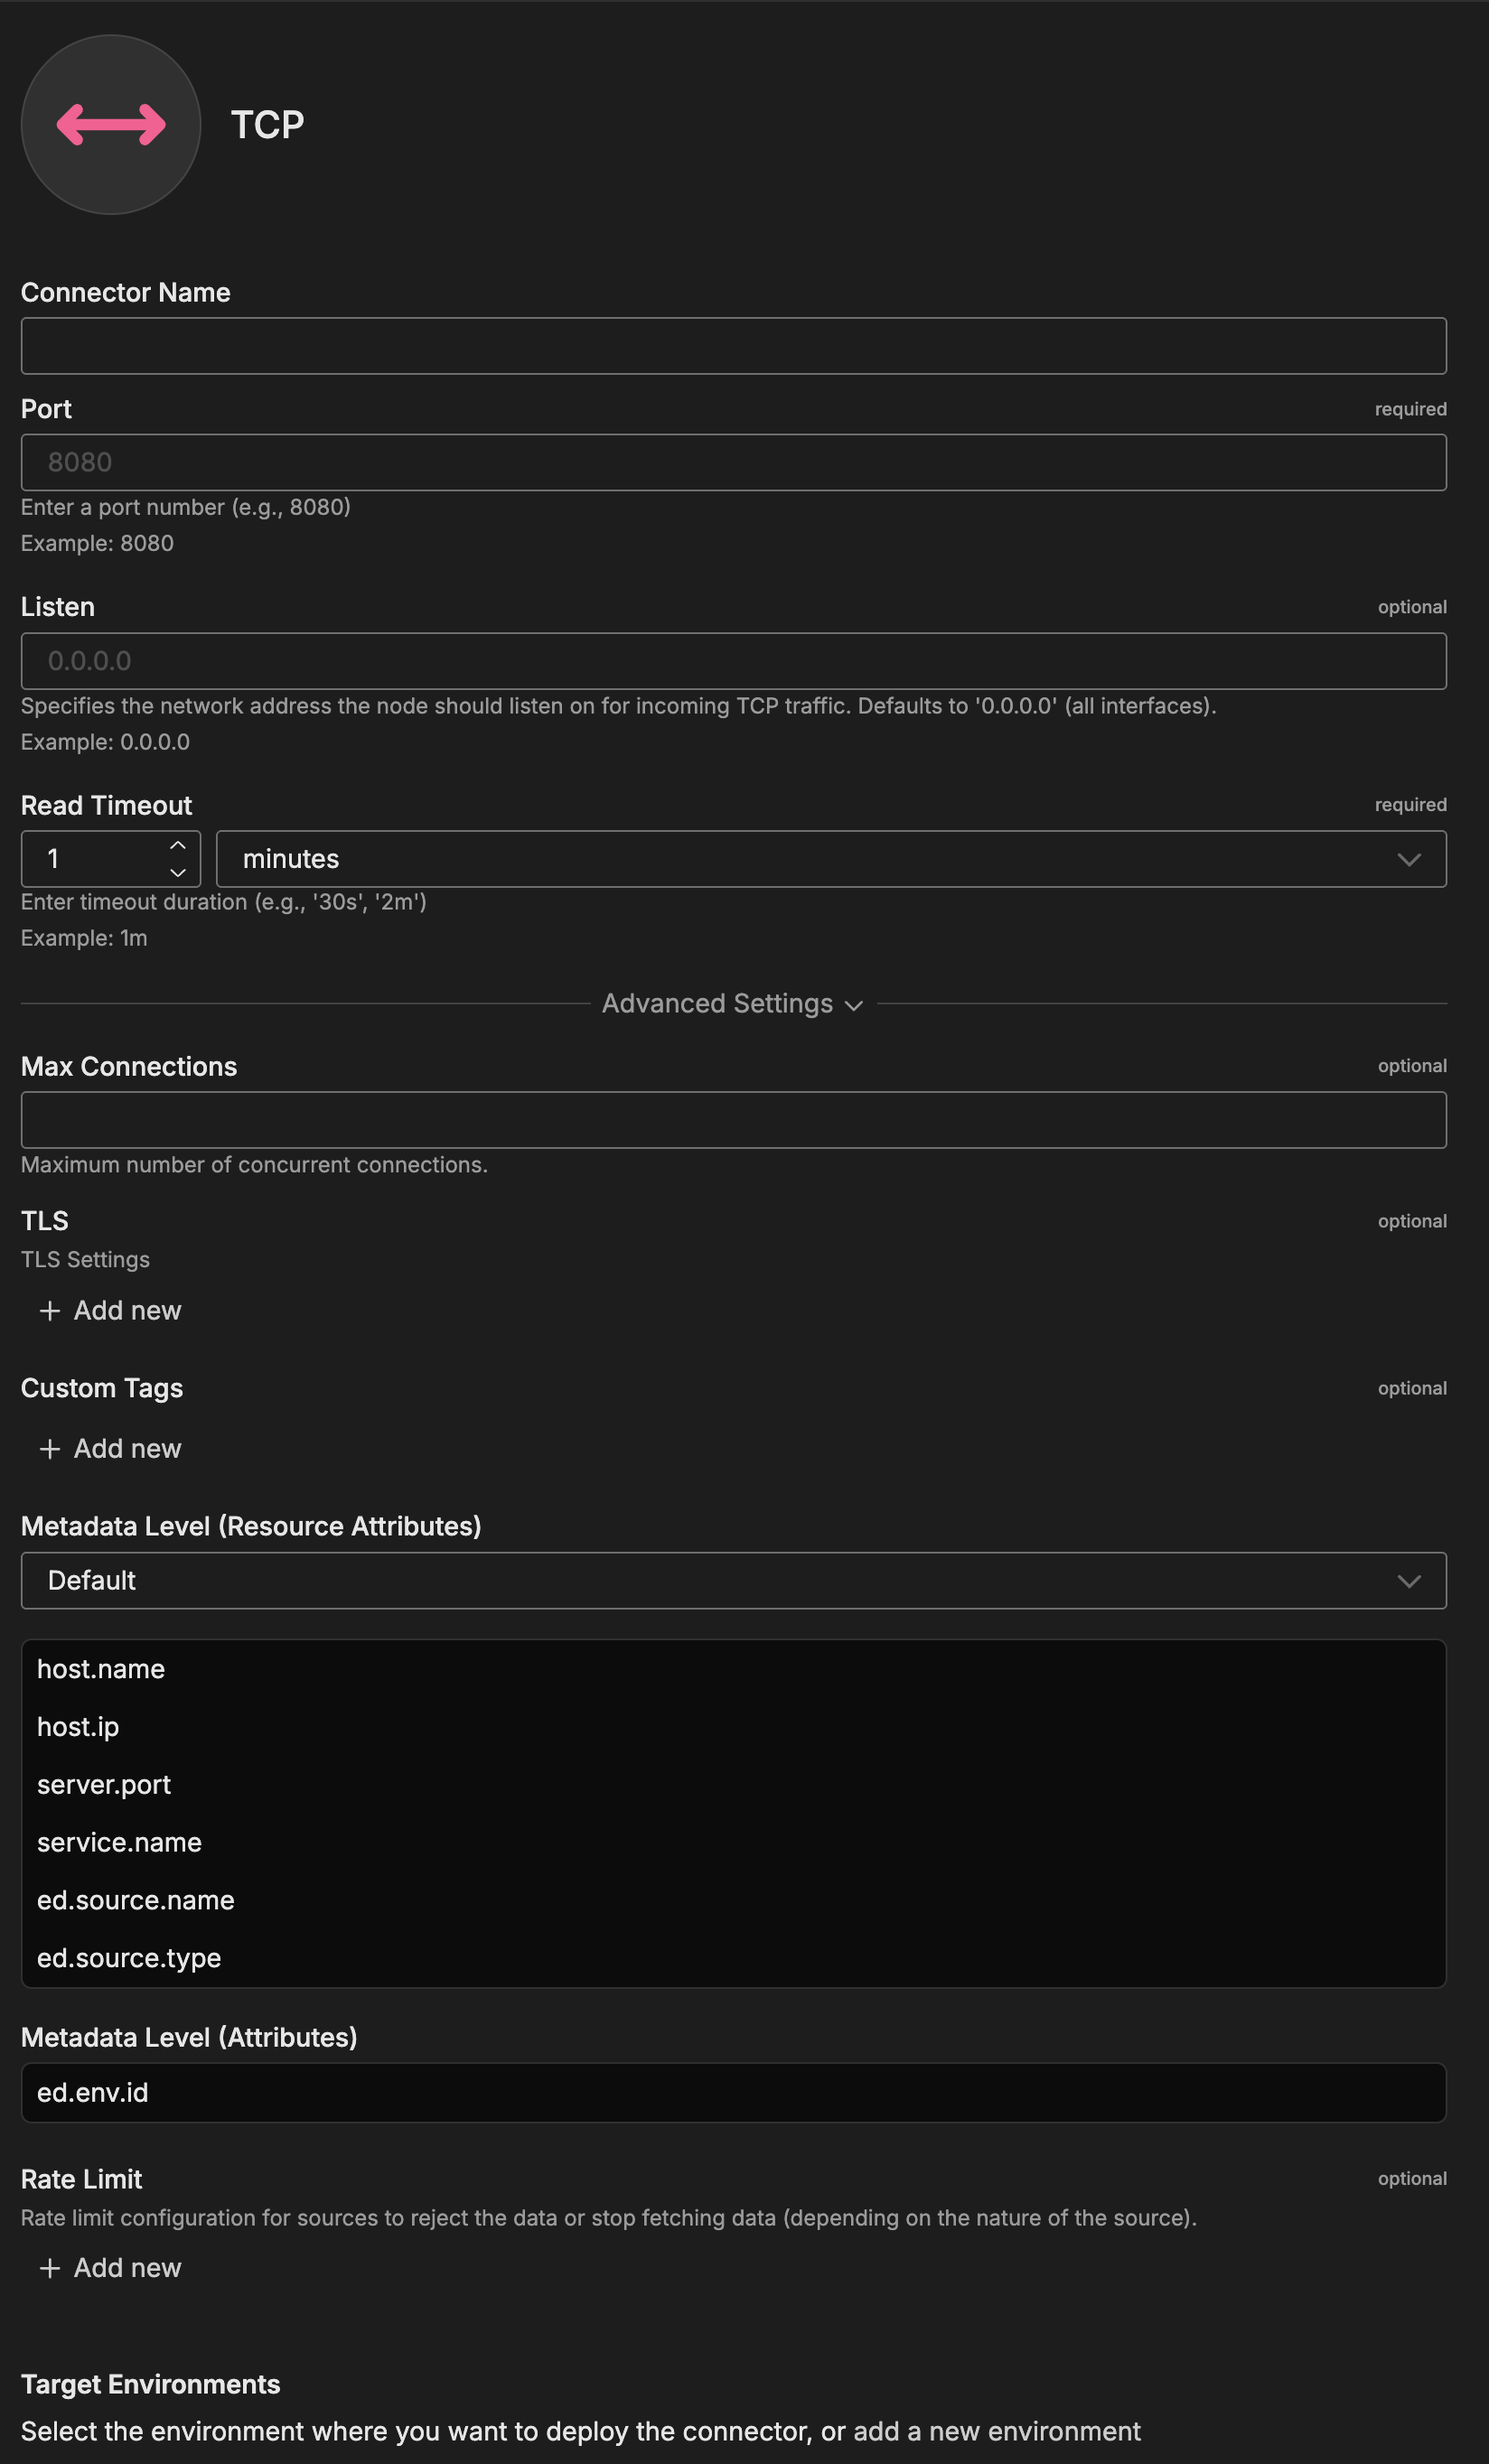
- Configure Port (8080 default or custom)
- Configure Listen address (default
0.0.0.0) - Configure Read Timeout (how long to wait for data)
- Optionally configure Advanced Settings for TLS, max connections, custom tags
- Select a target environment
- Click Save
The connector deploys and begins listening for TCP connections.
Configuration Options
Connector Name
Name to identify this TCP connector instance.
Port
TCP port to listen on for incoming connections.
Format: Integer between 1 and 65535
Default: 8080
Examples:
8080- Common application port5140- Custom log collection port9514- Alternative high port (non-privileged)
Note: Ports below 1024 require root/admin privileges on Linux/Unix systems
Listen
IP address to bind to for listening.
Format: IPv4 address
Default: 0.0.0.0 (all interfaces)
Examples:
0.0.0.0- Listen on all network interfaces192.168.1.100- Listen only on specific interface10.0.0.50- Bind to particular IP address
Read Timeout
How long to wait for incoming data before timing out connection.
Format: Duration (seconds, minutes)
Default: 1m
Examples:
30s- 30 seconds for responsive connections1m- 1 minute typical timeout5m- 5 minutes for slow or sparse streams
Purpose: Prevents idle connections from holding resources indefinitely
Advanced Settings
Max Connections
Maximum number of concurrent TCP connections.
Format: Integer
Purpose: Limits resource usage when many clients connect simultaneously
When to Use: Set based on expected number of concurrent senders and available resources
Examples:
100- Moderate number of clients500- High-volume environments1000- Large-scale deployments
TLS
Configure TLS settings for secure connections to this source. TLS is optional and typically used when the source node needs to accept encrypted connections or perform mutual TLS authentication with clients.
YAML Configuration Example:
nodes:
  - name: <node name>
    type: <source type>
    tls:
      <tls options>
CA Certificate File
Specifies the absolute path to a single CA (Certificate Authority) certificate file used to verify client certificates during mutual TLS authentication. This file contains the trusted CA certificate that signed the client certificates. Use this when you have a single CA certificate. (YAML parameter: ca_file)
When to use: Required when client_auth_type is set to verifyclientcertifgiven or requireandverifyclientcert. Choose either ca_file or ca_path, not both.
YAML Configuration Example:
nodes:
  - name: <node name>
    type: <source type>
    tls:
      ca_file: /certs/ca.pem
      client_auth_type: requireandverifyclientcert
CA Certificate Path
Specifies a directory path containing one or more CA certificate files for client certificate verification. Use this when you need to trust multiple CAs or when managing CA certificates across multiple files. All certificate files in the directory will be loaded. (YAML parameter: ca_path)
When to use: Alternative to ca_file when you have multiple CA certificates. Required when client_auth_type is set to verifyclientcertifgiven or requireandverifyclientcert. Choose either ca_file or ca_path, not both.
YAML Configuration Example:
nodes:
  - name: <node name>
    type: <source type>
    tls:
      ca_path: /certs/ca-certificates/
      client_auth_type: requireandverifyclientcert
Certificate File
Path to the server certificate file (public key) that will be presented to connecting clients during the TLS handshake. This certificate identifies the server and must match the private key. The certificate should be in PEM format and can include the full certificate chain. (YAML parameter: crt_file)
When to use: Required for TLS/HTTPS connections. Must be used together with key_file. Obtain this from your certificate authority or generate a self-signed certificate for testing.
YAML Configuration Example:
nodes:
  - name: <node name>
    type: <source type>
    tls:
      crt_file: /certs/server-cert.pem
      key_file: /certs/server-key.pem
Private Key File
Path to the private key file corresponding to the server certificate. This key must match the public key in the certificate file and is used to decrypt communications encrypted with the public key. Keep this file secure and restrict access permissions. (YAML parameter: key_file)
When to use: Required for TLS/HTTPS connections. Must be used together with crt_file. If the key file is encrypted, also specify key_password.
YAML Configuration Example:
nodes:
  - name: <node name>
    type: <source type>
    tls:
      crt_file: /certs/server-cert.pem
      key_file: /certs/server-key.pem
      key_password: <password>  # Only if key is encrypted
Private Key Password
Password (passphrase) used to decrypt an encrypted private key file. Only needed if your private key file is password-protected. If your key file is unencrypted, omit this parameter. (YAML parameter: key_password)
When to use: Optional. Only required if key_file is encrypted/password-protected. For enhanced security, use encrypted keys in production environments.
YAML Configuration Example:
nodes:
  - name: <node name>
    type: <source type>
    tls:
      crt_file: /certs/server-cert.pem
      key_file: /certs/encrypted-server-key.pem
      key_password: mySecurePassword123
Client Authentication Type
Controls how client certificates are requested and validated during the TLS handshake. This setting is specific to server-side TLS and determines the mutual TLS (mTLS) behavior. Use this to enforce certificate-based authentication from connecting clients for enhanced security. (YAML parameter: client_auth_type)
Valid options:
noclientcert- No client certificate is requested; any sent certificates are ignored. Use for standard TLS encryption without client authentication.requestclientcert- Client certificate is requested but not required. Useful for optional client authentication where you want to accept both authenticated and unauthenticated clients.requireanyclientcert- Client must send a certificate, but it is not validated against a CA. Use when you need proof a client has a certificate but don’t need to verify its authenticity.verifyclientcertifgiven- Certificate is requested but not required; if sent, it must be valid and signed by a trusted CA. Balances security with flexibility for mixed client environments.requireandverifyclientcert- Client must send a valid certificate signed by a trusted CA (full mutual TLS). Use for maximum security when all clients can be provisioned with certificates.
Default: noclientcert
When to use: Set to verifyclientcertifgiven or requireandverifyclientcert for secure environments where you need to verify client identity. When using certificate verification options, you must also configure ca_file or ca_path to specify the trusted CA certificates.
YAML Configuration Example:
nodes:
  - name: <node name>
    type: <source type>
    tls:
      client_auth_type: requireandverifyclientcert
      ca_file: /certs/ca.pem  # Required for certificate validation
Minimum TLS Version
Minimum TLS protocol version that will be accepted from connecting clients. This enforces a baseline security level by rejecting connections from clients using older, less secure TLS versions. (YAML parameter: min_version)
Available versions:
TLSv1_0- Deprecated, not recommended (security vulnerabilities)TLSv1_1- Deprecated, not recommended (security vulnerabilities)TLSv1_2- Recommended minimum for production (default)TLSv1_3- Most secure, use when all clients support it
Default: TLSv1_2
When to use: Set to TLSv1_2 or higher for production deployments. Only use TLSv1_0 or TLSv1_1 if you must support legacy clients that cannot upgrade, and be aware of the security risks. TLS 1.0 and 1.1 are officially deprecated and should be avoided.
YAML Configuration Example:
nodes:
  - name: <node name>
    type: <source type>
    tls:
      min_version: TLSv1_2
Maximum TLS Version
Maximum TLS protocol version that will be accepted from connecting clients. This is typically used to restrict newer TLS versions if compatibility issues arise with specific client implementations. (YAML parameter: max_version)
Available versions:
TLSv1_0TLSv1_1TLSv1_2TLSv1_3
When to use: Usually left unset to allow the most secure version available. Only set this if you encounter specific compatibility issues with TLS 1.3 clients, or for testing purposes. In most cases, you should allow the latest TLS version.
YAML Configuration Example:
nodes:
  - name: <node name>
    type: <source type>
    tls:
      max_version: TLSv1_3
When to Use: Enable for sensitive data (logs with PII, credentials, financial data), transmission over untrusted networks
Custom Tags
User-defined metadata tags to add to ingested data.
Fields:
- Name: Field name for custom tag
- Value: Field value (supports Go templating)
Available Template Fields:
{{.Source}}- Data source identifier{{.SourceType}}- Type of source{{.Tag}}- Tag identifier{{.ConfigID}}- Configuration ID{{.Host}}- Host name{{.DockerContainerName}},{{.DockerImageName}}- Docker-specific{{.K8sNamespace}},{{.K8sPodName}},{{.K8sContainerName}}- Kubernetes-specific{{.ECSCluster}},{{.ECSTaskFamily}}- ECS-specific{{.FileGlobPath}}- File-specific
Examples:
- Name:
environment, Value:production - Name:
app, Value:{{.K8sPodName}} - Name:
region, Value:us-east-1
Metadata Level (Resource Attributes)
This option is used to define which detected resources and attributes to add to each data item as it is ingested by Edge Delta. You can select:
- Required Only: This option includes the minimum required resources and attributes for Edge Delta to operate.
- Default: This option includes the required resources and attributes plus those selected by Edge Delta
- High: This option includes the required resources and attributes along with a larger selection of common optional fields.
- Custom: With this option selected, you can choose which attributes and resources to include. The required fields are selected by default and can’t be unchecked.
Based on your selection in the GUI, the source_metadata YAML is populated as two dictionaries (resource_attributes and attributes) with Boolean values.
See Choose Data Item Metadata for more information on selecting metadata.
TCP-specific metadata included:
- Host name - Edge Delta agent hostname
- Host IP - Edge Delta agent IP address
- Server port - Port connector is listening on
- Service name - Service identifier
- Source name - Connector instance name
- Source type - TCP connector type
Metadata Level (Attributes)
Additional attribute-level metadata fields to include.
Default: ed.env.id
Rate Limit
The rate_limit parameter enables you to control data ingestion based on system resource usage. This advanced setting helps prevent source nodes from overwhelming the agent by automatically throttling or stopping data collection when CPU or memory thresholds are exceeded.
Use rate limiting to prevent runaway log collection from overwhelming the agent in high-volume sources, protect agent stability in resource-constrained environments with limited CPU/memory, automatically throttle during bursty traffic patterns, and ensure fair resource allocation across source nodes in multi-tenant deployments.
When rate limiting triggers, pull-based sources (File, S3, HTTP Pull) stop fetching new data, push-based sources (HTTP, TCP, UDP, OTLP) reject incoming data, and stream-based sources (Kafka, Pub/Sub) pause consumption. Rate limiting operates at the source node level, where each source with rate limiting enabled independently monitors and enforces its own thresholds.
Rate limiting vs backpressure: Rate limiting and backpressure are different mechanisms. Rate limiting controls data ingestion at the source based on CPU or memory thresholds. Backpressure controls data output at the destination when in-memory queues fill up. Backpressure logs such as
backpressure: dataCh at 92% capacitydo not appear when rate limiting triggers, and rate limiting logs do not appear during backpressure events.
Observability: When rate limiting is active in enforce mode, the agent does not produce INFO, WARN, or ERROR level logs. To confirm that rate limiting is triggering, check the source node’s Bytes I/O metrics in the Edge Delta app for gaps or drops that coincide with expected throttling periods.
Configuration Steps:
- Click Add New in the Rate Limit section
- Click Add New for Evaluation Policy
- Select Policy Type:
- CPU Usage: Monitors CPU consumption and rate limits when usage exceeds defined thresholds. Use for CPU-intensive sources like file parsing or complex transformations.
- Memory Usage: Monitors memory consumption and rate limits when usage exceeds defined thresholds. Use for memory-intensive sources like large message buffers or caching.
- AND (composite): Combines multiple sub-policies with AND logic. All sub-policies must be true simultaneously to trigger rate limiting. Use when you want conservative rate limiting (both CPU and memory must be high).
- OR (composite): Combines multiple sub-policies with OR logic. Any sub-policy can trigger rate limiting. Use when you want aggressive rate limiting (either CPU or memory being high triggers).
- Select Evaluation Mode. Choose how the policy behaves when thresholds are exceeded:
- Enforce (default): Actively applies rate limiting when thresholds are met. Pull-based sources (File, S3, HTTP Pull) stop fetching new data, push-based sources (HTTP, TCP, UDP, OTLP) reject incoming data, and stream-based sources (Kafka, Pub/Sub) pause consumption. Use in production to protect agent resources.
- Monitor: Logs when rate limiting would occur without actually limiting data flow. Use for testing thresholds before enforcing them in production.
- Passthrough: Disables rate limiting entirely while keeping the configuration in place. Use to temporarily disable rate limiting without removing configuration.
- Set Absolute Limits and Relative Limits (for CPU Usage and Memory Usage policies)
Note: If you specify both absolute and relative limits, the system evaluates both conditions and rate limiting triggers when either condition is met (OR logic). For example, if you set absolute limit to
1.0CPU cores and relative limit to50%, rate limiting triggers when the source uses either 1 full core OR 50% of available CPU, whichever happens first.
For CPU Absolute Limits: Enter value in full core units:
0.1= one-tenth of a CPU core0.5= half a CPU core1.0= one full CPU core2.0= two full CPU cores
For CPU Relative Limits: Enter percentage of total available CPU (0-100):
50= 50% of available CPU75= 75% of available CPU85= 85% of available CPU
For Memory Absolute Limits: Enter value in bytes
104857600= 100Mi (100 × 1024 × 1024)536870912= 512Mi (512 × 1024 × 1024)1073741824= 1Gi (1 × 1024 × 1024 × 1024)
For Memory Relative Limits: Enter percentage of total available memory (0-100)
60= 60% of available memory75= 75% of available memory80= 80% of available memory
- Set Refresh Interval (for CPU Usage and Memory Usage policies). Specify how frequently the system checks resource usage:
- Recommended Values:
10sto30sfor most use cases5sto10sfor high-volume sources requiring quick response1mor higher for stable, low-volume sources
The system fetches current CPU/memory usage at the specified refresh interval and uses that value for evaluation until the next refresh. Shorter intervals provide more responsive rate limiting but incur slightly higher overhead, while longer intervals are more efficient but slower to react to sudden resource spikes.
The GUI generates YAML as follows:
# Simple CPU-based rate limiting
nodes:
  - name: <node name>
    type: <node type>
    rate_limit:
      evaluation_policy:
        policy_type: cpu_usage
        evaluation_mode: enforce
        absolute_limit: 0.5  # Limit to half a CPU core
        refresh_interval: 10s
# Simple memory-based rate limiting
nodes:
  - name: <node name>
    type: <node type>
    rate_limit:
      evaluation_policy:
        policy_type: memory_usage
        evaluation_mode: enforce
        absolute_limit: 536870912  # 512Mi in bytes
        refresh_interval: 30s
Composite Policies (AND / OR)
When using AND or OR policy types, you define sub-policies instead of limits. Sub-policies must be siblings (at the same level)—do not nest sub-policies within other sub-policies. Each sub-policy is independently evaluated, and the parent policy’s evaluation mode applies to the composite result.
- AND Logic: All sub-policies must evaluate to true at the same time to trigger rate limiting. Use when you want conservative rate limiting (limit only when CPU AND memory are both high).
- OR Logic: Any sub-policy evaluating to true triggers rate limiting. Use when you want aggressive protection (limit when either CPU OR memory is high).
Configuration Steps:
- Select AND (composite) or OR (composite) as the Policy Type
- Choose the Evaluation Mode (typically Enforce)
- Click Add New under Sub-Policies to add the first condition
- Configure the first sub-policy by selecting policy type (CPU Usage or Memory Usage), selecting evaluation mode, setting absolute and/or relative limits, and setting refresh interval
- In the parent policy (not within the child), click Add New again to add a sibling sub-policy
- Configure additional sub-policies following the same pattern
The GUI generates YAML as follows:
# AND composite policy - both CPU AND memory must exceed limits
nodes:
  - name: <node name>
    type: <node type>
    rate_limit:
      evaluation_policy:
        policy_type: and
        evaluation_mode: enforce
        sub_policies:
          # First sub-policy (sibling)
          - policy_type: cpu_usage
            evaluation_mode: enforce
            absolute_limit: 0.75  # Limit to 75% of one core
            refresh_interval: 15s
          # Second sub-policy (sibling)
          - policy_type: memory_usage
            evaluation_mode: enforce
            absolute_limit: 1073741824  # 1Gi in bytes
            refresh_interval: 15s
# OR composite policy - either CPU OR memory can trigger
nodes:
  - name: <node name>
    type: <node type>
    rate_limit:
      evaluation_policy:
        policy_type: or
        evaluation_mode: enforce
        sub_policies:
          - policy_type: cpu_usage
            evaluation_mode: enforce
            relative_limit: 85  # 85% of available CPU
            refresh_interval: 20s
          - policy_type: memory_usage
            evaluation_mode: enforce
            relative_limit: 80  # 80% of available memory
            refresh_interval: 20s
# Monitor mode for testing thresholds
nodes:
  - name: <node name>
    type: <node type>
    rate_limit:
      evaluation_policy:
        policy_type: memory_usage
        evaluation_mode: monitor  # Only logs, doesn't limit
        relative_limit: 70  # Test at 70% before enforcing
        refresh_interval: 30s
How to Use the TCP Connector
The TCP connector integrates seamlessly with AI Team, enabling data ingestion from TCP-capable sources. AI teammates automatically leverage TCP-ingested data to analyze application logs, investigate errors, monitor custom metrics, and track real-time events from distributed systems.
Use Case: Application Log Streaming
Collect logs from applications using TCP logging libraries (log4j, logback, winston) for real-time error detection. Applications send logs via TCP ensuring guaranteed delivery. AI teammates analyze application errors, identify patterns, and provide troubleshooting insights without manual log searching.
Configuration:
- Port:
5140 - Listen:
0.0.0.0 - Read Timeout:
1m
Application Configuration (Python):
import socket
import logging

# Configure logging to send to TCP
handler = logging.handlers.SocketHandler('edge-delta-host', 5140)
logger.addHandler(handler)
logger.error("Application error occurred")
Use Case: Custom Metrics Collection
Ingest custom metrics from monitoring agents via TCP for performance analysis. Monitoring agents send metrics as newline-delimited JSON over TCP. AI teammates track performance trends, identify anomalies, and correlate metrics with infrastructure events.
Configuration:
- Port:
9514 - Listen:
0.0.0.0 - Read Timeout:
30s - Custom Tags:
environment: production
Metrics Sender (Shell):
echo '{"metric":"cpu_usage","value":75.3,"timestamp":1696176000}' | nc edge-delta-host 9514
Use Case: Centralized Log Aggregation
Aggregate logs from multiple servers using rsyslog or fluentd forwarding via TCP. Servers forward logs to Edge Delta TCP endpoint for centralized analysis. AI teammates provide unified visibility across distributed infrastructure, detecting issues spanning multiple servers.
Configuration:
- Port:
5140 - Listen:
0.0.0.0 - Read Timeout:
2m - TLS: Enabled
rsyslog Configuration:
*.* @@edge-delta-host:5140
Troubleshooting
Connection refused errors: Verify Edge Delta listening on port with netstat -tln | grep 8080. Check connector deployed to target environment. Test connectivity with telnet edge-delta-host 8080. Review firewall rules allow inbound TCP traffic on configured port. Ensure listen address set to 0.0.0.0 for remote connections.
Clients connect but no data appears: Verify clients sending data after establishing connection. Check message delimiter matches client output format (newline vs custom). Review Edge Delta logs for parsing errors. Test with simple echo "test" | nc edge-delta-host 8080. Ensure read timeout not too short for client send rate.
Connections timing out: Increase read timeout for clients sending sparse data. Verify clients sending data within timeout period. Check network latency between clients and Edge Delta. Monitor for connection resets due to network issues. Ensure clients maintaining persistent connections not repeatedly reconnecting.
TLS handshake failures: Verify TLS configuration includes certificate and private key files. Check certificate valid, not expired, includes correct hostname. Ensure clients configured for TLS connections. Verify TLS version compatibility between clients and server. Check client CA configured if using mutual TLS. Review SSL errors in both client and Edge Delta logs.
Max connections exceeded: Increase max connections limit based on number of concurrent clients. Monitor connection count and patterns. Check for connection leaks where clients don’t close properly. Deploy multiple Edge Delta agents and distribute client connections. Implement connection pooling on client side.
Messages split incorrectly: Verify message delimiter matches client output format. Newline delimiter works for line-oriented logs. Use custom delimiter for non-standard formats. Check clients not embedding delimiter characters within messages. Test with known good data to verify parsing.
High memory usage: Reduce max connections to limit concurrent clients. Check for very large messages causing memory spikes. Monitor message size distribution. Implement rate limiting to control data volume. Increase agent resources if consistently high load.
Next Steps
- Learn about TCP source configuration for advanced pipeline integration and detailed configuration options
- Learn about Edge Delta MCP connector for querying TCP data
- Learn about UDP connector for connectionless data ingestion
- Learn about creating custom teammates that can use TCP data
For additional help, visit AI Team Support.