UDP Connector
Configure the UDP connector to receive logs, metrics, and telemetry data sent via UDP datagrams from applications, systems, and network devices for AI-powered analysis.
12 minute read
Overview
The UDP connector receives logs, metrics, and telemetry data sent via UDP (User Datagram Protocol) datagrams from applications, systems, and network devices. UDP is a connectionless protocol providing fire-and-forget message delivery with minimal overhead, ideal for high-volume, low-latency data ingestion where occasional packet loss is acceptable. Content streams into Edge Delta Pipelines for analysis by AI teammates through the Edge Delta MCP connector.
The connector acts as a UDP server, receiving and processing datagrams from monitoring agents, applications, network infrastructure, and IoT devices. It supports high-volume metrics (StatsD), application logs, network telemetry (NetFlow, sFlow), and sensor data with automatic format detection for JSON, plain text, and StatsD metrics.
When you add this streaming connector, it appears as a UDP source in your selected pipeline. AI teammates access this data by querying the Edge Delta backend with the Edge Delta MCP connector.
For comprehensive UDP source configuration details, see the UDP Source documentation.
Add the UDP Connector
To add the UDP connector, you configure Edge Delta to listen on a specified UDP port for incoming datagrams.
Prerequisites
Before configuring the connector, ensure you have:
- Edge Delta agent with network access to receive UDP traffic
- Firewall rules allowing inbound UDP traffic on chosen port
- Applications or systems ready to send data via UDP
- For ports below 1024, root/admin privileges (or use ports 1024+)
Configuration Steps
- Navigate to AI Team > Connectors in the Edge Delta application
- Find the UDP connector in Streaming Connectors
- Click the connector card
- Configure Port (3421 default or custom)
- Configure Listen address (default
0.0.0.0) - Configure Read Timeout (how long to wait for data)
- Optionally configure Advanced Settings for rate limiting
- Select a target environment
- Click Save
The connector deploys and begins listening for UDP datagrams.
Configuration Options
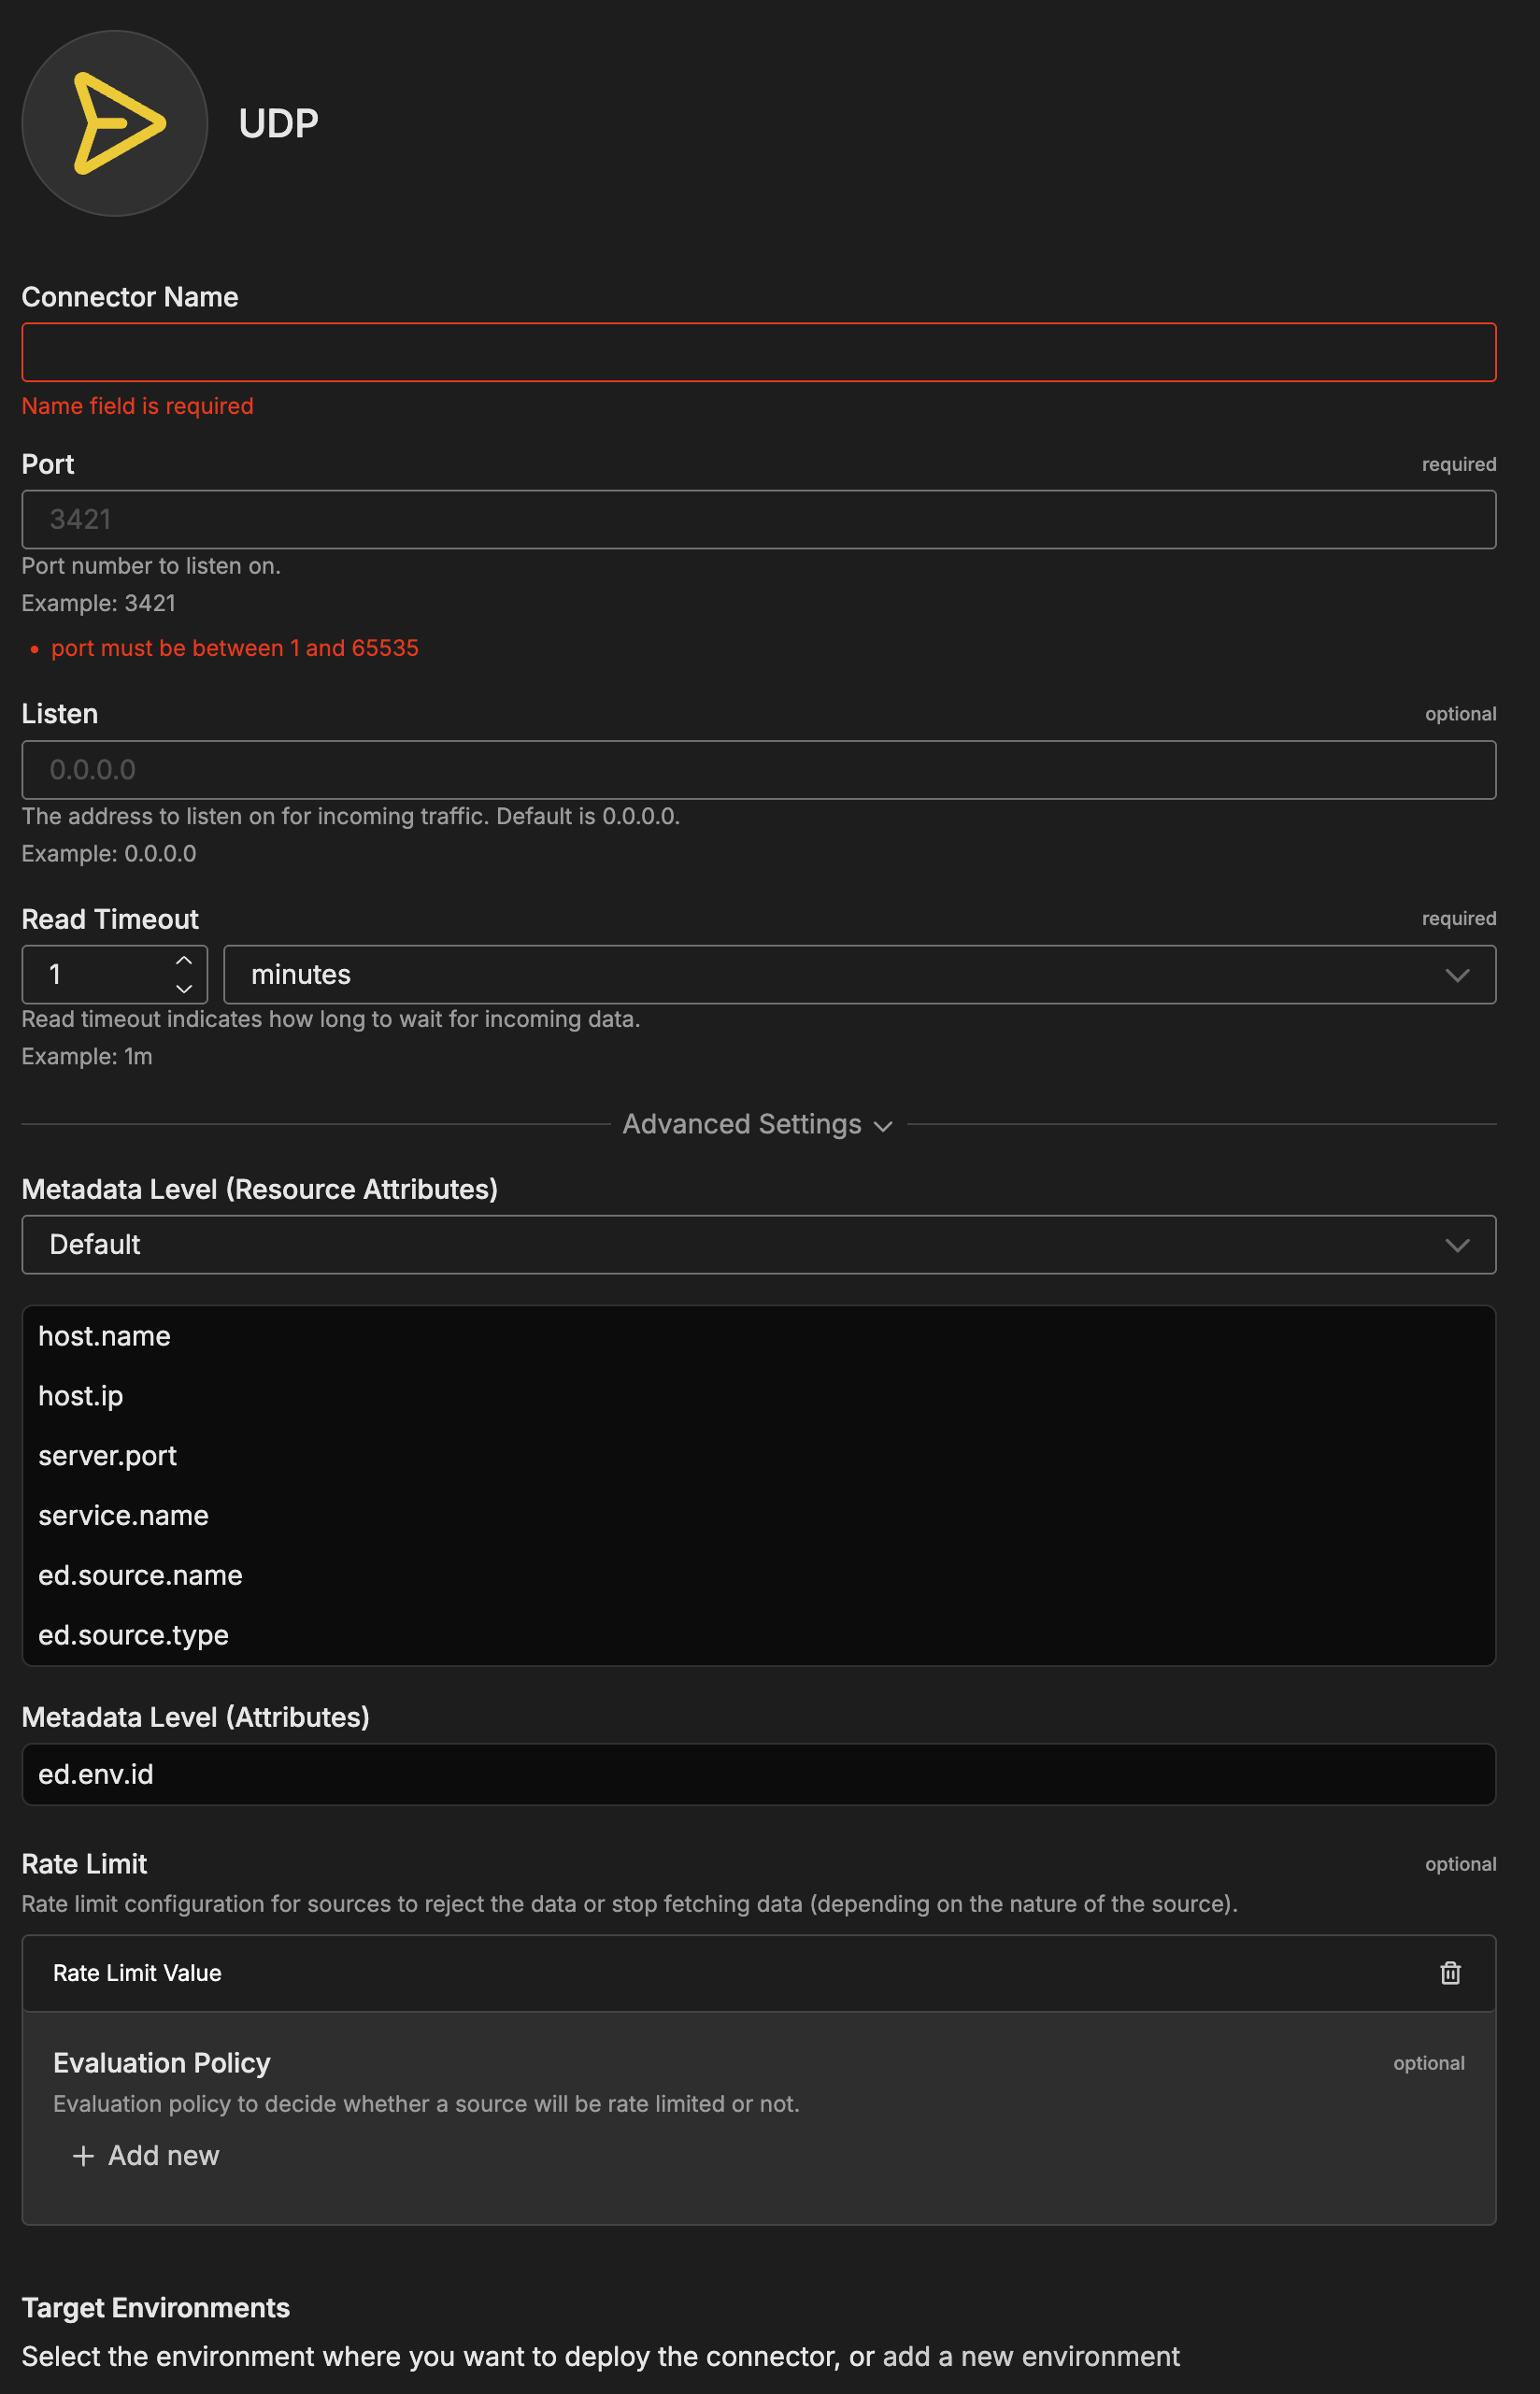
Connector Name
Name to identify this UDP connector instance.
Port
UDP port to listen on for incoming datagrams.
Format: Integer between 1 and 65535
Default: 3421
Examples:
514- Standard syslog port (requires root/admin)8125- StatsD metrics port9090- Custom metrics port (non-privileged)3421- Edge Delta default
Note: Ports below 1024 require root/admin privileges on Linux/Unix systems
Listen
IP address to bind to for listening.
Format: IPv4 address
Default: 0.0.0.0 (all interfaces)
Examples:
0.0.0.0- Listen on all network interfaces192.168.1.100- Listen only on specific interface127.0.0.1- Localhost only (testing)
Read Timeout
How long to wait for incoming data before timing out.
Format: Duration (seconds, minutes)
Default: 1m
Examples:
30s- 30 seconds for responsive sources1m- 1 minute typical timeout5m- 5 minutes for sparse streams
Purpose: Controls how long UDP socket waits for datagrams
Note: UDP is connectionless; timeout affects waiting period, not connection state
Advanced Settings
Metadata Level (Resource Attributes)
This option is used to define which detected resources and attributes to add to each data item as it is ingested by Edge Delta. You can select:
- Required Only: This option includes the minimum required resources and attributes for Edge Delta to operate.
- Default: This option includes the required resources and attributes plus those selected by Edge Delta
- High: This option includes the required resources and attributes along with a larger selection of common optional fields.
- Custom: With this option selected, you can choose which attributes and resources to include. The required fields are selected by default and can’t be unchecked.
Based on your selection in the GUI, the source_metadata YAML is populated as two dictionaries (resource_attributes and attributes) with Boolean values.
See Choose Data Item Metadata for more information on selecting metadata.
UDP-specific metadata included:
- Host name - Edge Delta agent hostname
- Host IP - Edge Delta agent IP address
- Server port - Port connector is listening on
- Service name - Service identifier
- Source name - Connector instance name
- Source type - UDP connector type
Network metadata (when enabled):
- Source IP address - Sender’s IP address
- Source port - Sender’s port number
Metadata Level (Attributes)
Additional attribute-level metadata fields to include.
Default: ed.env.id
Rate Limit
The rate_limit parameter enables you to control data ingestion based on system resource usage. This advanced setting helps prevent source nodes from overwhelming the agent by automatically throttling or stopping data collection when CPU or memory thresholds are exceeded.
Use rate limiting to prevent runaway log collection from overwhelming the agent in high-volume sources, protect agent stability in resource-constrained environments with limited CPU/memory, automatically throttle during bursty traffic patterns, and ensure fair resource allocation across source nodes in multi-tenant deployments.
When rate limiting triggers, pull-based sources (File, S3, HTTP Pull) stop fetching new data, push-based sources (HTTP, TCP, UDP, OTLP) reject incoming data, and stream-based sources (Kafka, Pub/Sub) pause consumption. Rate limiting operates at the source node level, where each source with rate limiting enabled independently monitors and enforces its own thresholds.
Rate limiting vs backpressure: Rate limiting and backpressure are different mechanisms. Rate limiting controls data ingestion at the source based on CPU or memory thresholds. Backpressure controls data output at the destination when in-memory queues fill up. Backpressure logs such as
backpressure: dataCh at 92% capacitydo not appear when rate limiting triggers, and rate limiting logs do not appear during backpressure events.
Observability: When rate limiting is active in enforce mode, the agent does not produce INFO, WARN, or ERROR level logs. To confirm that rate limiting is triggering, check the source node’s Bytes I/O metrics in the Edge Delta app for gaps or drops that coincide with expected throttling periods.
Configuration Steps:
- Click Add New in the Rate Limit section
- Click Add New for Evaluation Policy
- Select Policy Type:
- CPU Usage: Monitors CPU consumption and rate limits when usage exceeds defined thresholds. Use for CPU-intensive sources like file parsing or complex transformations.
- Memory Usage: Monitors memory consumption and rate limits when usage exceeds defined thresholds. Use for memory-intensive sources like large message buffers or caching.
- AND (composite): Combines multiple sub-policies with AND logic. All sub-policies must be true simultaneously to trigger rate limiting. Use when you want conservative rate limiting (both CPU and memory must be high).
- OR (composite): Combines multiple sub-policies with OR logic. Any sub-policy can trigger rate limiting. Use when you want aggressive rate limiting (either CPU or memory being high triggers).
- Select Evaluation Mode. Choose how the policy behaves when thresholds are exceeded:
- Enforce (default): Actively applies rate limiting when thresholds are met. Pull-based sources (File, S3, HTTP Pull) stop fetching new data, push-based sources (HTTP, TCP, UDP, OTLP) reject incoming data, and stream-based sources (Kafka, Pub/Sub) pause consumption. Use in production to protect agent resources.
- Monitor: Logs when rate limiting would occur without actually limiting data flow. Use for testing thresholds before enforcing them in production.
- Passthrough: Disables rate limiting entirely while keeping the configuration in place. Use to temporarily disable rate limiting without removing configuration.
- Set Absolute Limits and Relative Limits (for CPU Usage and Memory Usage policies)
Note: If you specify both absolute and relative limits, the system evaluates both conditions and rate limiting triggers when either condition is met (OR logic). For example, if you set absolute limit to
1.0CPU cores and relative limit to50%, rate limiting triggers when the source uses either 1 full core OR 50% of available CPU, whichever happens first.
For CPU Absolute Limits: Enter value in full core units:
0.1= one-tenth of a CPU core0.5= half a CPU core1.0= one full CPU core2.0= two full CPU cores
For CPU Relative Limits: Enter percentage of total available CPU (0-100):
50= 50% of available CPU75= 75% of available CPU85= 85% of available CPU
For Memory Absolute Limits: Enter value in bytes
104857600= 100Mi (100 × 1024 × 1024)536870912= 512Mi (512 × 1024 × 1024)1073741824= 1Gi (1 × 1024 × 1024 × 1024)
For Memory Relative Limits: Enter percentage of total available memory (0-100)
60= 60% of available memory75= 75% of available memory80= 80% of available memory
- Set Refresh Interval (for CPU Usage and Memory Usage policies). Specify how frequently the system checks resource usage:
- Recommended Values:
10sto30sfor most use cases5sto10sfor high-volume sources requiring quick response1mor higher for stable, low-volume sources
The system fetches current CPU/memory usage at the specified refresh interval and uses that value for evaluation until the next refresh. Shorter intervals provide more responsive rate limiting but incur slightly higher overhead, while longer intervals are more efficient but slower to react to sudden resource spikes.
The GUI generates YAML as follows:
# Simple CPU-based rate limiting
nodes:
  - name: <node name>
    type: <node type>
    rate_limit:
      evaluation_policy:
        policy_type: cpu_usage
        evaluation_mode: enforce
        absolute_limit: 0.5  # Limit to half a CPU core
        refresh_interval: 10s
# Simple memory-based rate limiting
nodes:
  - name: <node name>
    type: <node type>
    rate_limit:
      evaluation_policy:
        policy_type: memory_usage
        evaluation_mode: enforce
        absolute_limit: 536870912  # 512Mi in bytes
        refresh_interval: 30s
Composite Policies (AND / OR)
When using AND or OR policy types, you define sub-policies instead of limits. Sub-policies must be siblings (at the same level)—do not nest sub-policies within other sub-policies. Each sub-policy is independently evaluated, and the parent policy’s evaluation mode applies to the composite result.
- AND Logic: All sub-policies must evaluate to true at the same time to trigger rate limiting. Use when you want conservative rate limiting (limit only when CPU AND memory are both high).
- OR Logic: Any sub-policy evaluating to true triggers rate limiting. Use when you want aggressive protection (limit when either CPU OR memory is high).
Configuration Steps:
- Select AND (composite) or OR (composite) as the Policy Type
- Choose the Evaluation Mode (typically Enforce)
- Click Add New under Sub-Policies to add the first condition
- Configure the first sub-policy by selecting policy type (CPU Usage or Memory Usage), selecting evaluation mode, setting absolute and/or relative limits, and setting refresh interval
- In the parent policy (not within the child), click Add New again to add a sibling sub-policy
- Configure additional sub-policies following the same pattern
The GUI generates YAML as follows:
# AND composite policy - both CPU AND memory must exceed limits
nodes:
  - name: <node name>
    type: <node type>
    rate_limit:
      evaluation_policy:
        policy_type: and
        evaluation_mode: enforce
        sub_policies:
          # First sub-policy (sibling)
          - policy_type: cpu_usage
            evaluation_mode: enforce
            absolute_limit: 0.75  # Limit to 75% of one core
            refresh_interval: 15s
          # Second sub-policy (sibling)
          - policy_type: memory_usage
            evaluation_mode: enforce
            absolute_limit: 1073741824  # 1Gi in bytes
            refresh_interval: 15s
# OR composite policy - either CPU OR memory can trigger
nodes:
  - name: <node name>
    type: <node type>
    rate_limit:
      evaluation_policy:
        policy_type: or
        evaluation_mode: enforce
        sub_policies:
          - policy_type: cpu_usage
            evaluation_mode: enforce
            relative_limit: 85  # 85% of available CPU
            refresh_interval: 20s
          - policy_type: memory_usage
            evaluation_mode: enforce
            relative_limit: 80  # 80% of available memory
            refresh_interval: 20s
# Monitor mode for testing thresholds
nodes:
  - name: <node name>
    type: <node type>
    rate_limit:
      evaluation_policy:
        policy_type: memory_usage
        evaluation_mode: monitor  # Only logs, doesn't limit
        relative_limit: 70  # Test at 70% before enforcing
        refresh_interval: 30s
How to Use the UDP Connector
The UDP connector integrates seamlessly with AI Team, enabling data ingestion from UDP-capable sources. AI teammates automatically leverage UDP-ingested data to analyze StatsD metrics, investigate application logs, monitor network telemetry, and track IoT sensor data.
Use Case: StatsD Metrics Collection
Collect StatsD metrics from distributed microservices for performance monitoring. Applications send counters, gauges, and timers via UDP to Edge Delta. AI teammates analyze performance trends, identify anomalies, and correlate metrics with application events without manual dashboard monitoring.
Configuration:
- Port:
8125 - Listen:
0.0.0.0 - Read Timeout:
30s
Application Configuration (Node.js):
const StatsD = require('node-statsd');
const client = new StatsD({
  host: 'edge-delta-host',
  port: 8125
});

client.increment('api.requests');
client.gauge('api.response_time', 245);
Use Case: High-Volume Application Logging
Ingest application logs in JSON format via UDP for low-latency centralized analysis. Applications send logs as UDP datagrams, avoiding TCP connection overhead. AI teammates provide real-time error detection and pattern analysis across distributed services.
Configuration:
- Port:
9090 - Listen:
0.0.0.0 - Read Timeout:
1m
Application Configuration (Python):
import socket
import json

sock = socket.socket(socket.AF_INET, socket.SOCK_DGRAM)
log_entry = json.dumps({
    "level": "error",
    "message": "Payment processing failed",
    "timestamp": "2025-10-08T12:00:00Z"
})
sock.sendto(log_entry.encode(), ('edge-delta-host', 9090))
Use Case: Network Device Telemetry
Receive network telemetry (NetFlow, sFlow) from switches and routers for infrastructure monitoring. Network devices send flow records via UDP. AI teammates analyze traffic patterns, detect bandwidth anomalies, and identify security threats from network behavior.
Configuration:
- Port:
6343 - Listen:
0.0.0.0 - Read Timeout:
2m
Device Configuration (sFlow):
# Cisco switch sFlow configuration
sflow destination 10.0.0.100 6343
sflow sampling-rate 1024
sflow counter-interval 20
Troubleshooting
No data received: Verify Edge Delta listening on port with netstat -uln | grep 3421. Test connectivity with echo "test" | nc -u edge-delta-host 3421. Check firewall rules allow inbound UDP traffic. Verify sender configured with correct destination IP and port. Remember UDP is connectionless; no connection establishment.
Packet loss or missing data: UDP doesn’t guarantee delivery. Check network congestion between sender and Edge Delta. Monitor packet loss with netstat -su (UDP statistics). Increase Edge Delta agent resources if CPU/memory saturated. Reduce send rate from applications. Deploy multiple Edge Delta agents and distribute load across them.
High latency in data processing: Monitor Edge Delta CPU and memory usage for resource bottlenecks. Check datagram size; very large packets may cause processing delays. Review pipeline processors for performance issues. Increase agent resources or deploy additional agents.
Datagrams truncated: UDP datagram size limited to 65KB maximum. Check sender not exceeding size limits. Monitor for fragmentation issues. Use TCP connector instead for large messages. Split large payloads into multiple datagrams on sender side.
Rate limiting dropping data: Adjust rate limit configuration based on actual traffic volume. Monitor dropped packet counts in Edge Delta metrics. Increase rate limit threshold if legitimate traffic being dropped. Deploy multiple agents to distribute load.
Format detection issues: Verify data sent in recognizable format (JSON, plain text, StatsD). Check for encoding issues or malformed data. Review Edge Delta logs for parsing errors. Test with known good data format. Ensure newline delimiters for multi-line messages.
Port binding errors: Check no other process using the port with netstat -uln | grep 3421. For ports below 1024, verify Edge Delta running with sufficient privileges. Try higher port numbers (1024+) for non-privileged operation. Ensure listen address valid and exists on system.
Next Steps
- Learn about UDP source configuration for advanced pipeline integration and detailed configuration options
- Learn about Edge Delta MCP connector for querying UDP data
- Learn about TCP connector for reliable, connection-oriented data ingestion
- Learn about creating custom teammates that can use UDP data
For additional help, visit AI Team Support.