Log Inventory
4 minute read
Overview
The Log Inventory enables you to take stock of your log traffic volume and size distribution across all pipelines and optimize your pipeline design accordingly. For example, you may discover a high volume service generating large logs that you are not interested in monitoring. You can easily filter or exclude those logs from your pipelines to reduce your environment’s processing and data handling overhead.
Inventory
Click the Logs page and select the Inventory tab to view the Log Inventory.
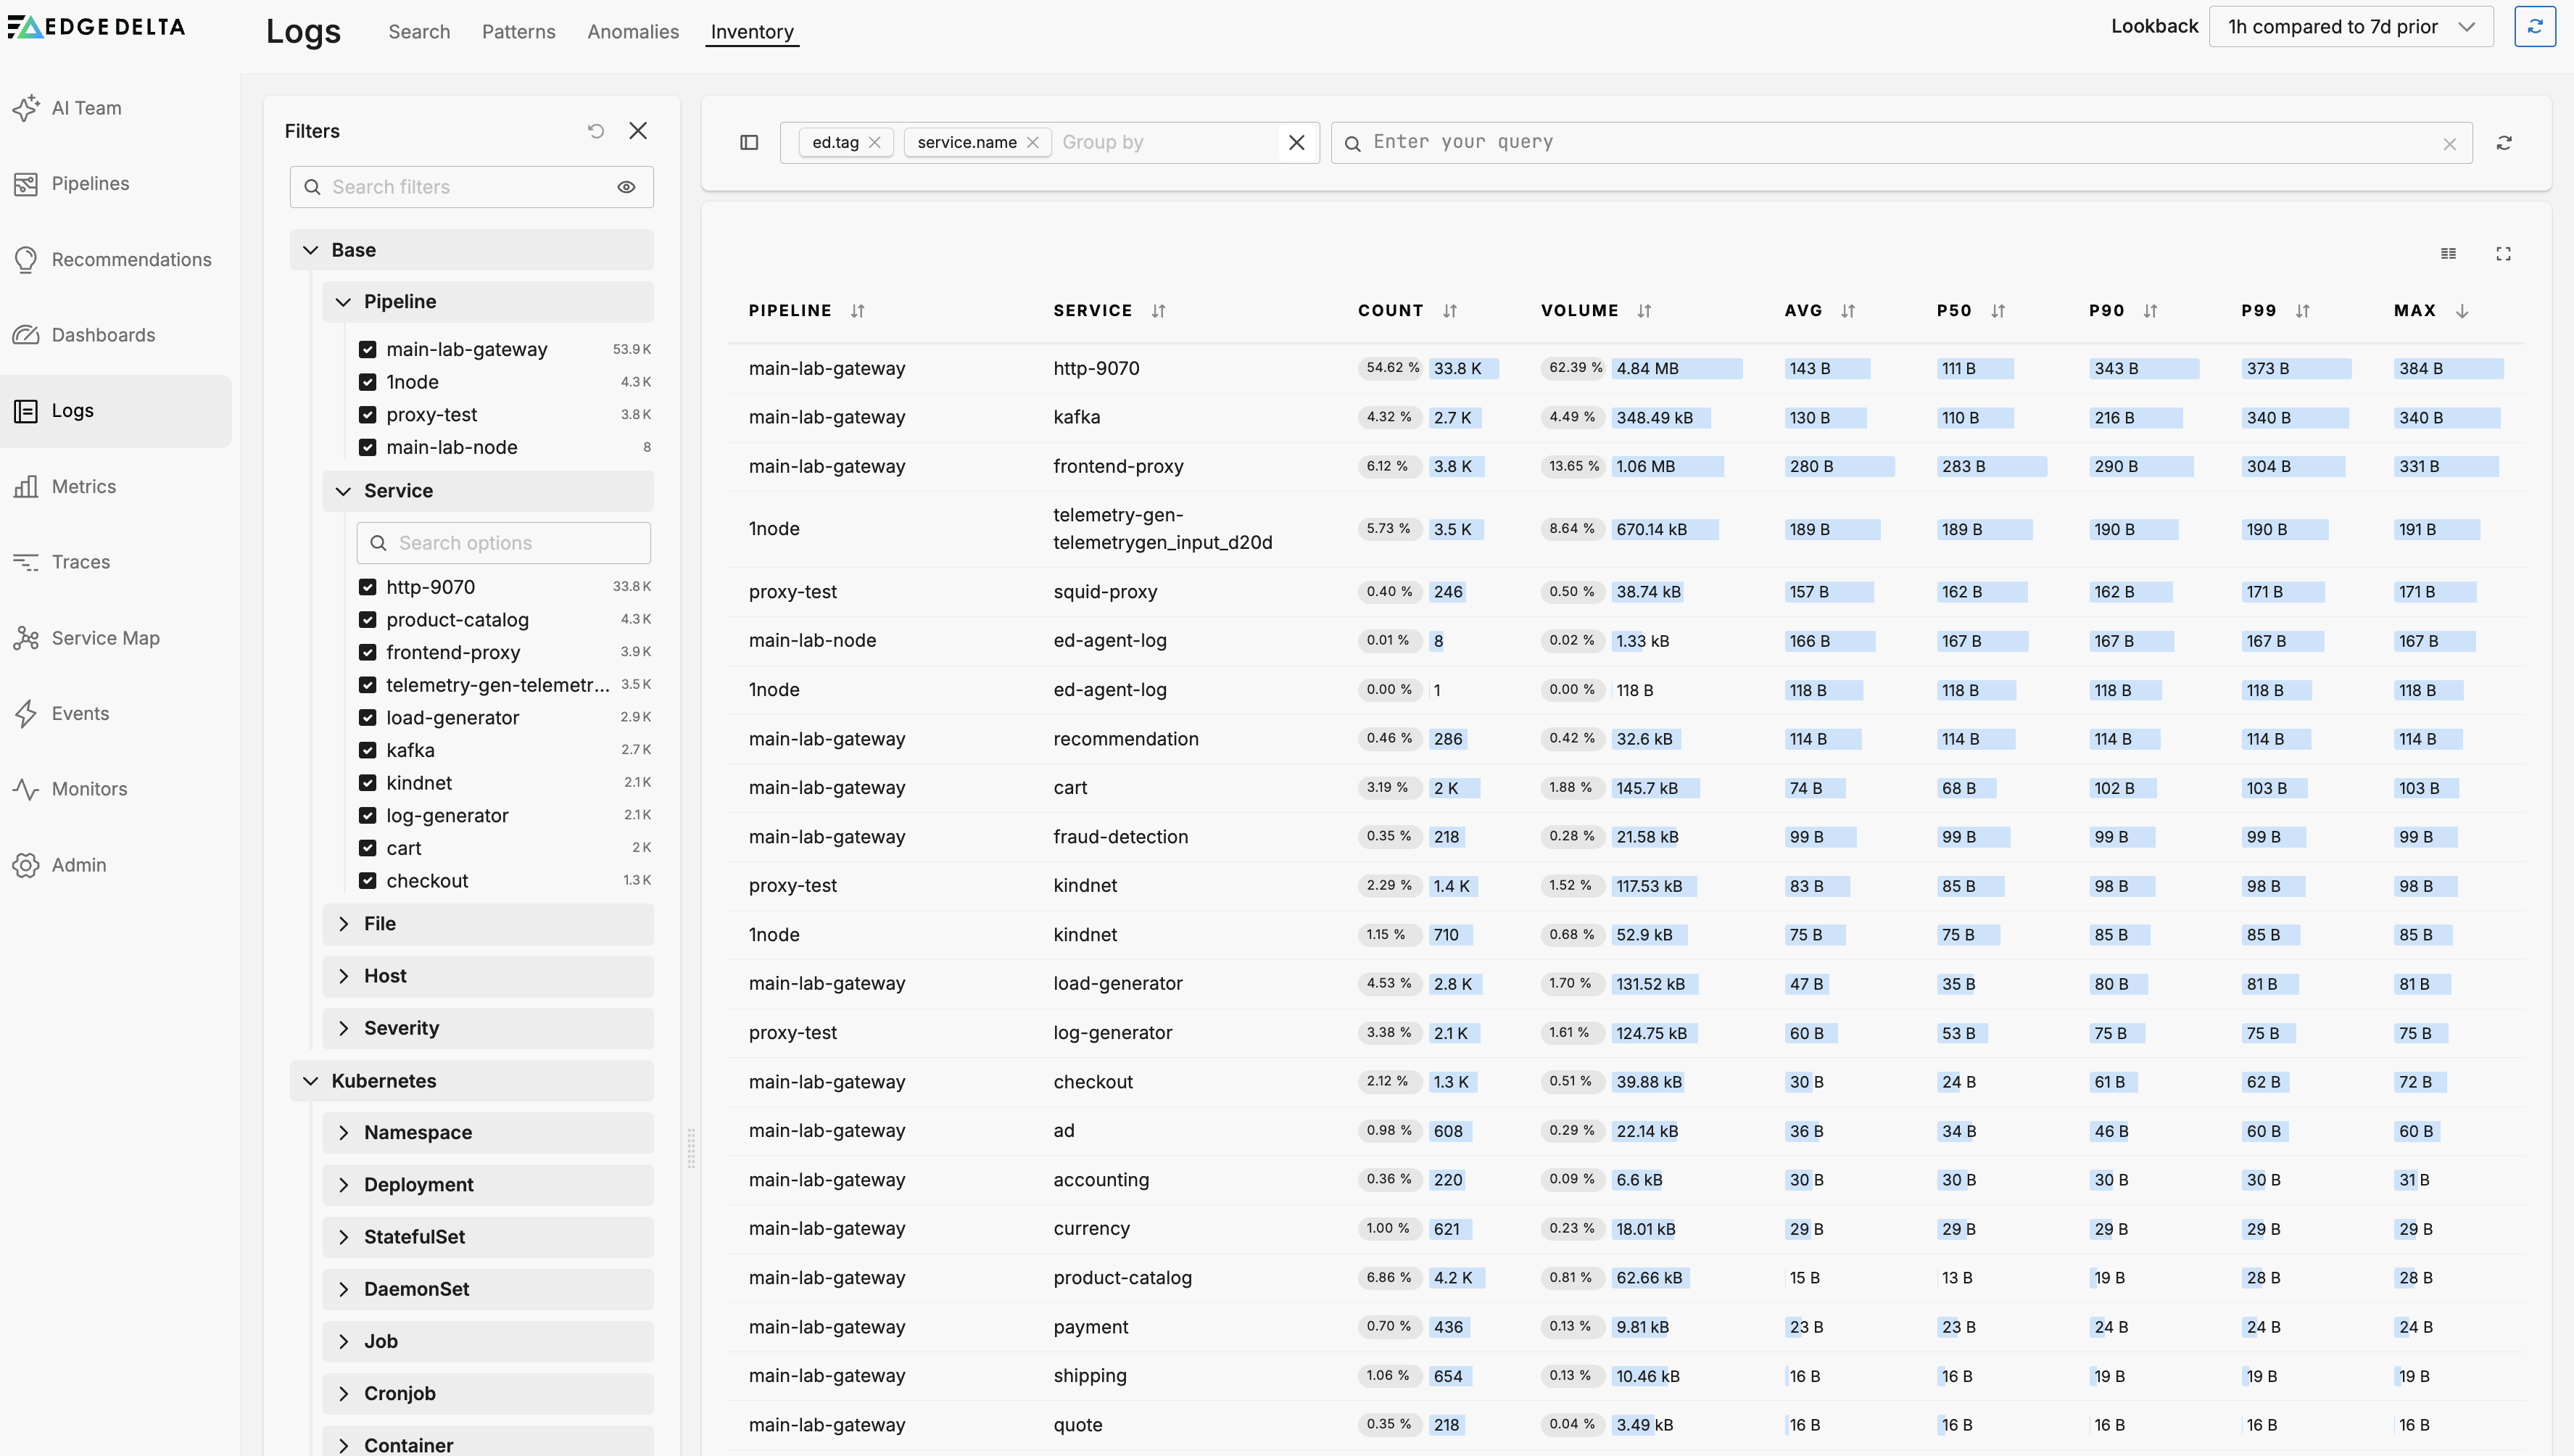
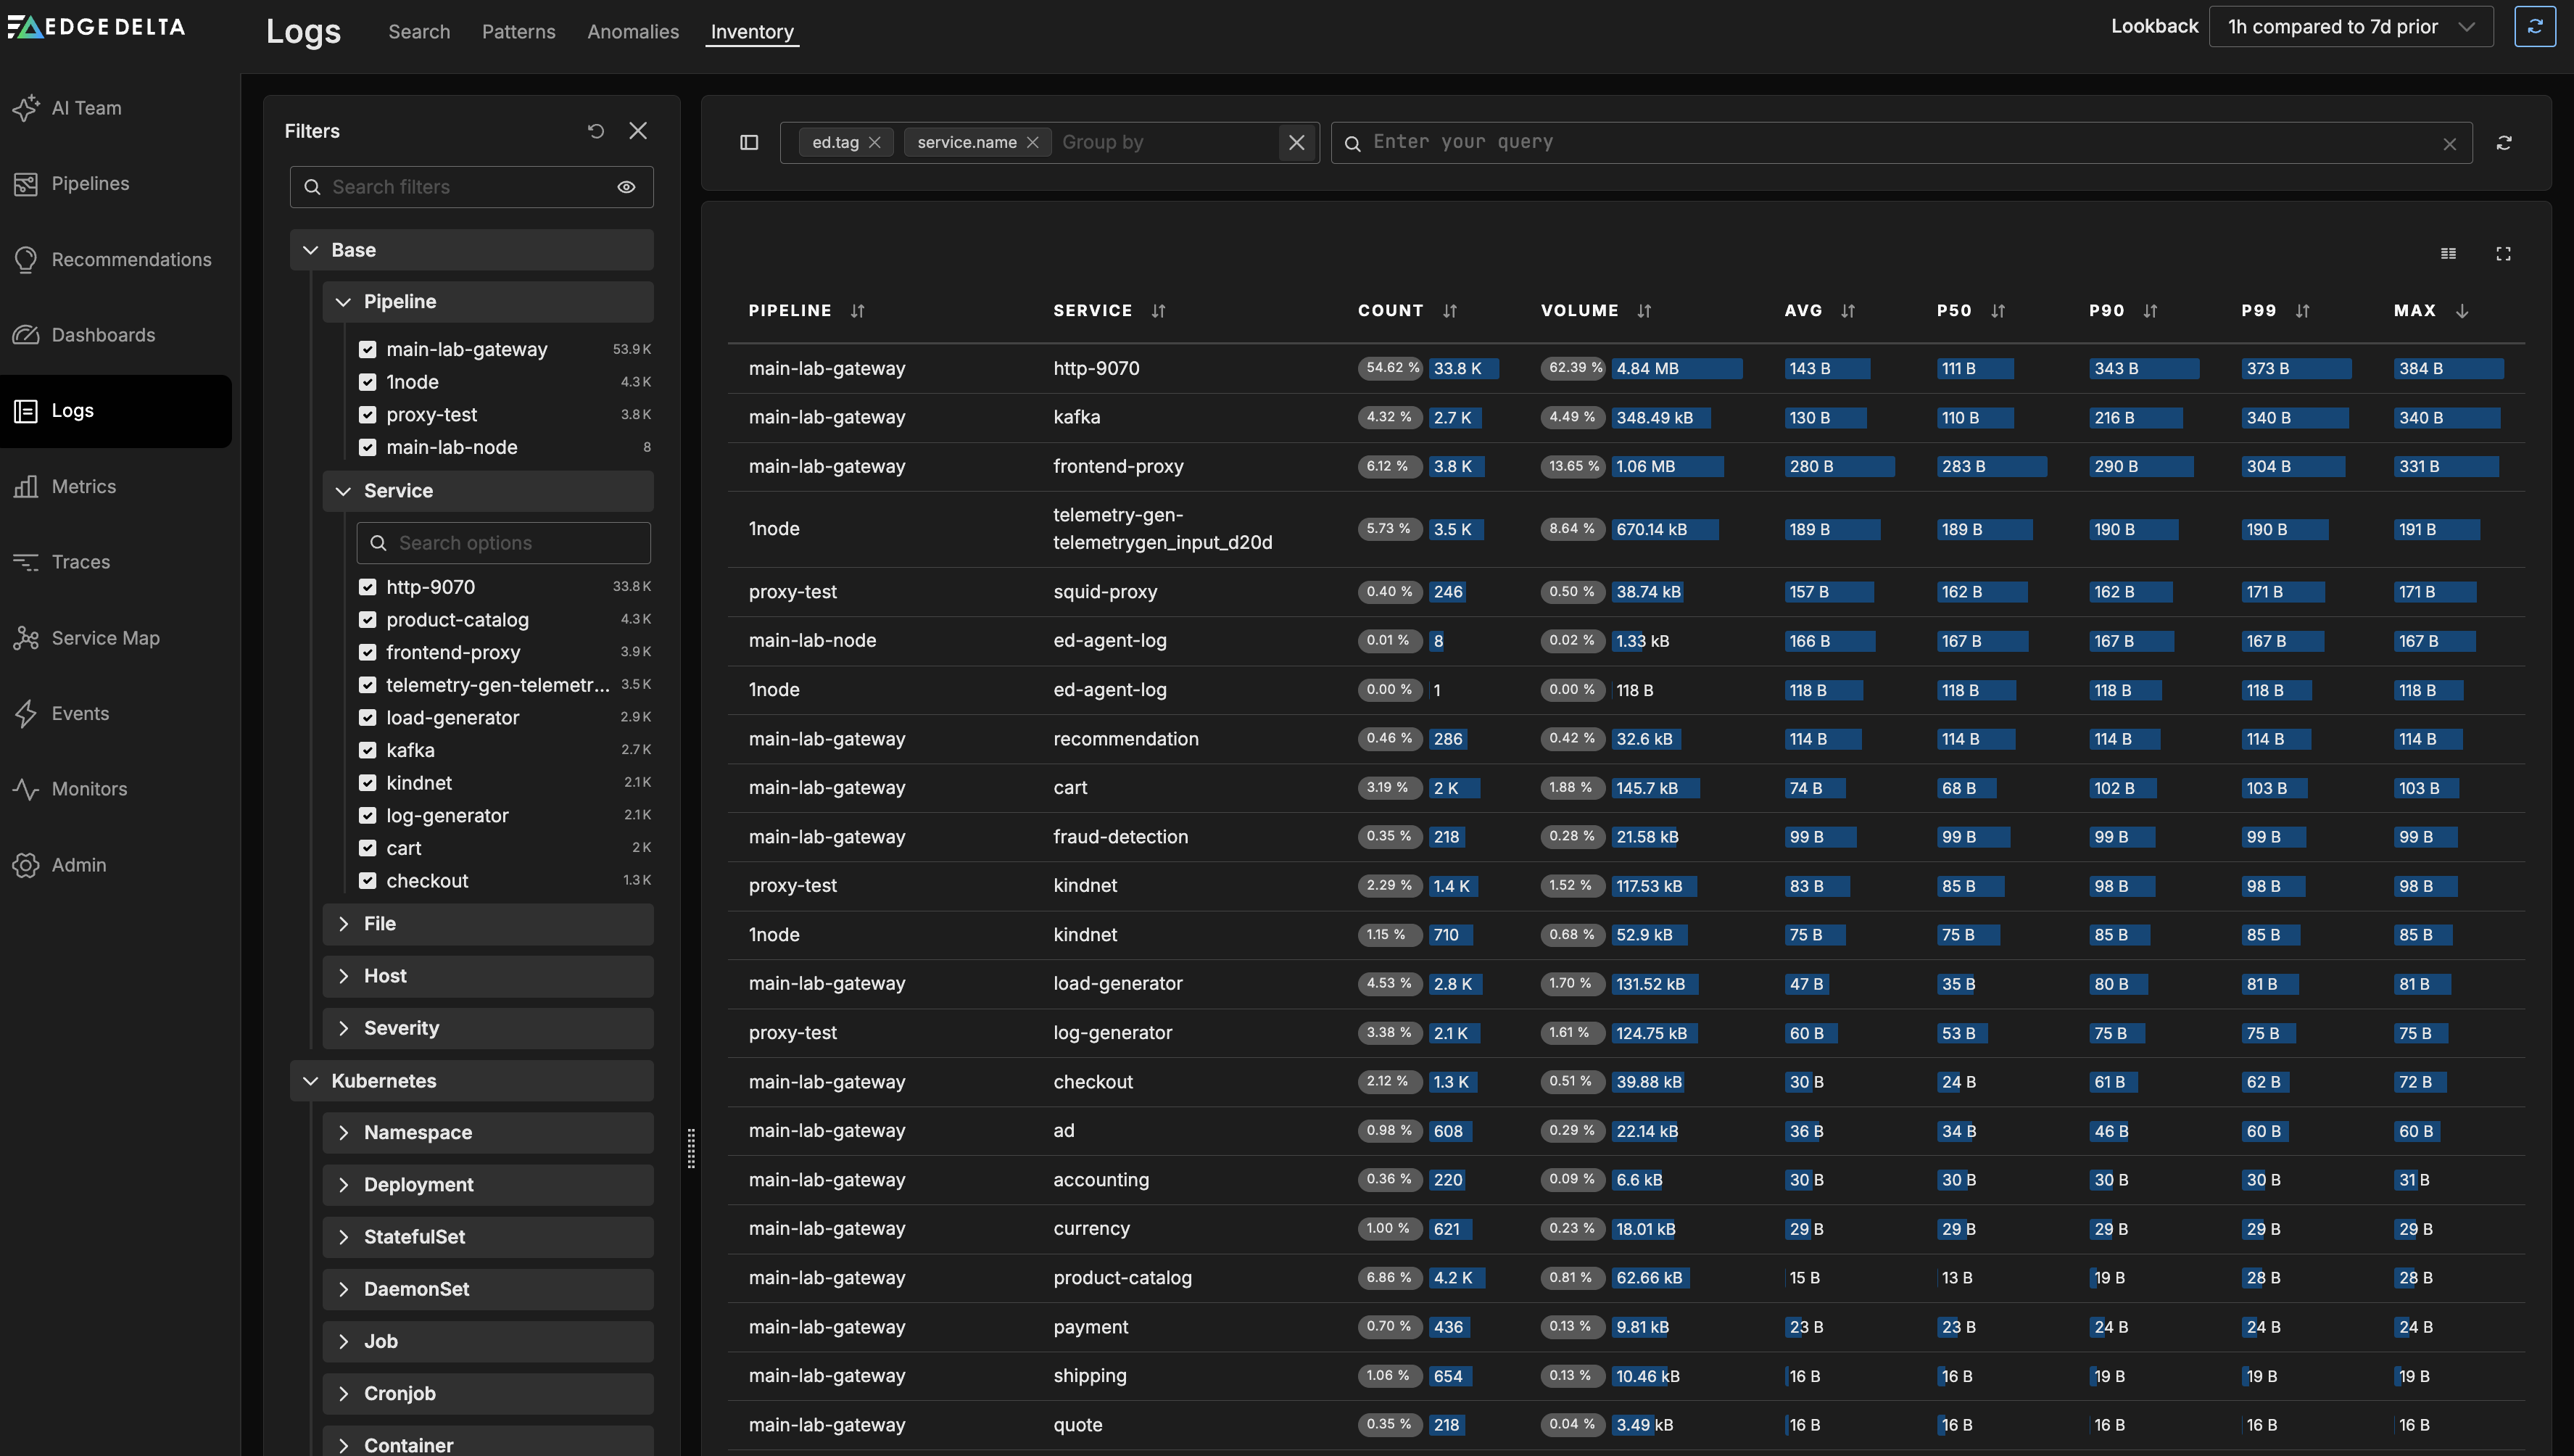
The Inventory displays a table with the following columns for all logs handled by your Edge Delta pipelines:
- Pipeline: The pipeline processing the logs
- Service: The service generating the logs
- Count: Total number of log entries
- Volume: Total data volume of logs
- Avg: Average log size
- P50: 50th percentile log size (median)
- P90: 90th percentile log size
- P99: 99th percentile log size
- Max: Maximum log size
This view helps you quickly identify which services are generating the most logs and understand the size distribution of those logs.
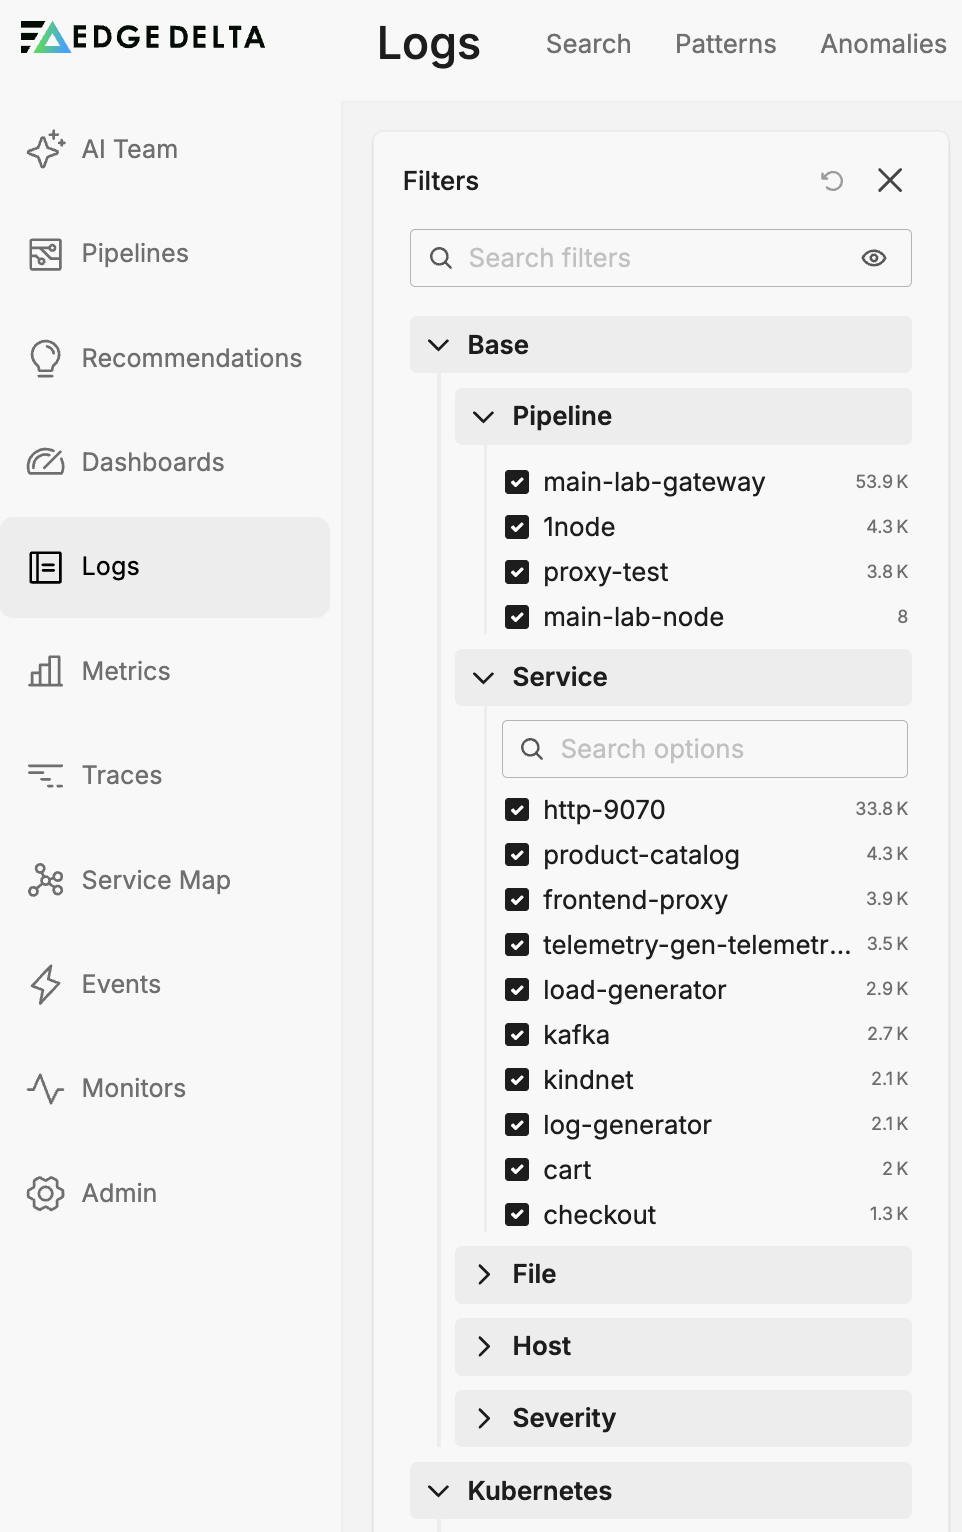
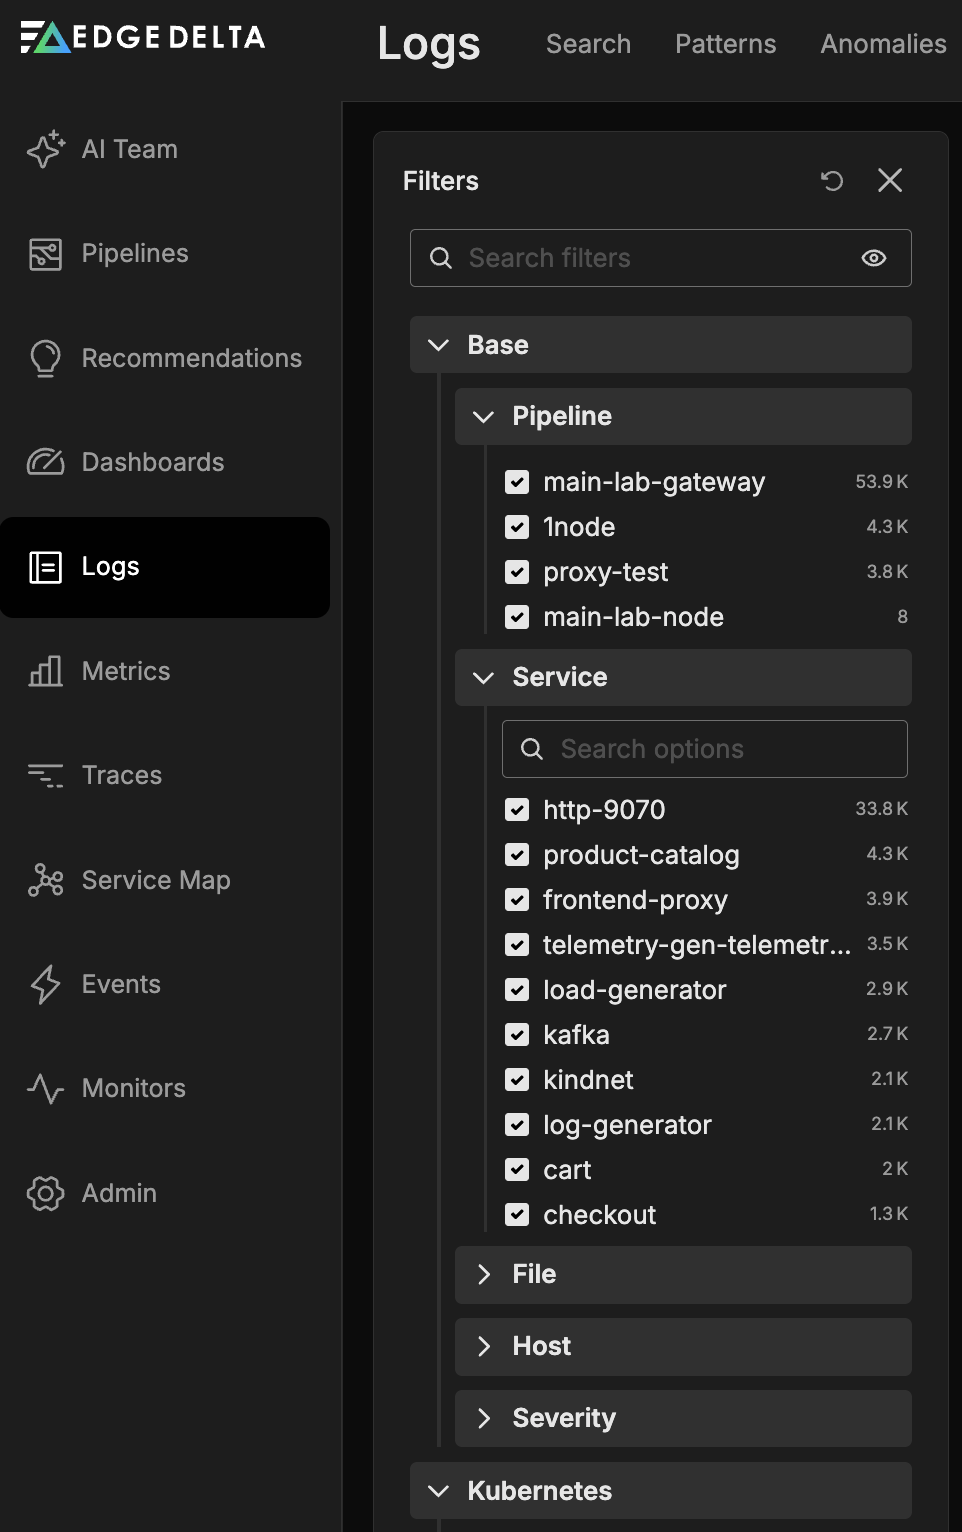
Filtering Logs
You can filter the log inventory using the filter pane or by entering a search query using CQL syntax. The filter pane provides the following options:
- Pipeline: Filter by specific pipelines
- Service: Filter by service name
- File: Filter by log file path
- Host: Filter by host name
- Severity: Filter by log severity level
- Kubernetes metadata: Filter by namespace, deployment, pod, container, and other Kubernetes attributes
- Amazon ECS metadata: Filter by ECS-specific attributes
- Docker metadata: Filter by Docker container attributes
- Trace metadata: Filter by trace attributes such as
service.name
To learn about optimizing facet usage for better performance, see Effectively Using Facets.
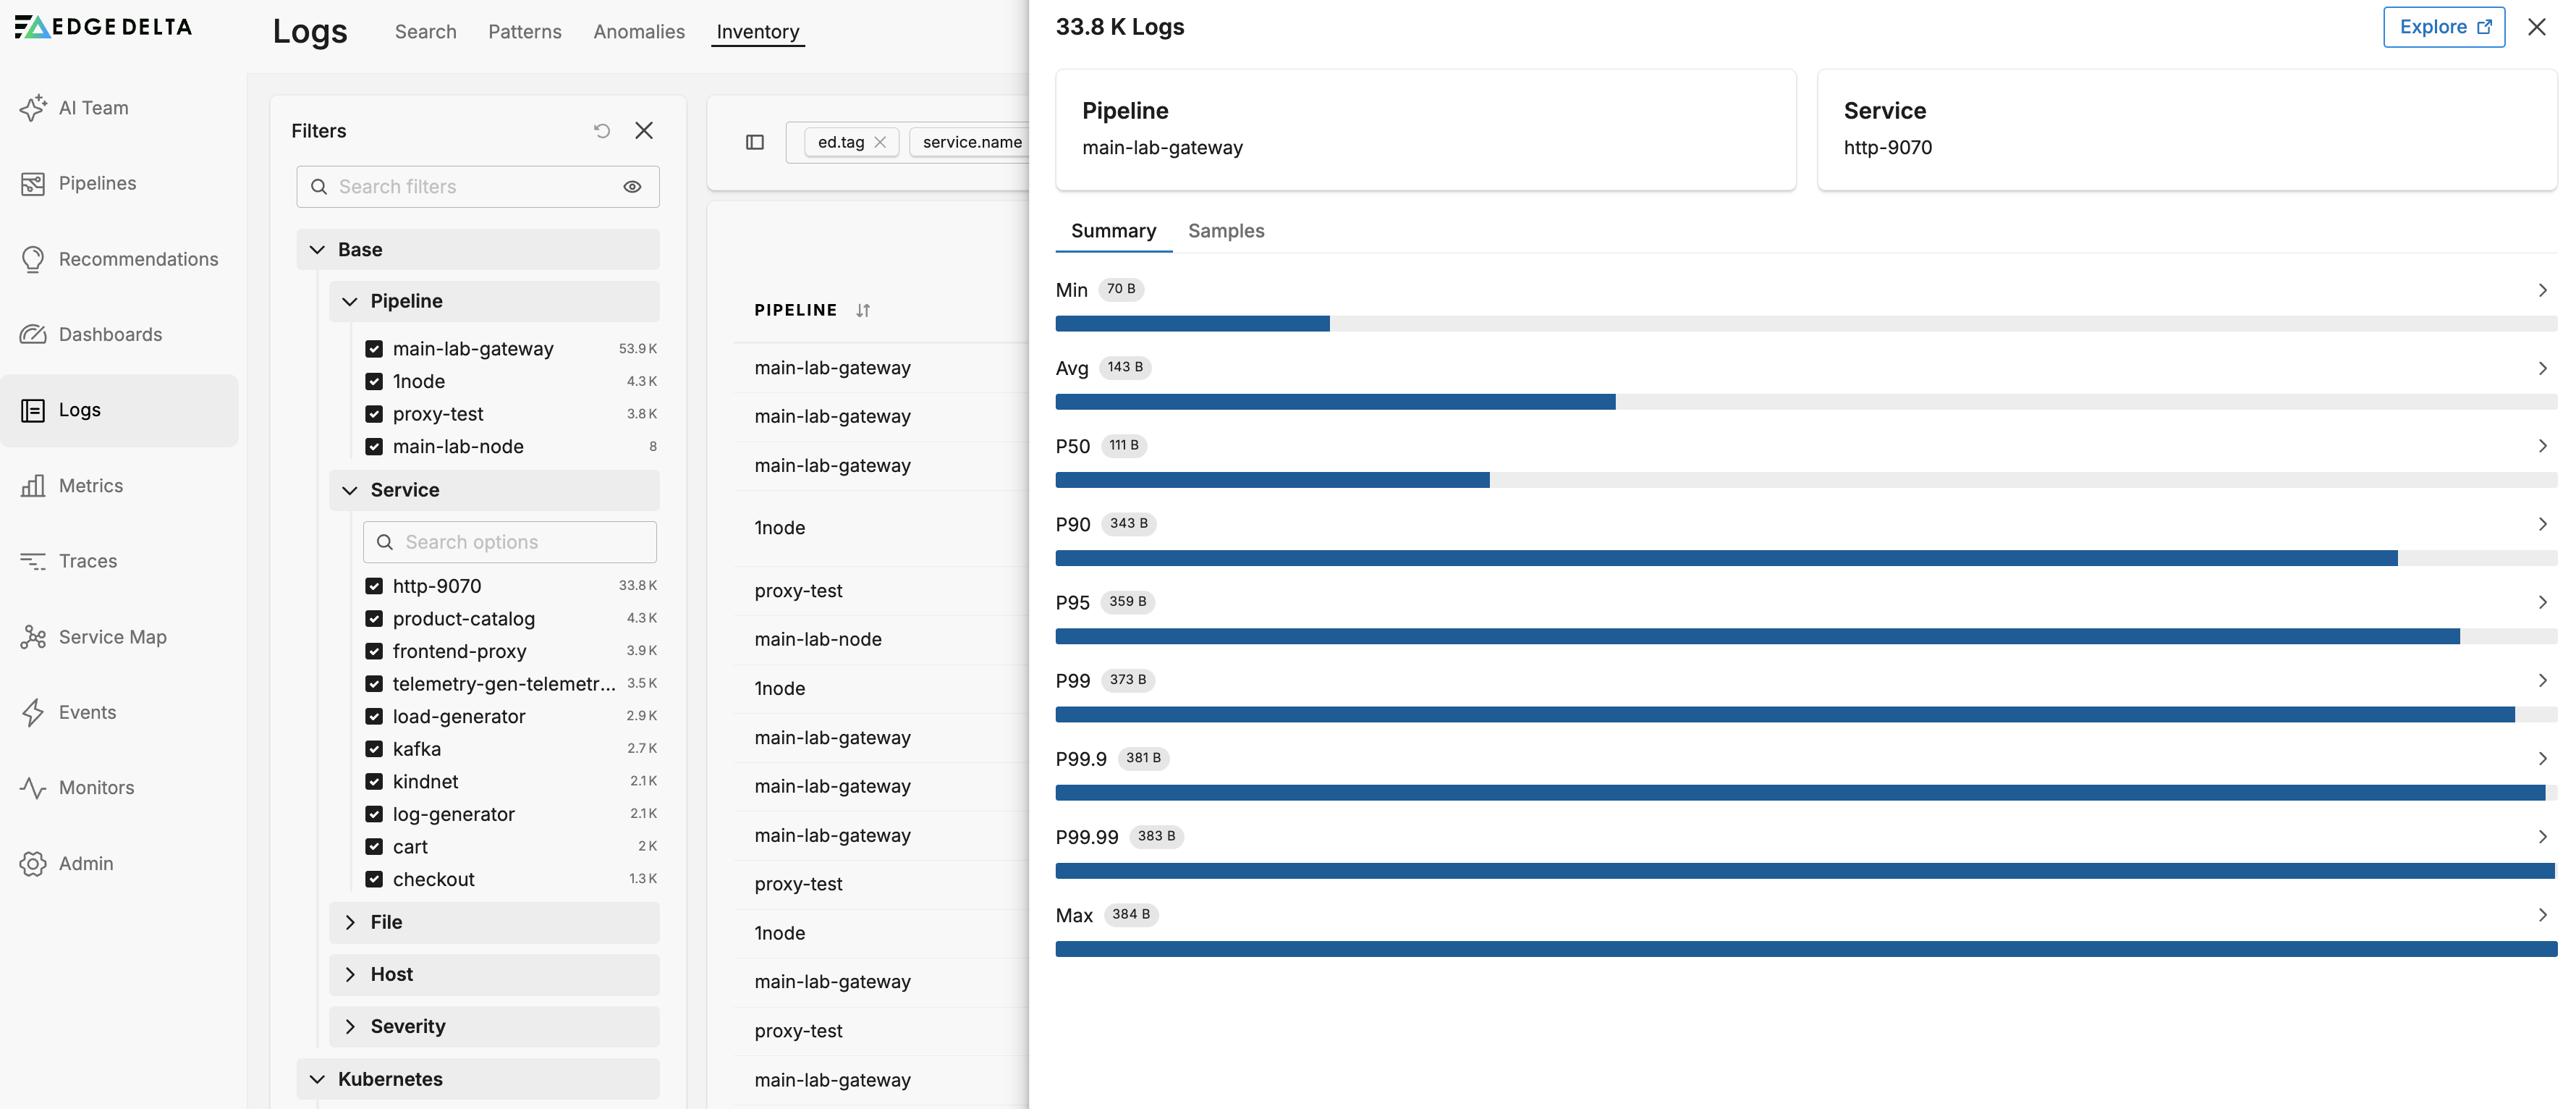
Viewing Log Details
Click a row in the inventory table to open the details pane, which contains two tabs:
Summary Tab
The Summary tab displays detailed size distribution statistics for the selected service:
- Min: Minimum log size
- Avg: Average log size
- P50: 50th percentile (median)
- P90: 90th percentile
- P95: 95th percentile
- P99: 99th percentile
- P99.9: 99.9th percentile
- P99.99: 99.99th percentile
- Max: Maximum log size

Samples Tab
The Samples tab lists actual log entries filtered by the same metrics context. Each sample includes the same percentile statistics shown in the Summary tab.
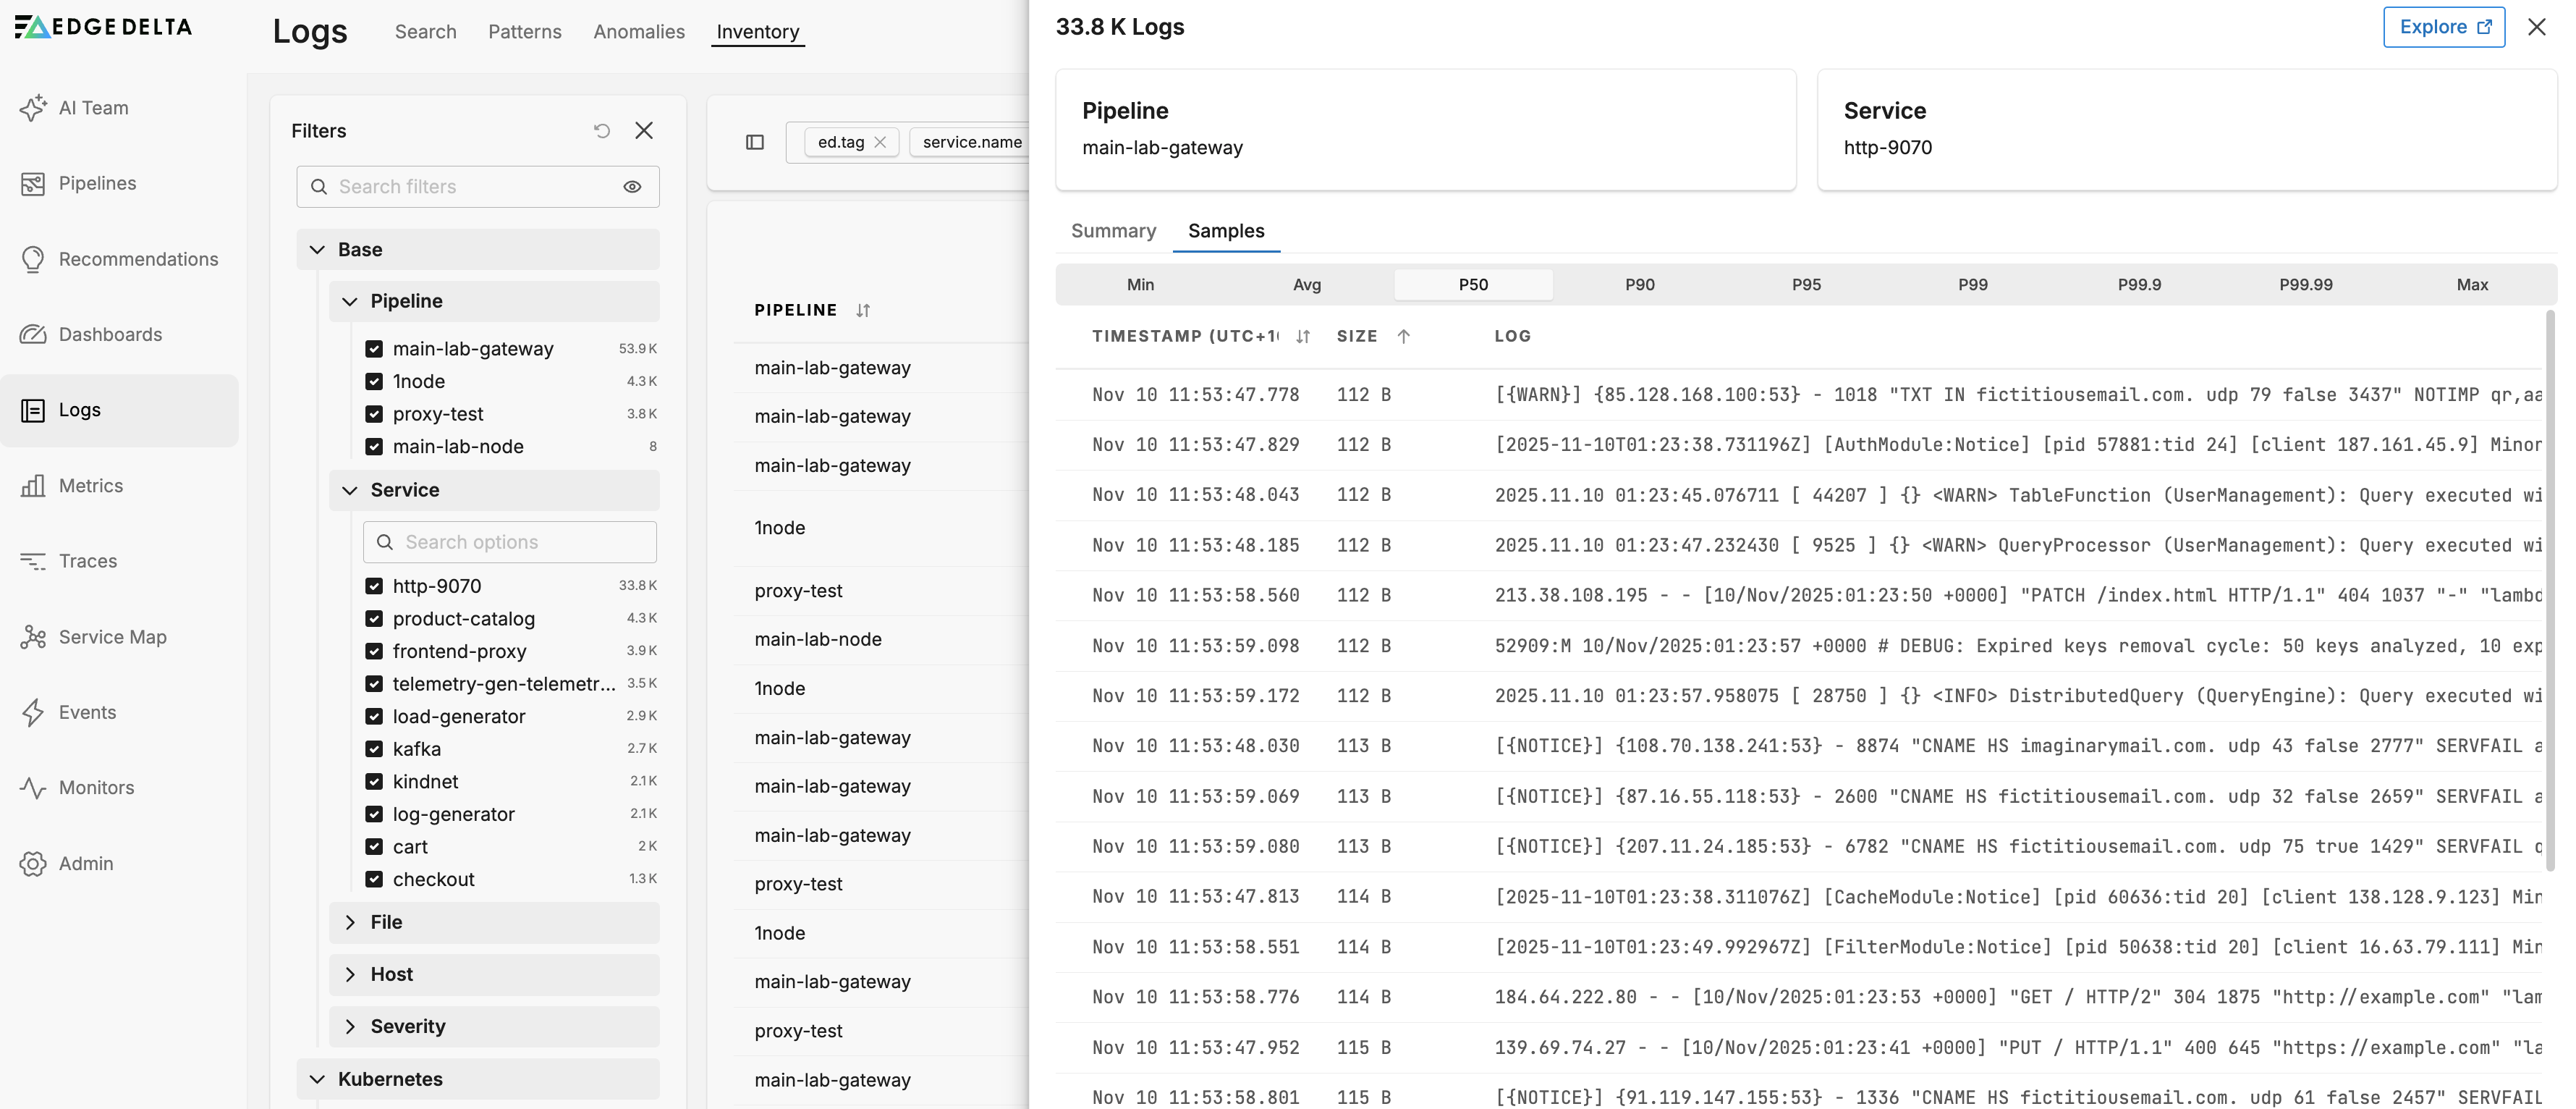
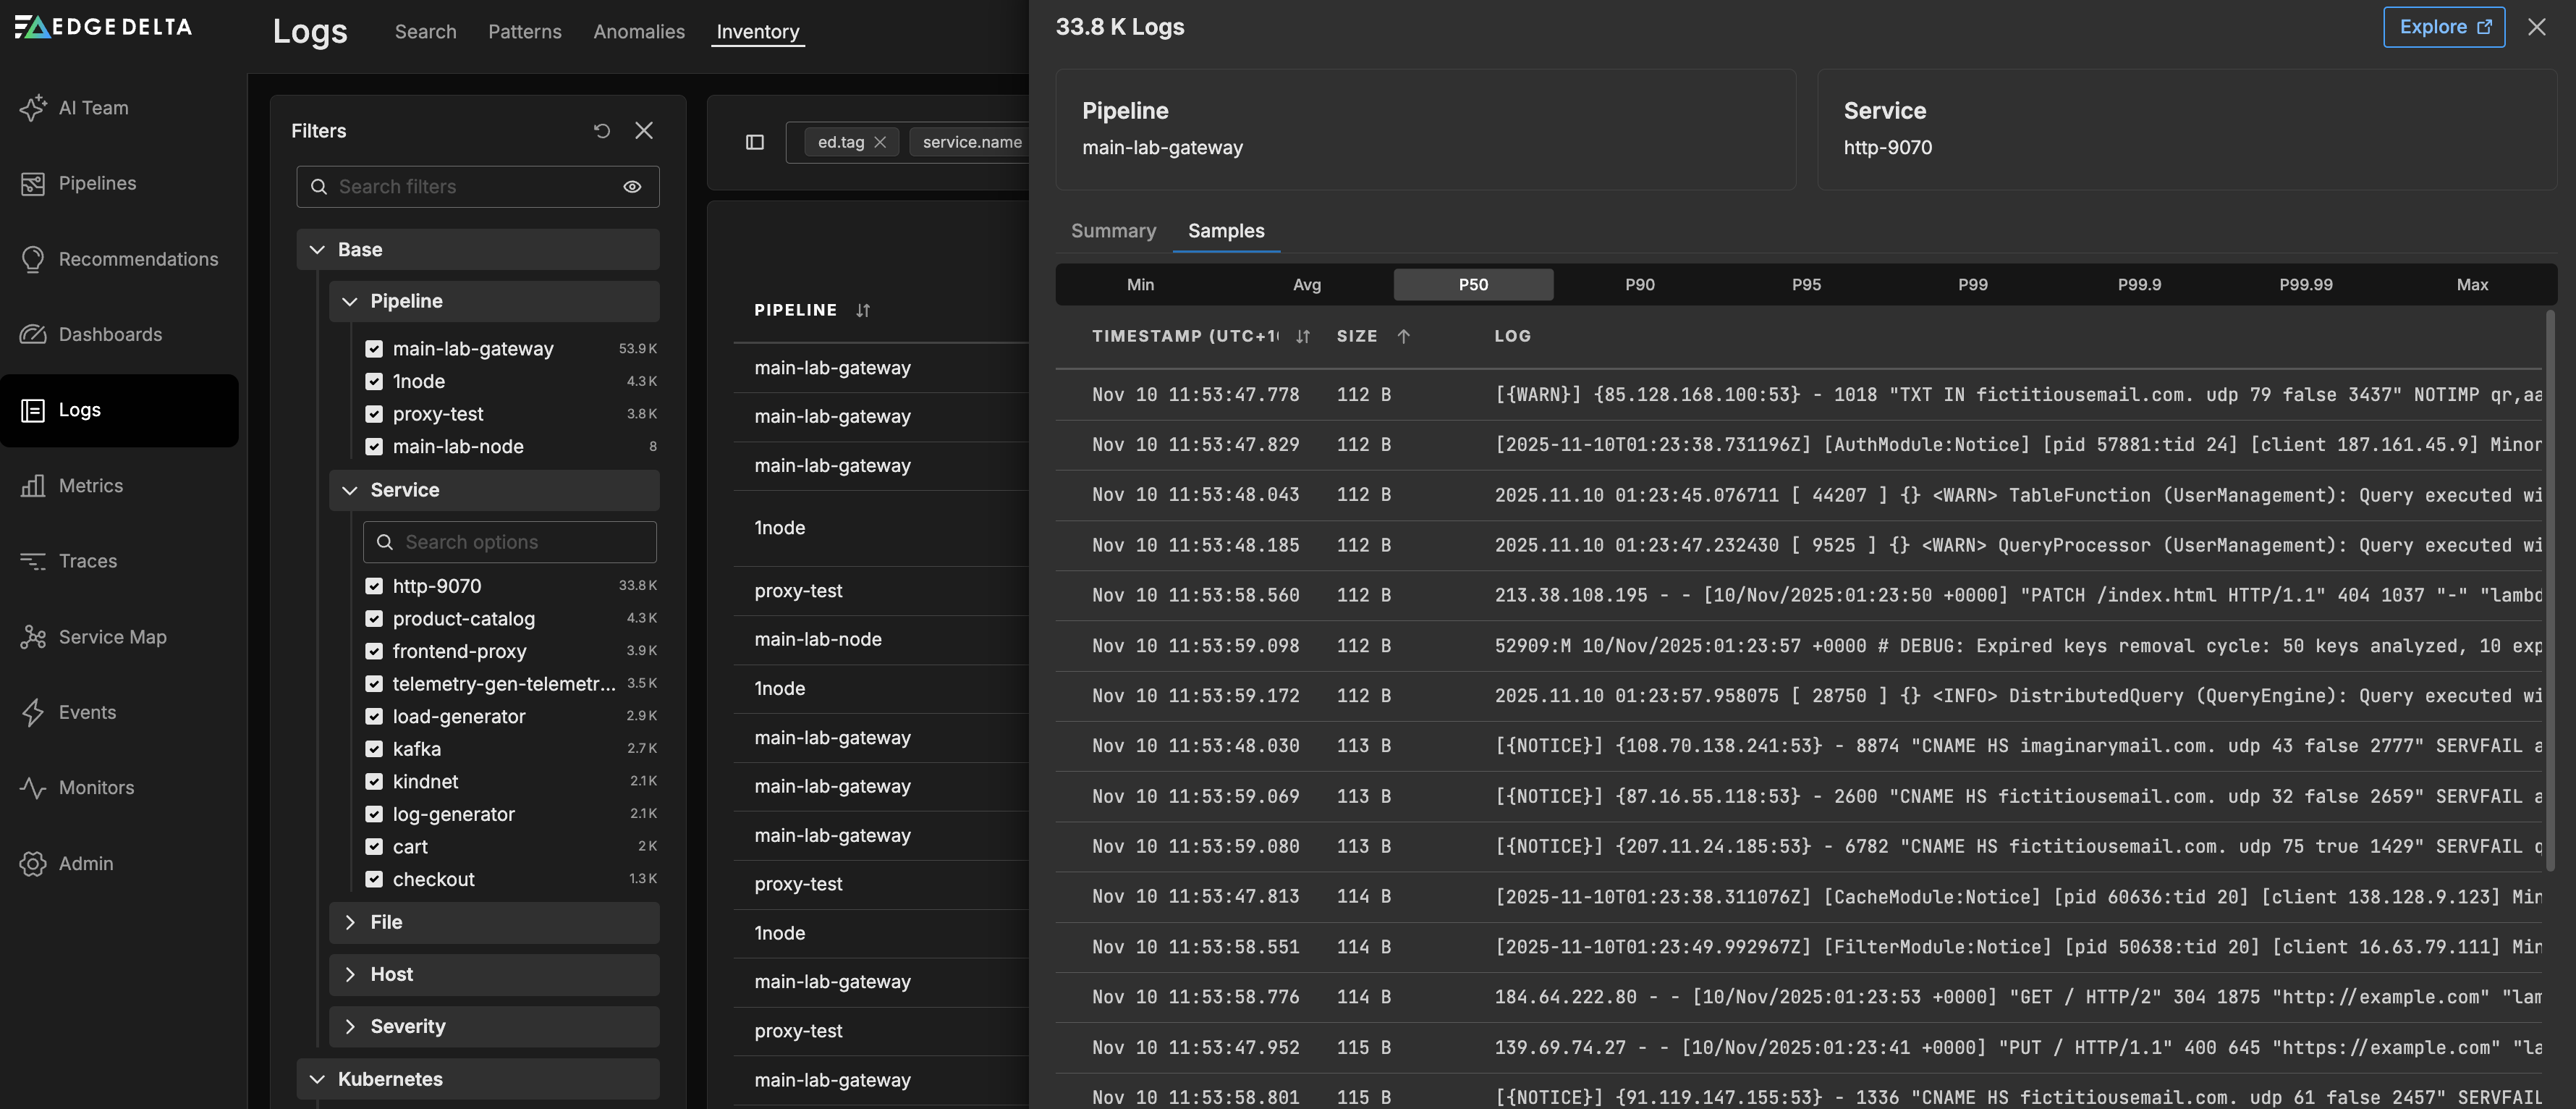
When you select a log entry in the Samples pane, you can view:
- Body: The main log message content
- Attributes: Log-specific attributes
- Resource Attributes: Resource-level metadata

Exploring Logs in Context
Explore Button
Click the Explore button from either the Summary or Samples tab to open the Log Explorer with filters and queries pre-configured to the context you were viewing. This includes:
- The selected pipeline and service filters
- The specific metric filter (e.g., P50, P90, P99) if you were viewing a particular percentile
This allows you to seamlessly transition from inventory analysis to detailed log exploration.
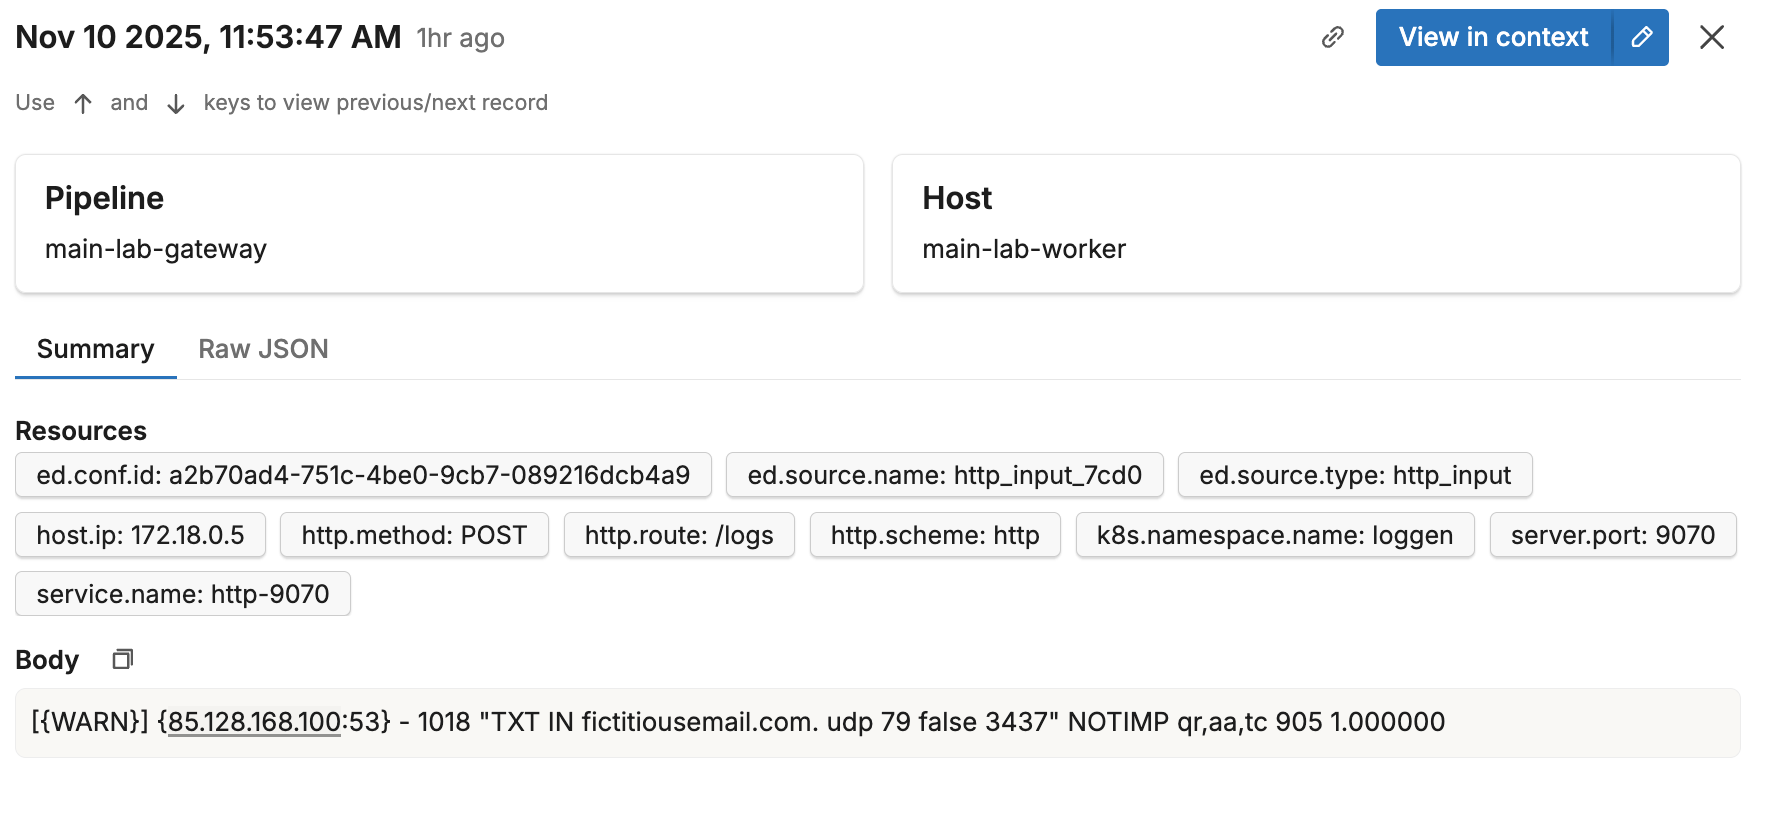
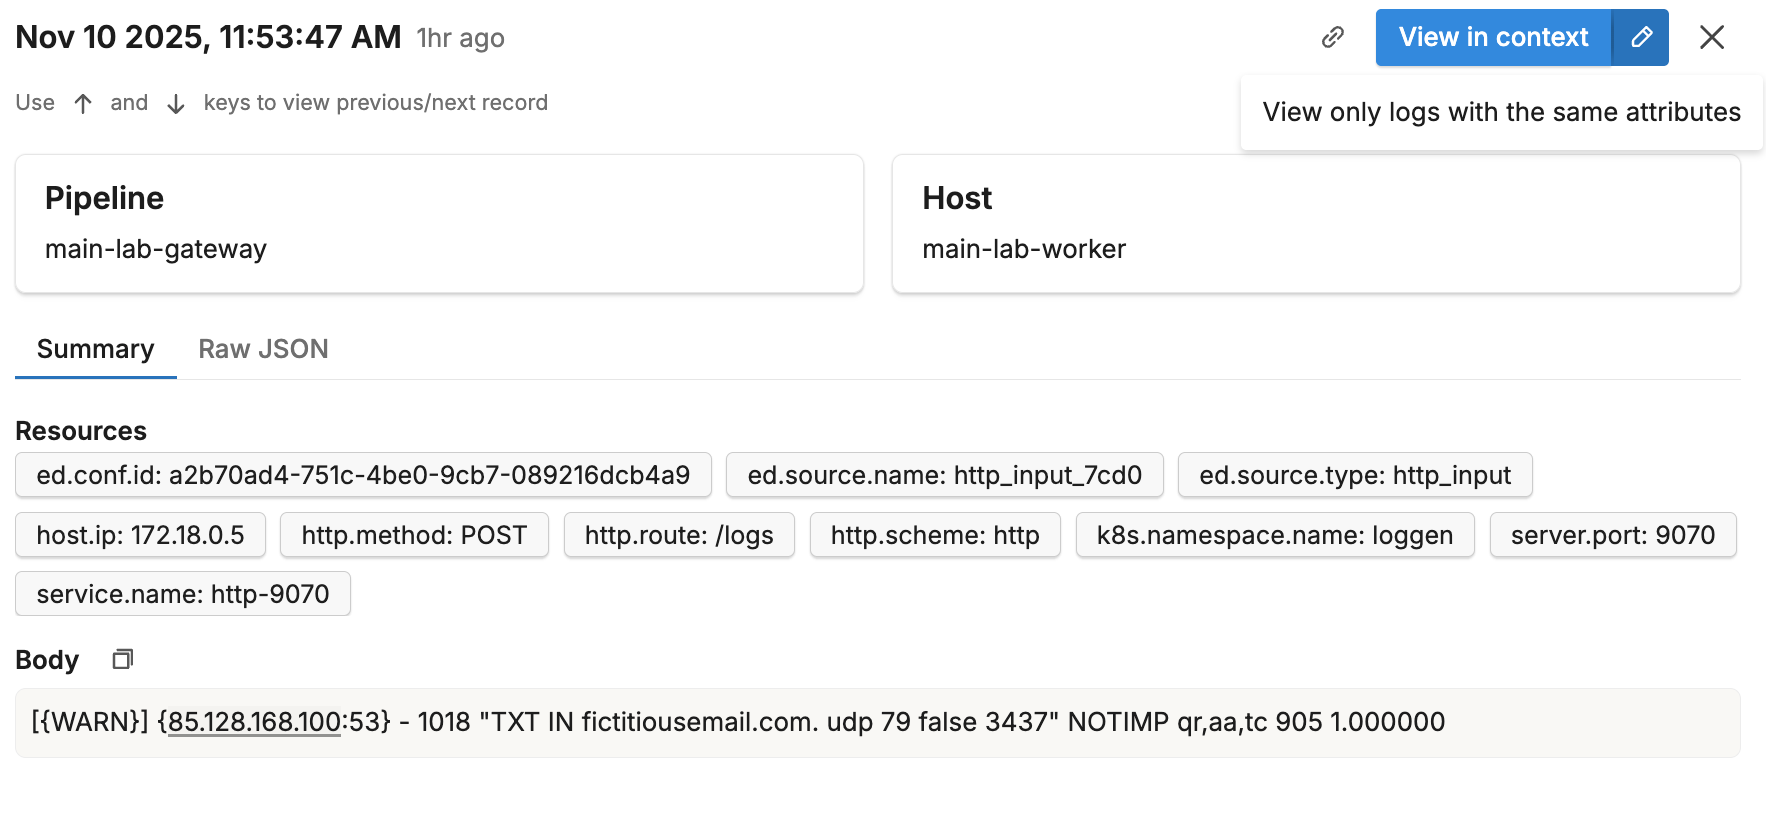
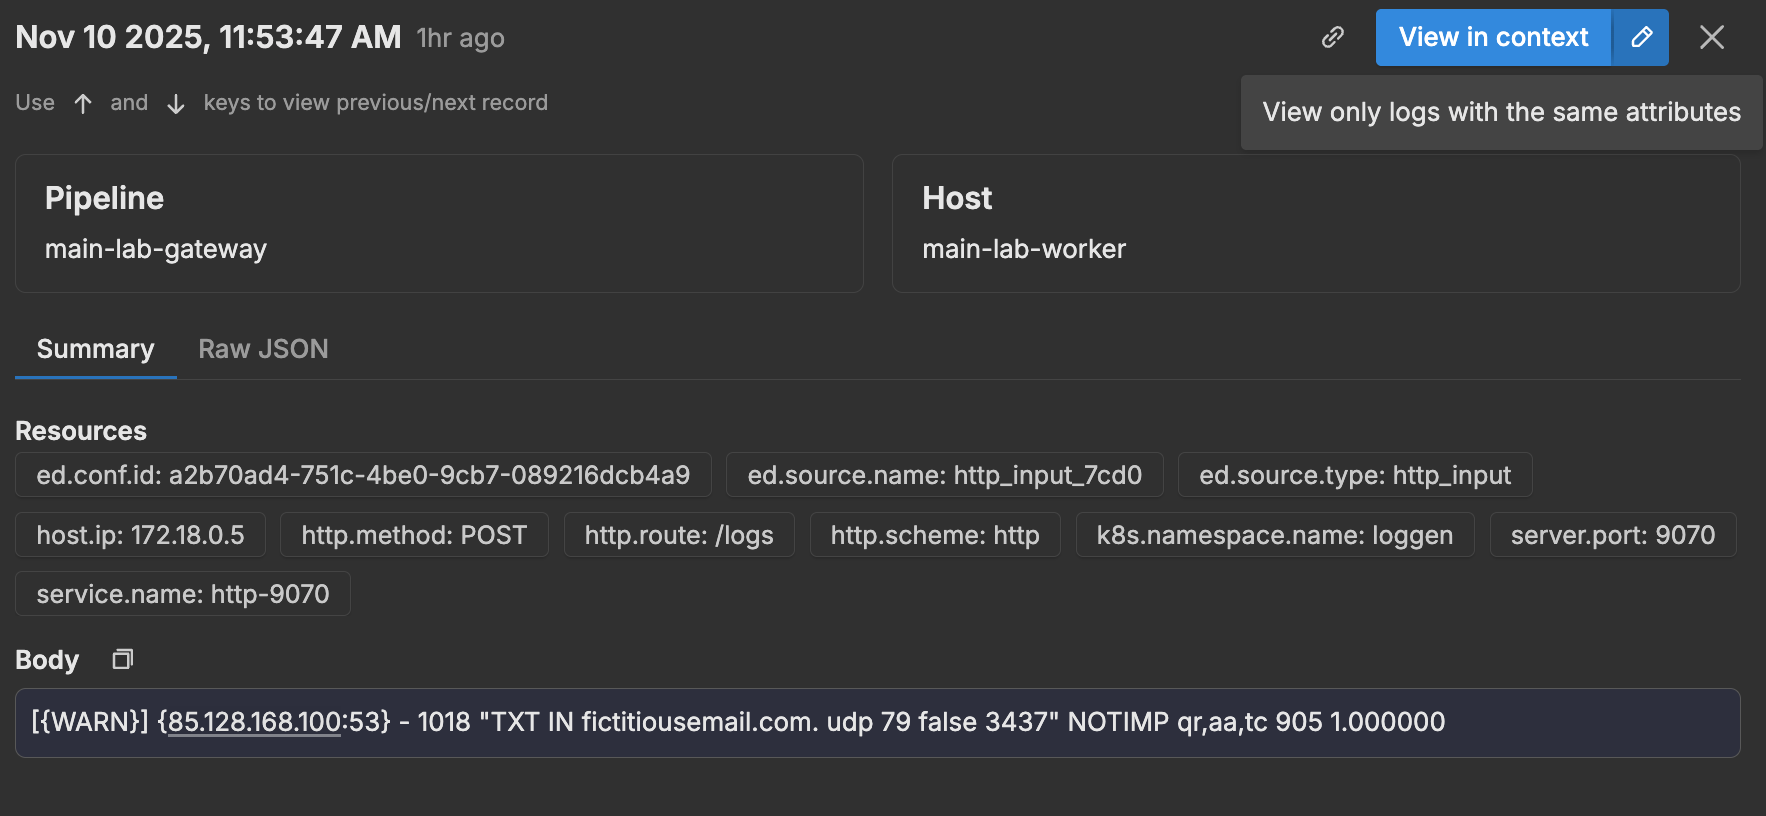
View in Context
When viewing a specific log in the Samples pane, click the View in Context button to view that particular log in the Log Explorer surrounded by its preceding and subsequent logs. The view is automatically filtered to the same pipeline, allowing you to understand the log in the context of the surrounding activity.
Analyze Logs
You can use the DMAIC (Define, Measure, Analyze, Improve, Control) framework to analyze and optimize log collection:
Define:
- Identify Critical Services: Determine which services require detailed logging and monitoring.
Measure:
- Aggregate Log Data: Use Pipelines to consolidate logs from various sources to understand the overall logging picture.
- Use Dashboards: Implement dashboards to visualize log patterns for easier analysis and real-time monitoring.
Analyze:
- Establish Baselines: Define normal log volumes and sizes based on historical data.
- Monitor for Anomalies: Set up alerts for unusual log volume or size patterns that might indicate issues.
- Analyze Log Patterns: Study log generation patterns to understand peak times, verbose services, and logging bottlenecks.
- Identify High-Volume Sources: Focus on services with high count or volume metrics that may be generating excessive logs.
Improve:
- Optimize Log Collection: Configure appropriate log levels, filters, or exclusions based on the analyzed patterns.
- Reduce Noise: Filter out non-essential logs while maintaining critical observability.
Control:
- Regular Audits: Continually audit log inventory to ensure configurations remain optimal as services and workloads change.
- Feedback Loops: Incorporate feedback from monitoring results into planning and executing further optimizations iteratively.
- Document Changes: Maintain clear documentation of logging configurations and any changes made as a result of optimizations.
Optimize Log Collection
Depending on the source of logs, you can optimize collection in multiple ways:
- Use the Filter Processor to exclude unwanted log patterns based on specific conditions.
- Configure log filtering at the pipeline level using filter expressions and severity levels.
- Add exclusion rules at the source level (e.g., file paths, container labels).
- Adjust service logging configurations to reduce unnecessary output.
- Use the Sample Processor to apply probabilistic sampling and reduce high-volume logs while maintaining visibility.